| Param | Original file | Final file |
|---|---|---|
| Filename | modeM0/AS1A10_123T04_9000004726_32730cztM0_level2.evt | modeM0/AS1A10_123T04_9000004726_32730cztM0_level2_quad_clean.evt |
| Size (bytes) | 470,597,760 | 61,162,560 |
| Size | 448.8 MB | 58.3 MB |
| Events in quadrant A | 2,709,097 | 396,396 |
| Events in quadrant B | 2,674,471 | 401,551 |
| Events in quadrant C | 2,624,071 | 386,712 |
| Events in quadrant D | 5,910,447 | 321,149 |
| Mode M0 | |||
|---|---|---|---|
| Quadrant | BADHDUFLAG | Total packets | Discarded packets |
| A | 0 | 11023 | 3 |
| B | 0 | 10842 | 2 |
| C | 0 | 10835 | 2 |
| D | 0 | 21253 | 2 |
| Mode M9 | |||
|---|---|---|---|
| Quadrant | BADHDUFLAG | Total packets | Discarded packets |
| A | 0 | 23 | 0 |
| B | 0 | 23 | 0 |
| C | 0 | 23 | 0 |
| D | 0 | 24 | 0 |
| Mode SS | |||
|---|---|---|---|
| Quadrant | BADHDUFLAG | Total packets | Discarded packets |
| A | 0 | 100 | 0 |
| B | 0 | 100 | 0 |
| C | 0 | 100 | 0 |
| D | 0 | 100 | 0 |
| Quadrant | Total seconds | Saturated seconds | Saturation percentage |
|---|---|---|---|
| A | 4928 | 21 | 0.426136% |
| B | 4928 | 33 | 0.669643% |
| C | 4928 | 92 | 1.866883% |
| D | 4928 | 812 | 16.477273% |
Noise dominated data is calculated using 1-second bins in cleaned event files. If a bin has >2000 counts, and if more than 50% of those come from <1% of pixels, then it is considered to be noise-dominated and hence unusable.
| Quadrant | # 1 sec bins | Bins with >0 counts | Bins with >2000 counts | High rate bins dominated by noise | Noise dominated (total time) | Noise dominated (detector-on time) | Marked lightcurve |
|---|---|---|---|---|---|---|---|
| A | 7020 | 4929 | 14 | 14 | 0.20% | 0.28% | 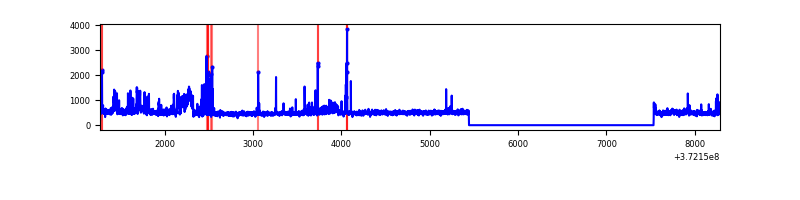 |
| B | 7020 | 4929 | 18 | 18 | 0.26% | 0.37% | 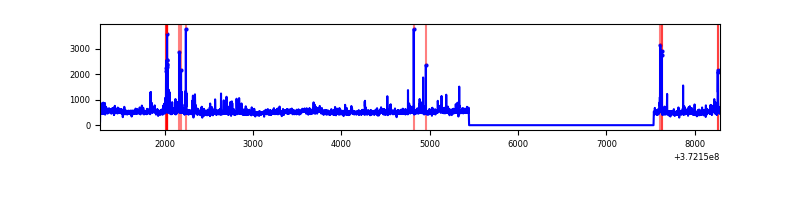 |
| C | 7020 | 4929 | 79 | 79 | 1.13% | 1.60% | 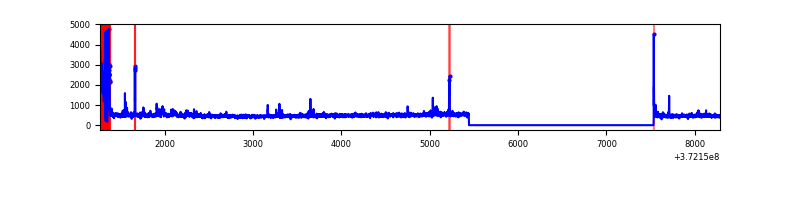 |
| D | 7020 | 4929 | 709 | 709 | 10.10% | 14.38% |  |
Top three noisy pixels from each quadrant. If the there are fewer than three noisy pixels in the level2.evt file, extra rows are filled as -1
| Pixel properties | Quadrant properties | ||||||
|---|---|---|---|---|---|---|---|
| Quadrant | DetID | PixID | Counts | Sigma | Mean | Median | Sigma |
| A | 10 | 228 | 204307 | 1693.92 | 599 | 589 | 120.3 |
| A | 15 | 249 | 171246 | 1419.01 | 599 | 589 | 120.3 |
| A | 13 | 254 | 9321 | 72.61 | 599 | 589 | 120.3 |
| B | 0 | 197 | 87056 | 766.73 | 597 | 585 | 112.8 |
| B | 0 | 183 | 56691 | 497.49 | 597 | 585 | 112.8 |
| B | 0 | 199 | 50303 | 440.84 | 597 | 585 | 112.8 |
| C | 0 | 10 | 254748 | 1934.08 | 572 | 577 | 131.4 |
| C | 3 | 233 | 56532 | 425.78 | 572 | 577 | 131.4 |
| C | 15 | 208 | 18459 | 136.07 | 572 | 577 | 131.4 |
| D | 2 | 250 | 1051320 | 8172.57 | 539 | 527 | 128.6 |
| D | 12 | 218 | 900911 | 7002.76 | 539 | 527 | 128.6 |
| D | 1 | 20 | 386886 | 3004.92 | 539 | 527 | 128.6 |
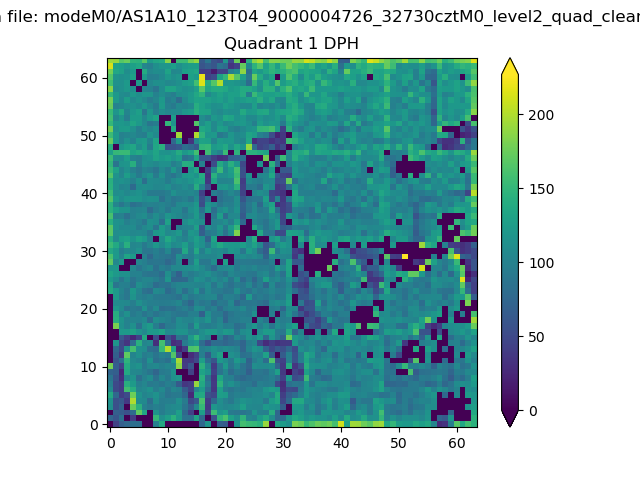
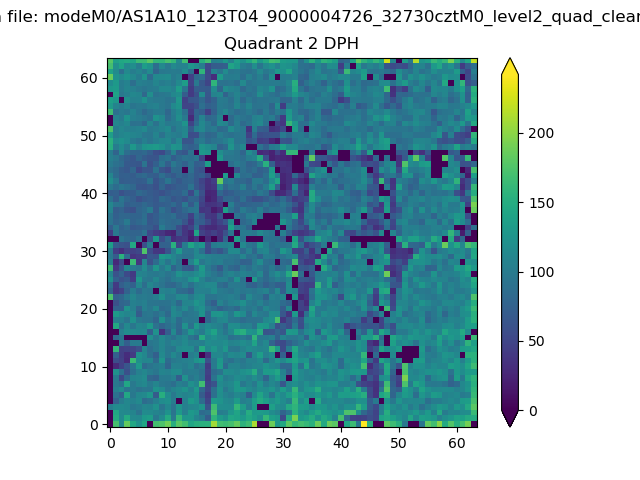
Histogram calculated using DETX and DETY for each event in the final _common_clean file
| Quadrant A | 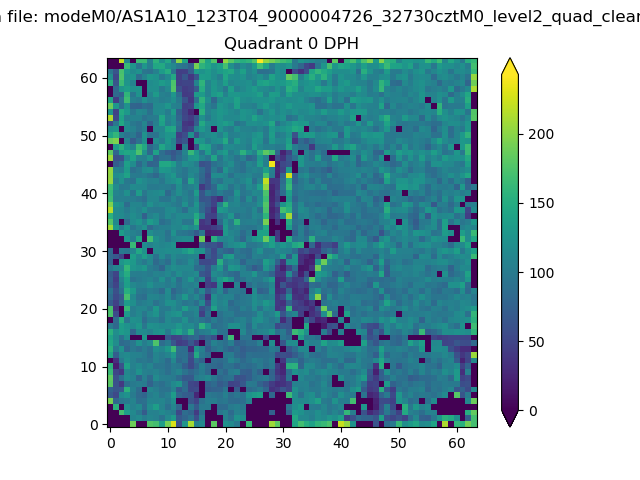 |
 |
Quadrant B |
|---|---|---|---|
| Quadrant D | 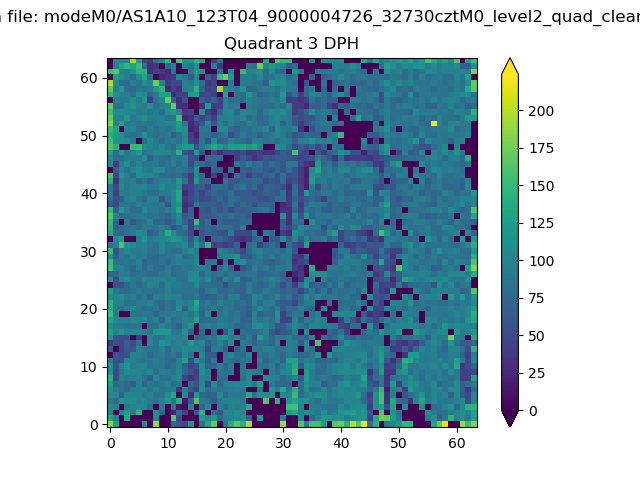 |
 |
Quadrant C |
| Plot type | Count rate plots | Images |
|---|---|---|
| Comparison with Poisson distribution Blue bars denote a histogram of data divided into 1 sec bins. Red curve is a Poisson curve with rate = median count rate of data. |
 |
 |
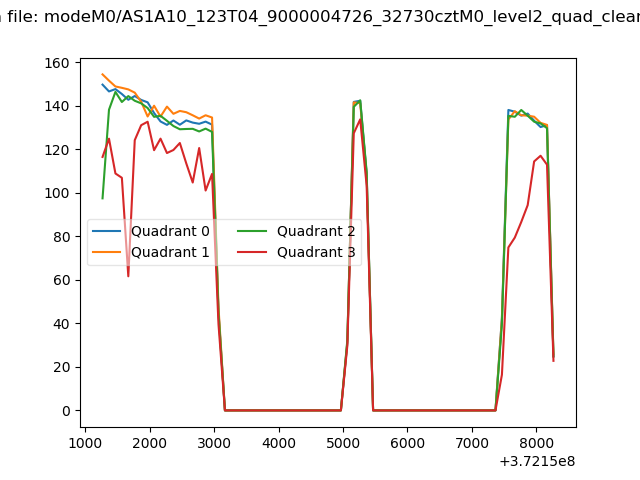
| Quadrant-wise count rates Data is divided into 100 sec bins |
 |
|
| Module-wise count rates for Quadrant A Data is divided into 100 sec bins |
 |
 |
| Module-wise count rates for Quadrant B Data is divided into 100 sec bins |
 |
 |
| Module-wise count rates for Quadrant C Data is divided into 100 sec bins |
 |
 |
| Module-wise count rates for Quadrant D Data is divided into 100 sec bins |
 |
 |
| Parameter | Plot |
|---|---|
| CZT HV Monitor |  |
| D_VDD | 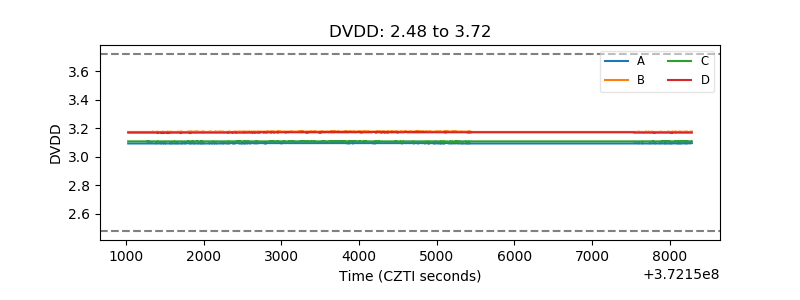 |
| Temperature 1 | 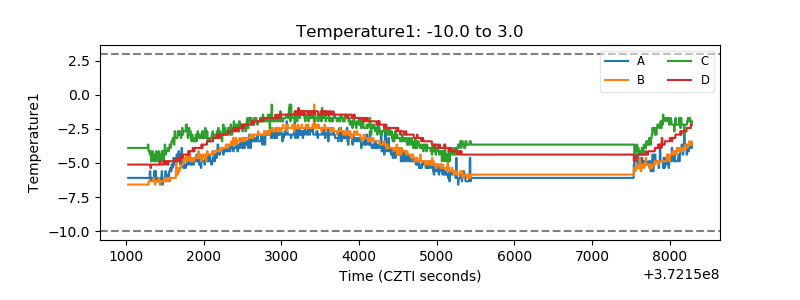 |
| Veto HV Monitor | 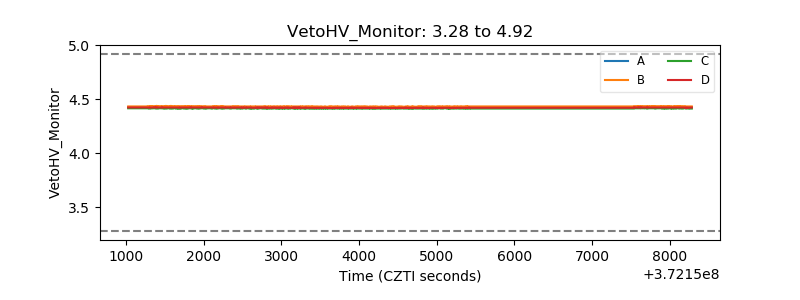 |
| Veto LLD | 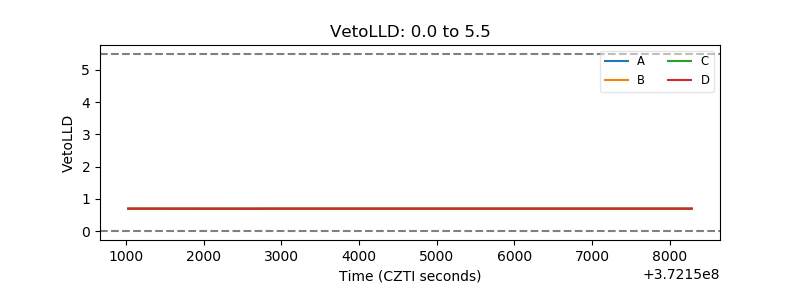 |
| Alpha Counter | 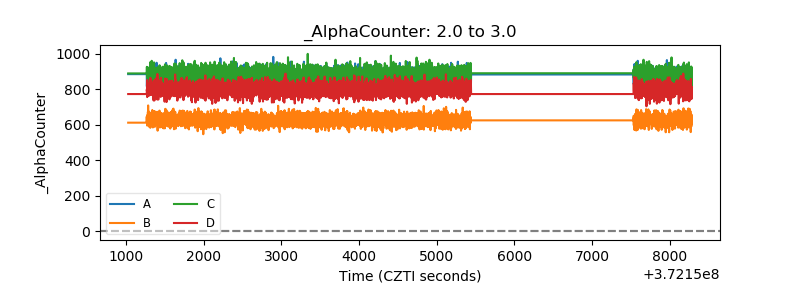 |
| _CPM_Rate | 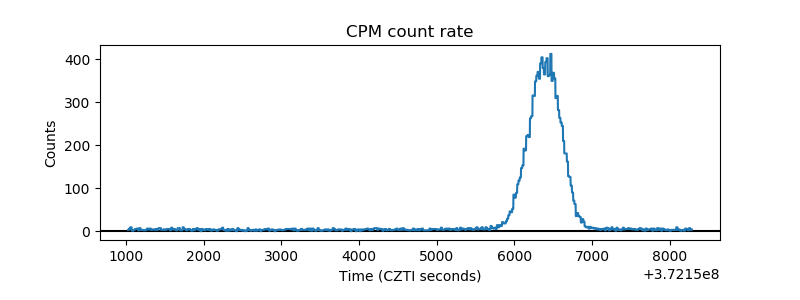 |
| CZT Counter | 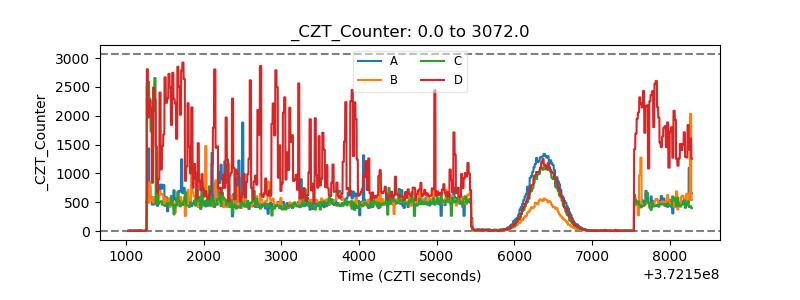 |
| +2.5 Volts monitor |  |
| +5 Volts monitor |  |
| _ROLL_ROT |  |
| _Roll_DEC | 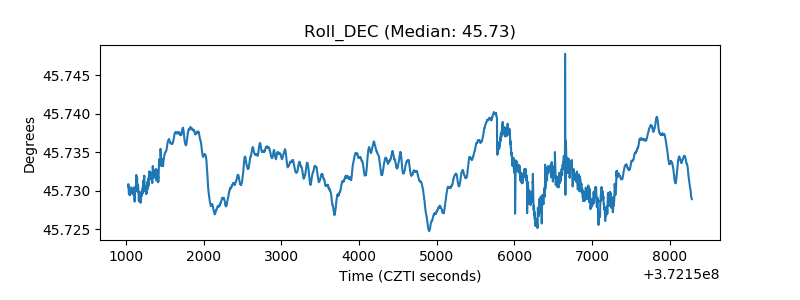 |
| _Roll_RA | 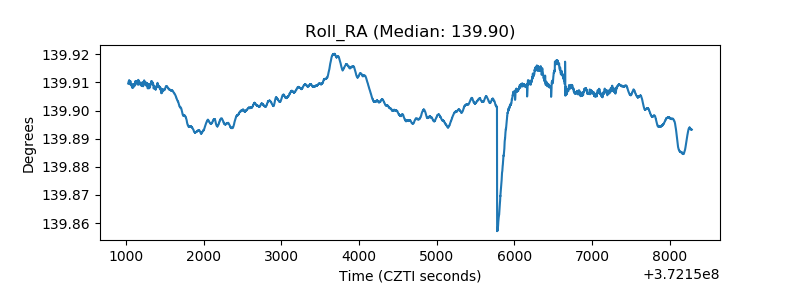 |
| Veto Counter |  |