| Param | Original file | Final file |
|---|---|---|
| Filename | modeM0/AS1A10_123T04_9000004726_32732cztM0_level2.evt | modeM0/AS1A10_123T04_9000004726_32732cztM0_level2_quad_clean.evt |
| Size (bytes) | 558,734,400 | 65,064,960 |
| Size | 532.9 MB | 62.1 MB |
| Events in quadrant A | 3,118,529 | 404,848 |
| Events in quadrant B | 5,574,950 | 400,591 |
| Events in quadrant C | 2,596,887 | 407,434 |
| Events in quadrant D | 5,260,998 | 374,463 |
| Mode M0 | |||
|---|---|---|---|
| Quadrant | BADHDUFLAG | Total packets | Discarded packets |
| A | 0 | 12807 | 3 |
| B | 0 | 20166 | 2 |
| C | 0 | 11228 | 2 |
| D | 0 | 19543 | 2 |
| Mode M9 | |||
|---|---|---|---|
| Quadrant | BADHDUFLAG | Total packets | Discarded packets |
| A | 0 | 23 | 0 |
| B | 0 | 23 | 0 |
| C | 0 | 23 | 0 |
| D | 0 | 24 | 0 |
| Mode SS | |||
|---|---|---|---|
| Quadrant | BADHDUFLAG | Total packets | Discarded packets |
| A | 0 | 112 | 0 |
| B | 0 | 112 | 0 |
| C | 0 | 112 | 0 |
| D | 0 | 112 | 0 |
| Quadrant | Total seconds | Saturated seconds | Saturation percentage |
|---|---|---|---|
| A | 5463 | 77 | 1.409482% |
| B | 5463 | 961 | 17.591067% |
| C | 5463 | 14 | 0.256269% |
| D | 5463 | 476 | 8.713161% |
Noise dominated data is calculated using 1-second bins in cleaned event files. If a bin has >2000 counts, and if more than 50% of those come from <1% of pixels, then it is considered to be noise-dominated and hence unusable.
| Quadrant | # 1 sec bins | Bins with >0 counts | Bins with >2000 counts | High rate bins dominated by noise | Noise dominated (total time) | Noise dominated (detector-on time) | Marked lightcurve |
|---|---|---|---|---|---|---|---|
| A | 7046 | 5464 | 45 | 45 | 0.64% | 0.82% | 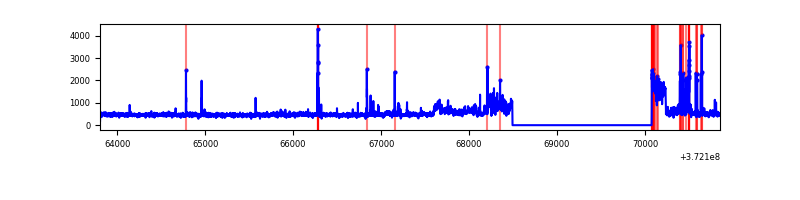 |
| B | 7046 | 5464 | 742 | 742 | 10.53% | 13.58% | 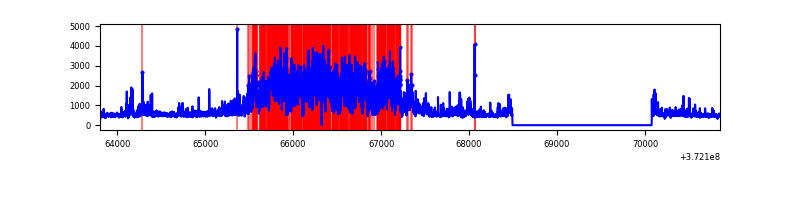 |
| C | 7046 | 5464 | 11 | 11 | 0.16% | 0.20% | 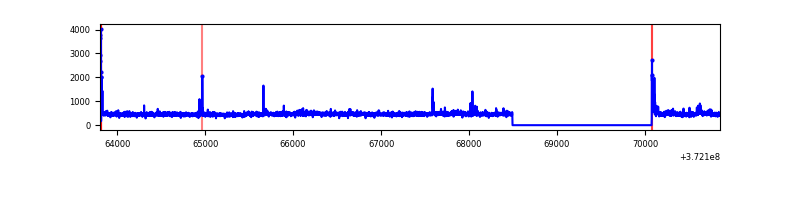 |
| D | 7046 | 5464 | 398 | 398 | 5.65% | 7.28% | 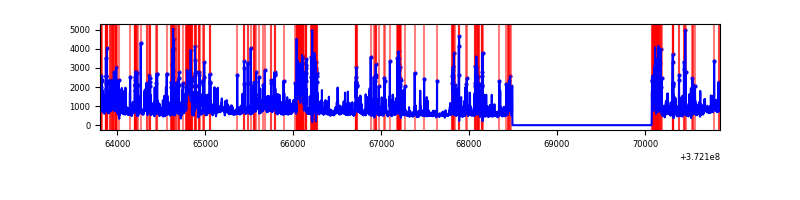 |
Top three noisy pixels from each quadrant. If the there are fewer than three noisy pixels in the level2.evt file, extra rows are filled as -1
| Pixel properties | Quadrant properties | ||||||
|---|---|---|---|---|---|---|---|
| Quadrant | DetID | PixID | Counts | Sigma | Mean | Median | Sigma |
| A | 15 | 249 | 607092 | 4726.0 | 638 | 625 | 128.3 |
| A | 15 | 237 | 15135 | 113.07 | 638 | 625 | 128.3 |
| A | 13 | 254 | 9482 | 69.02 | 638 | 625 | 128.3 |
| B | 12 | 1 | 2573241 | 22521.35 | 599 | 586 | 114.2 |
| B | 0 | 199 | 228822 | 1998.01 | 599 | 586 | 114.2 |
| B | 0 | 197 | 91144 | 792.76 | 599 | 586 | 114.2 |
| C | 3 | 233 | 59400 | 406.54 | 620 | 624 | 144.6 |
| C | 0 | 10 | 51855 | 354.36 | 620 | 624 | 144.6 |
| C | 9 | 54 | 19998 | 134.01 | 620 | 624 | 144.6 |
| D | 2 | 250 | 402530 | 2858.47 | 597 | 585 | 140.6 |
| D | 12 | 218 | 339248 | 2408.43 | 597 | 585 | 140.6 |
| D | 10 | 203 | 325222 | 2308.69 | 597 | 585 | 140.6 |
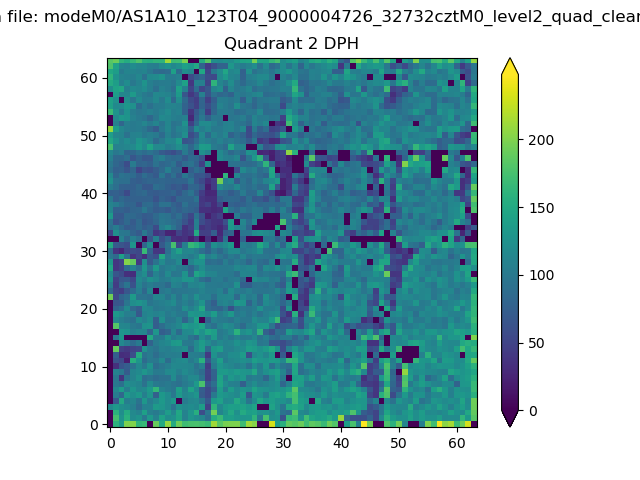
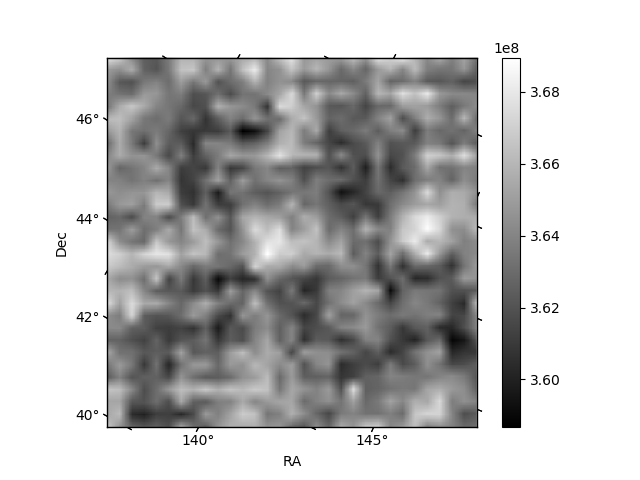
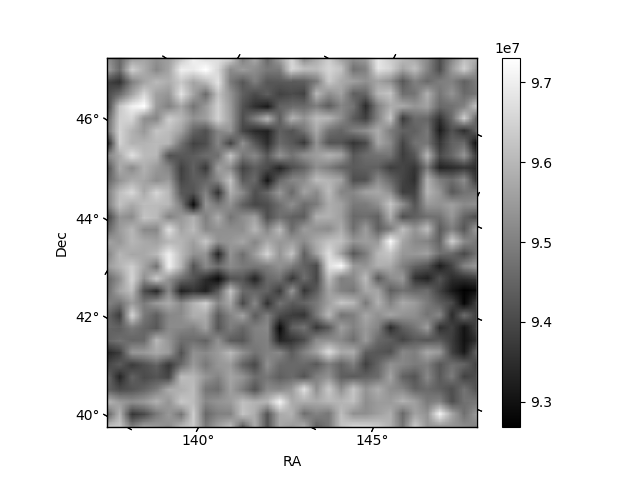
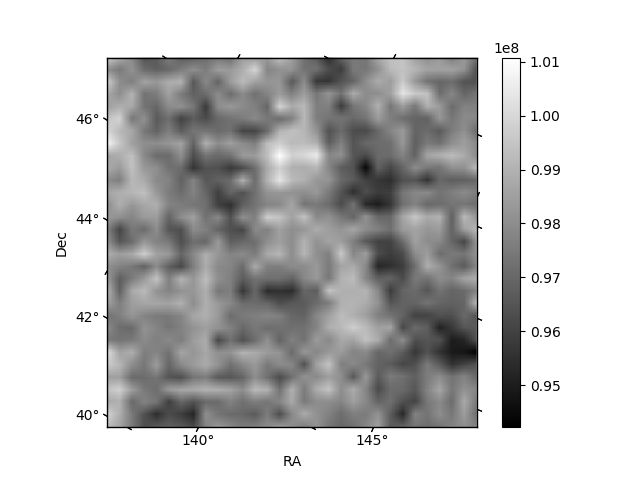
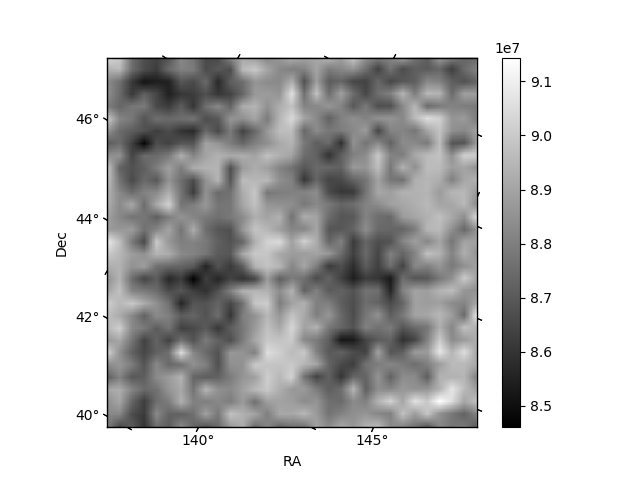
Histogram calculated using DETX and DETY for each event in the final _common_clean file
| Quadrant A | 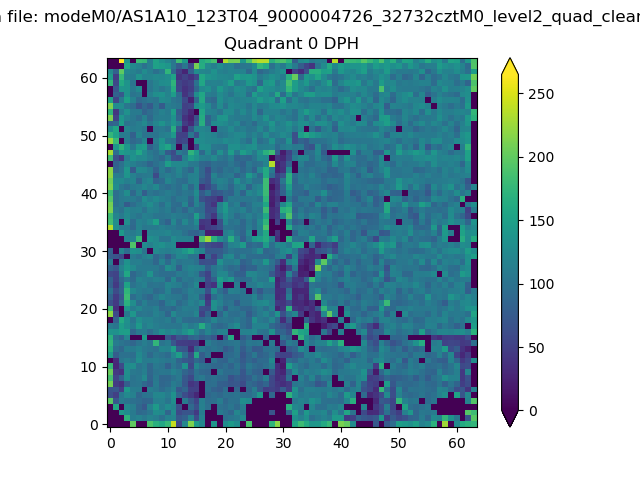 |
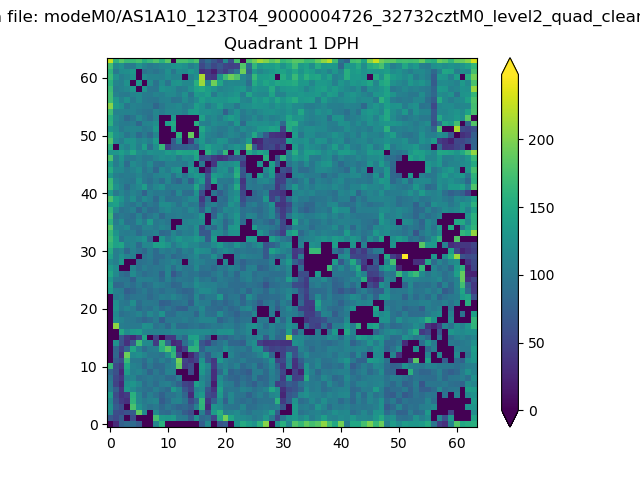 |
Quadrant B |
|---|---|---|---|
| Quadrant D | 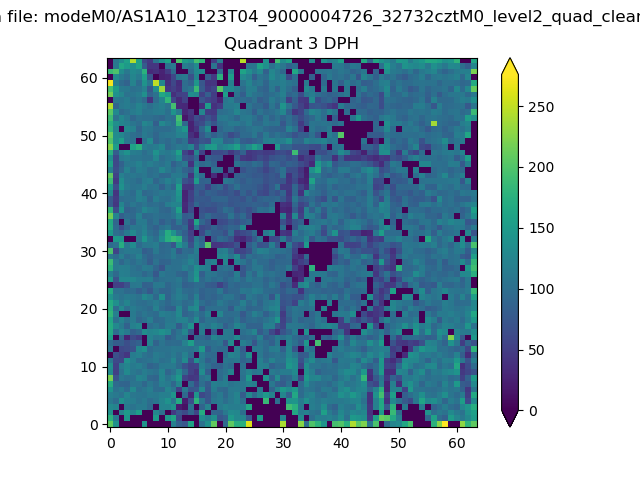 |
 |
Quadrant C |
| Plot type | Count rate plots | Images |
|---|---|---|
| Comparison with Poisson distribution Blue bars denote a histogram of data divided into 1 sec bins. Red curve is a Poisson curve with rate = median count rate of data. |
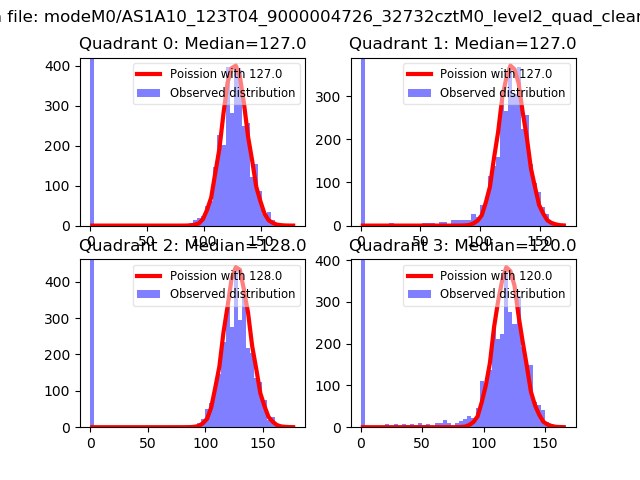 |
 |
| Quadrant-wise count rates Data is divided into 100 sec bins |
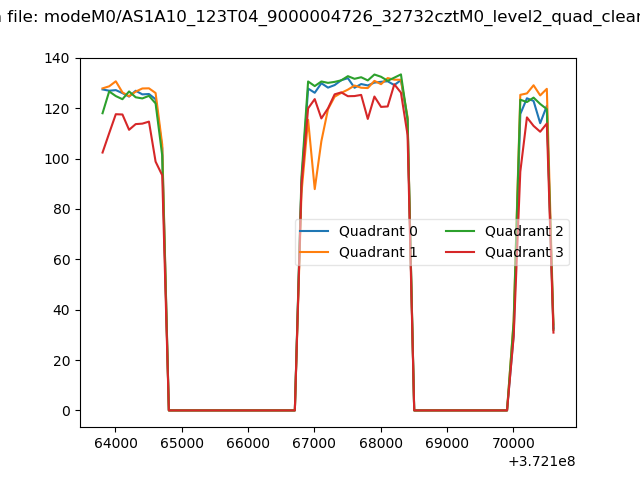 |
|
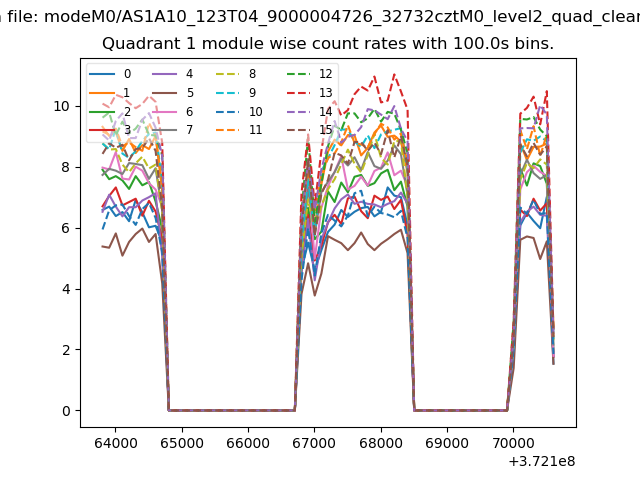
| Module-wise count rates for Quadrant A Data is divided into 100 sec bins |
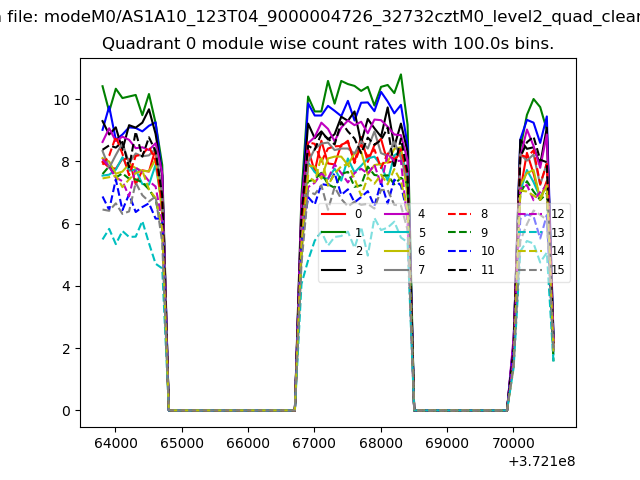 |
 |
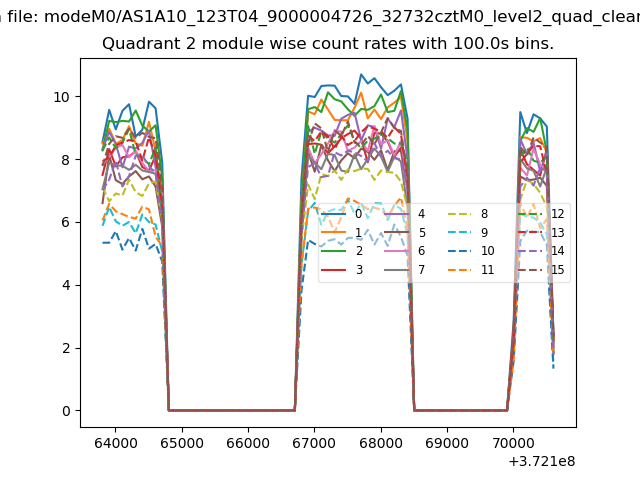
| Module-wise count rates for Quadrant B Data is divided into 100 sec bins |
 |
 |
| Module-wise count rates for Quadrant C Data is divided into 100 sec bins |
 |
 |
| Module-wise count rates for Quadrant D Data is divided into 100 sec bins |
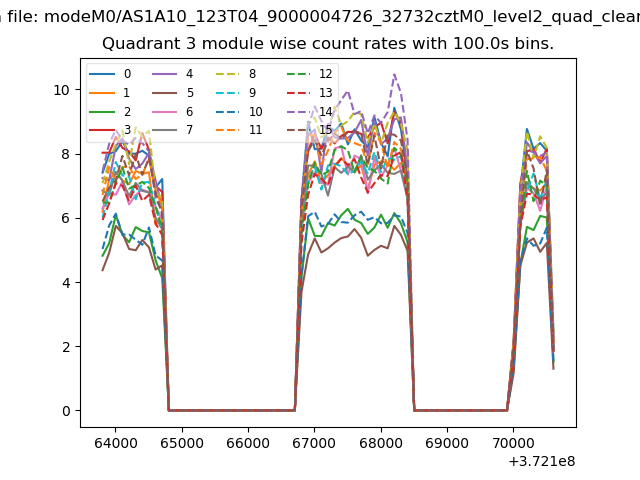 |
 |
| Parameter | Plot |
|---|---|
| CZT HV Monitor | 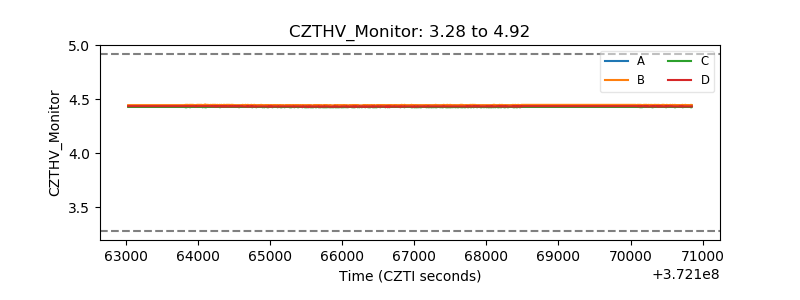 |
| D_VDD | 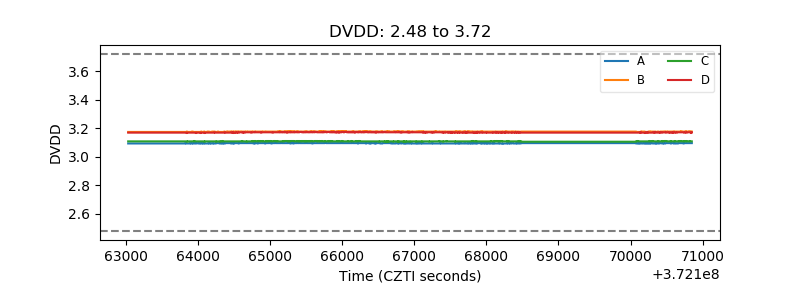 |
| Temperature 1 | 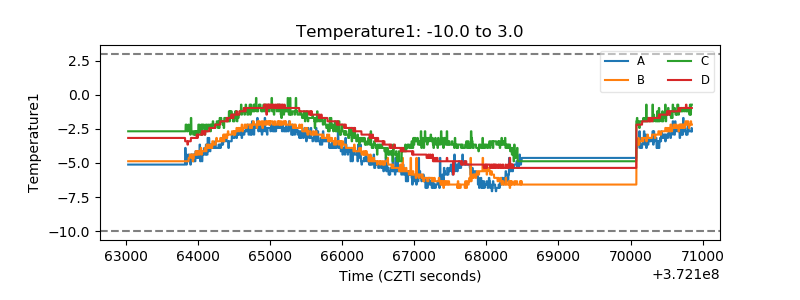 |
| Veto HV Monitor | 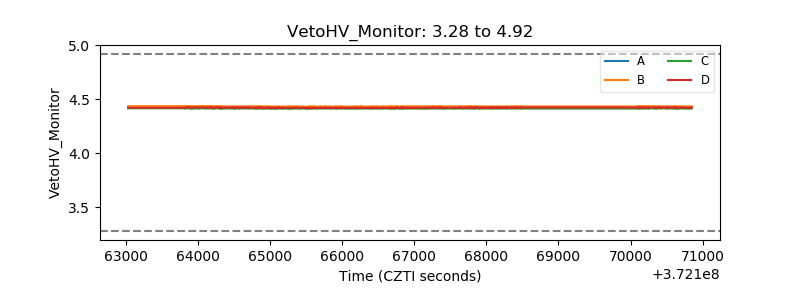 |
| Veto LLD | 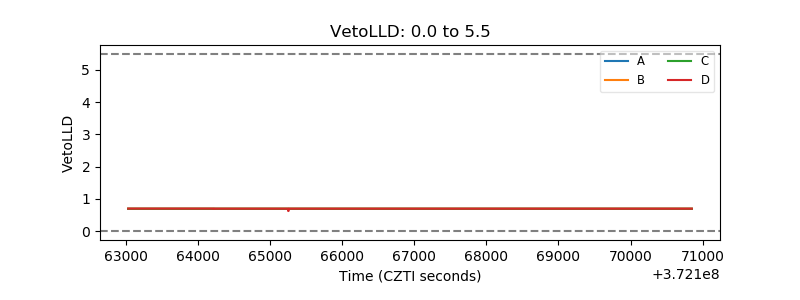 |
| Alpha Counter | 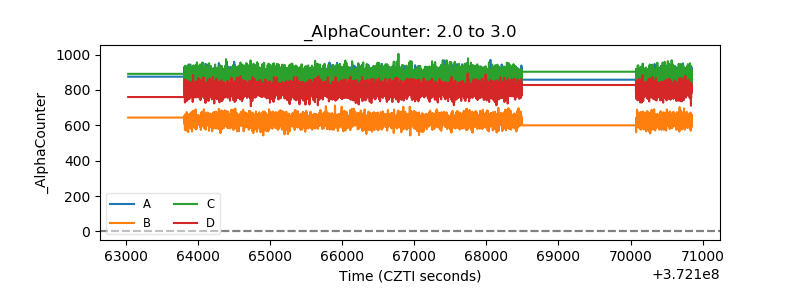 |
| _CPM_Rate | 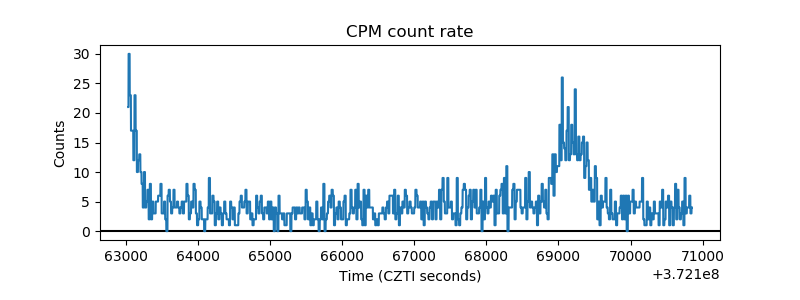 |
| CZT Counter | 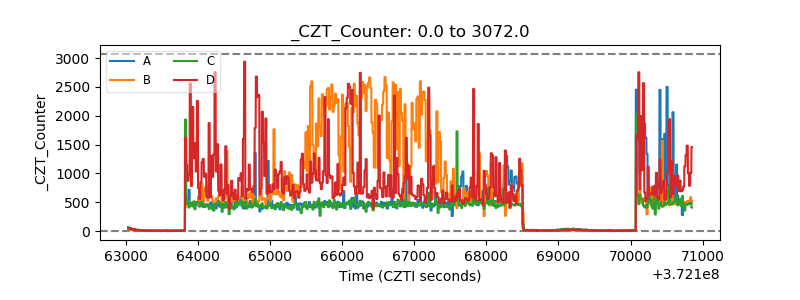 |
| +2.5 Volts monitor |  |
| +5 Volts monitor |  |
| _ROLL_ROT | 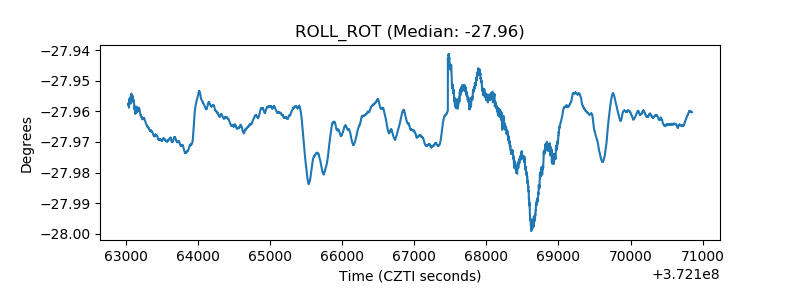 |
| _Roll_DEC | 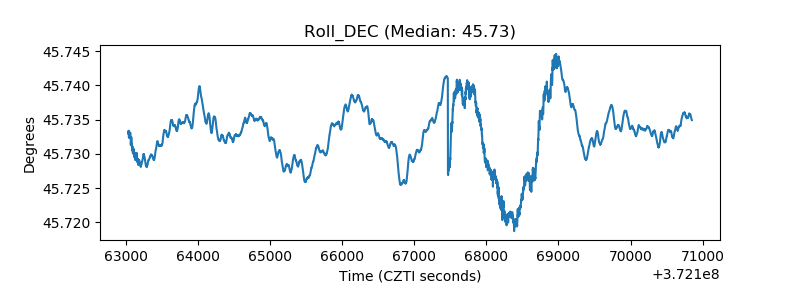 |
| _Roll_RA | 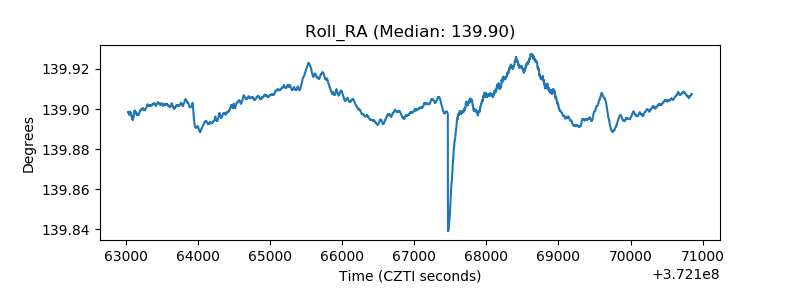 |
| Veto Counter | 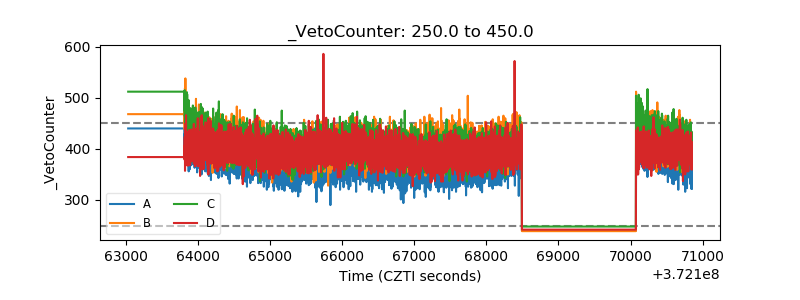 |