| Param | Original file | Final file |
|---|---|---|
| Filename | modeM0/AS1A10_123T04_9000004726_32734cztM0_level2.evt | modeM0/AS1A10_123T04_9000004726_32734cztM0_level2_quad_clean.evt |
| Size (bytes) | 473,520,960 | 61,266,240 |
| Size | 451.6 MB | 58.4 MB |
| Events in quadrant A | 3,044,465 | 362,812 |
| Events in quadrant B | 3,158,613 | 362,551 |
| Events in quadrant C | 2,840,687 | 365,949 |
| Events in quadrant D | 4,892,226 | 346,977 |
| Mode M0 | |||
|---|---|---|---|
| Quadrant | BADHDUFLAG | Total packets | Discarded packets |
| A | 0 | 12918 | 3 |
| B | 0 | 13102 | 2 |
| C | 0 | 12382 | 2 |
| D | 0 | 18672 | 2 |
| Mode M9 | |||
|---|---|---|---|
| Quadrant | BADHDUFLAG | Total packets | Discarded packets |
| A | 0 | 15 | 0 |
| B | 0 | 15 | 0 |
| C | 0 | 15 | 0 |
| D | 0 | 16 | 0 |
| Mode SS | |||
|---|---|---|---|
| Quadrant | BADHDUFLAG | Total packets | Discarded packets |
| A | 0 | 120 | 0 |
| B | 0 | 120 | 0 |
| C | 0 | 120 | 0 |
| D | 0 | 120 | 0 |
| Quadrant | Total seconds | Saturated seconds | Saturation percentage |
|---|---|---|---|
| A | 5966 | 142 | 2.380154% |
| B | 5966 | 44 | 0.737513% |
| C | 5966 | 30 | 0.502849% |
| D | 5966 | 269 | 4.508884% |
Noise dominated data is calculated using 1-second bins in cleaned event files. If a bin has >2000 counts, and if more than 50% of those come from <1% of pixels, then it is considered to be noise-dominated and hence unusable.
| Quadrant | # 1 sec bins | Bins with >0 counts | Bins with >2000 counts | High rate bins dominated by noise | Noise dominated (total time) | Noise dominated (detector-on time) | Marked lightcurve |
|---|---|---|---|---|---|---|---|
| A | 7278 | 5967 | 115 | 115 | 1.58% | 1.93% |  |
| B | 7278 | 5967 | 23 | 23 | 0.32% | 0.39% | 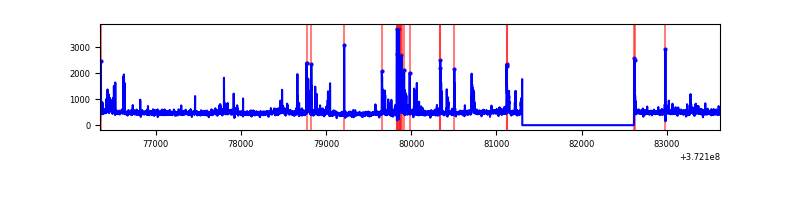 |
| C | 7278 | 5967 | 20 | 20 | 0.27% | 0.34% | 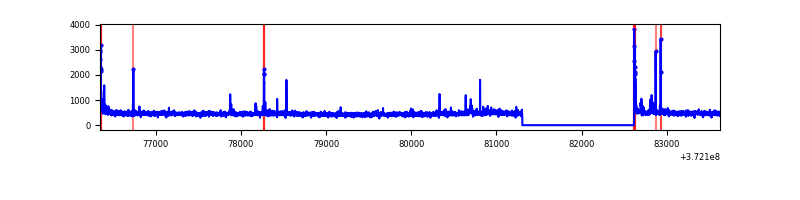 |
| D | 7278 | 5967 | 221 | 221 | 3.04% | 3.70% | 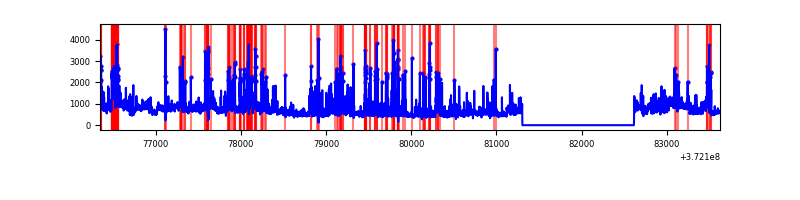 |
Top three noisy pixels from each quadrant. If the there are fewer than three noisy pixels in the level2.evt file, extra rows are filled as -1
| Pixel properties | Quadrant properties | ||||||
|---|---|---|---|---|---|---|---|
| Quadrant | DetID | PixID | Counts | Sigma | Mean | Median | Sigma |
| A | 15 | 249 | 269191 | 1898.48 | 697 | 683 | 141.4 |
| A | 15 | 237 | 78547 | 550.54 | 697 | 683 | 141.4 |
| A | 13 | 254 | 11323 | 75.23 | 697 | 683 | 141.4 |
| B | 3 | 26 | 152282 | 1141.96 | 698 | 682 | 132.8 |
| B | 5 | 172 | 80051 | 597.86 | 698 | 682 | 132.8 |
| B | 0 | 199 | 53703 | 399.39 | 698 | 682 | 132.8 |
| C | 0 | 10 | 81045 | 508.81 | 678 | 684 | 157.9 |
| C | 9 | 54 | 45223 | 282.0 | 678 | 684 | 157.9 |
| C | 7 | 247 | 12427 | 74.35 | 678 | 684 | 157.9 |
| D | 8 | 195 | 669764 | 4229.07 | 665 | 651 | 158.2 |
| D | 2 | 250 | 363594 | 2293.95 | 665 | 651 | 158.2 |
| D | 12 | 233 | 241617 | 1523.01 | 665 | 651 | 158.2 |
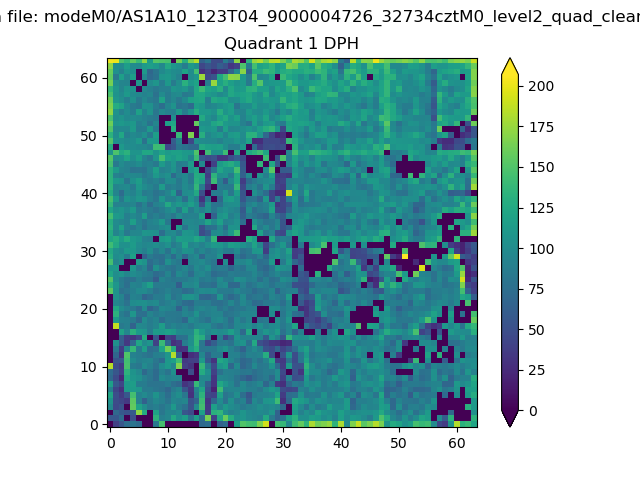
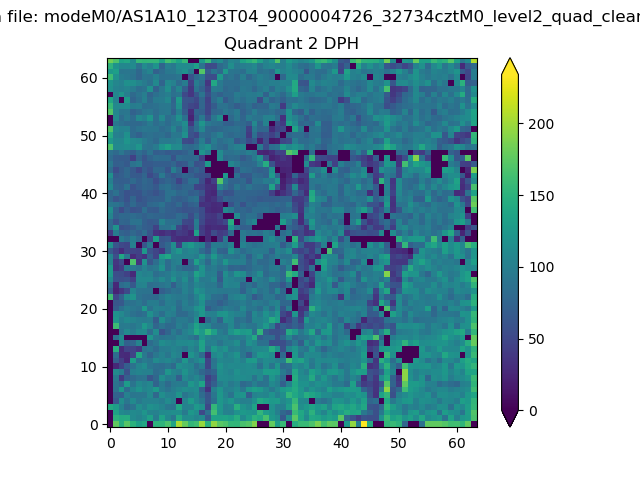
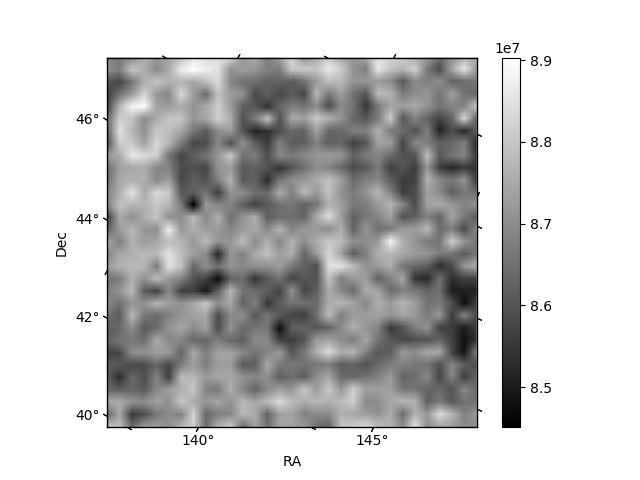
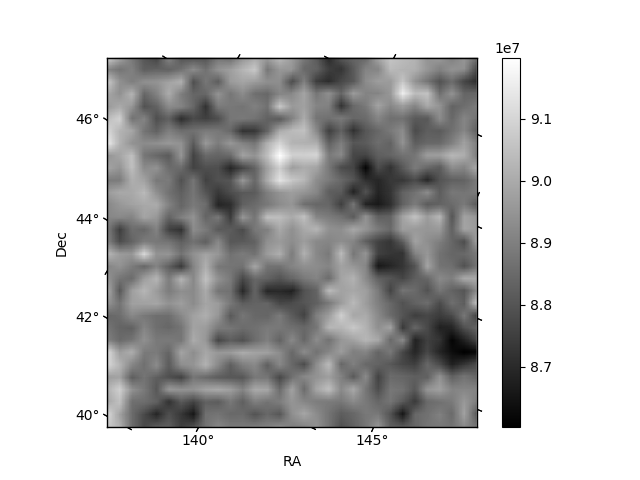
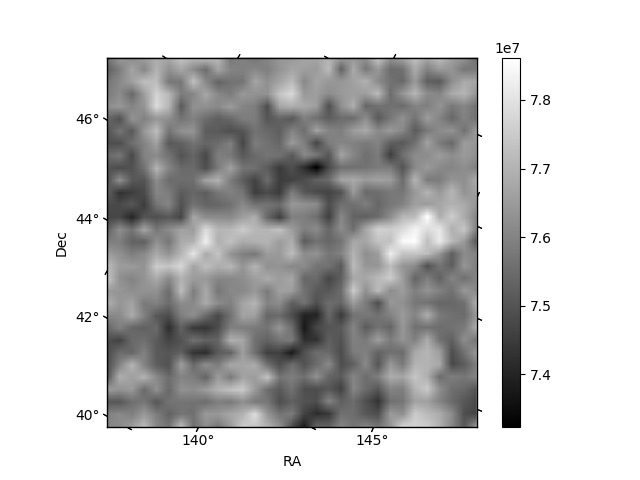
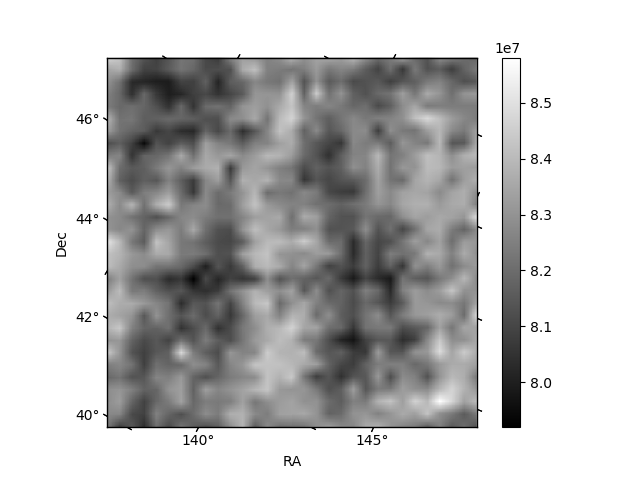
Histogram calculated using DETX and DETY for each event in the final _common_clean file
| Quadrant A | 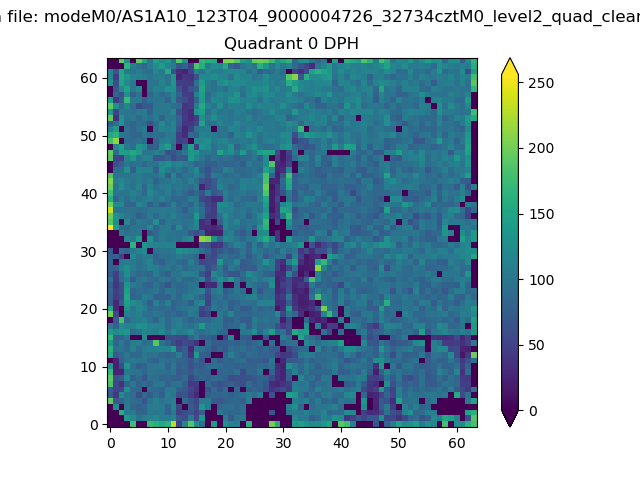 |
 |
Quadrant B |
|---|---|---|---|
| Quadrant D | 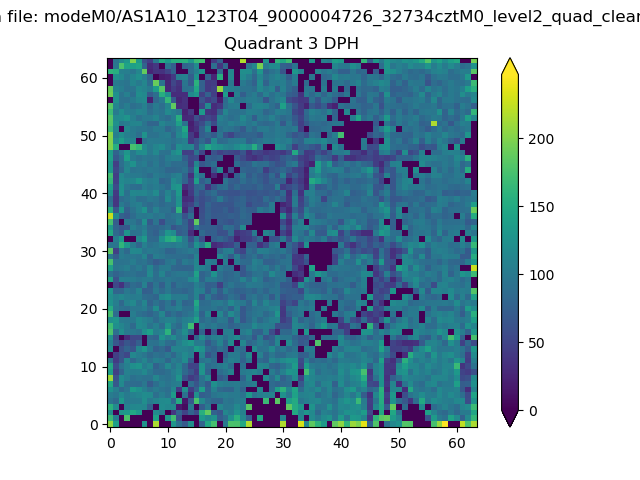 |
 |
Quadrant C |
| Plot type | Count rate plots | Images |
|---|---|---|
| Comparison with Poisson distribution Blue bars denote a histogram of data divided into 1 sec bins. Red curve is a Poisson curve with rate = median count rate of data. |
 |
 |
| Quadrant-wise count rates Data is divided into 100 sec bins |
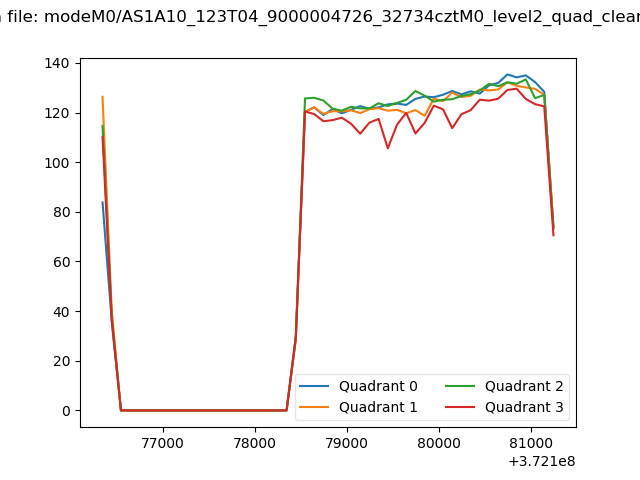 |
|
| Module-wise count rates for Quadrant A Data is divided into 100 sec bins |
 |
 |
| Module-wise count rates for Quadrant B Data is divided into 100 sec bins |
 |
 |
| Module-wise count rates for Quadrant C Data is divided into 100 sec bins |
 |
 |
| Module-wise count rates for Quadrant D Data is divided into 100 sec bins |
 |
 |
| Parameter | Plot |
|---|---|
| CZT HV Monitor | 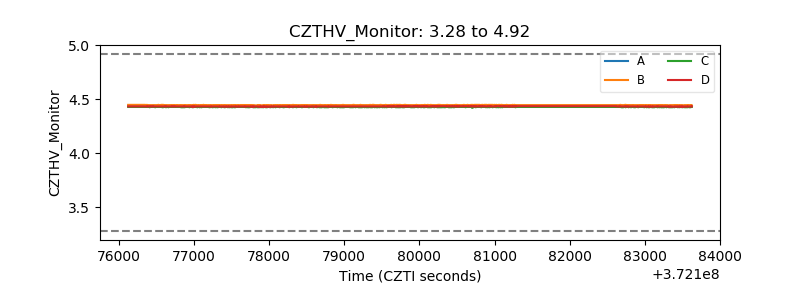 |
| D_VDD | 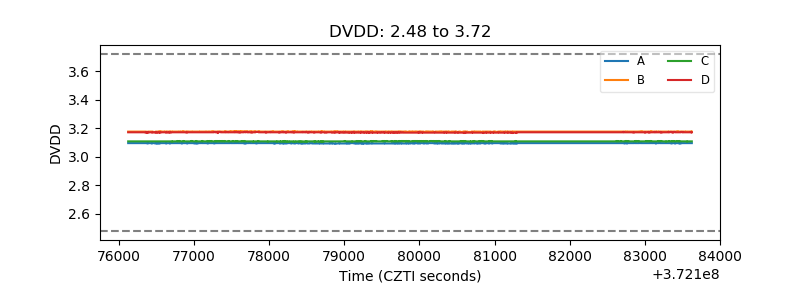 |
| Temperature 1 | 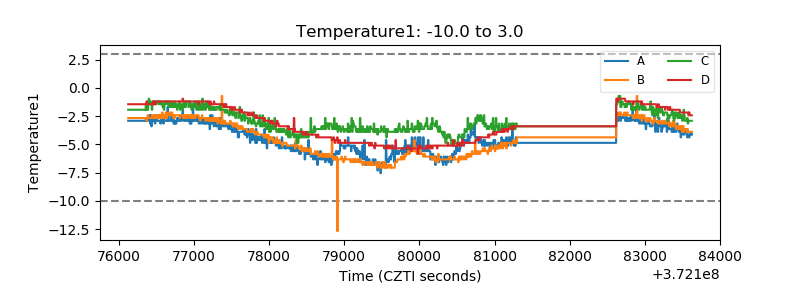 |
| Veto HV Monitor | 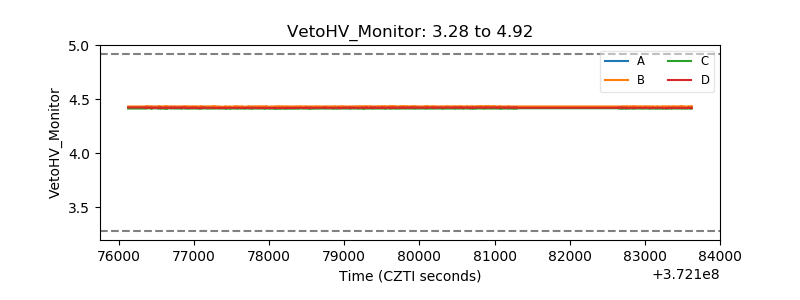 |
| Veto LLD |  |
| Alpha Counter | 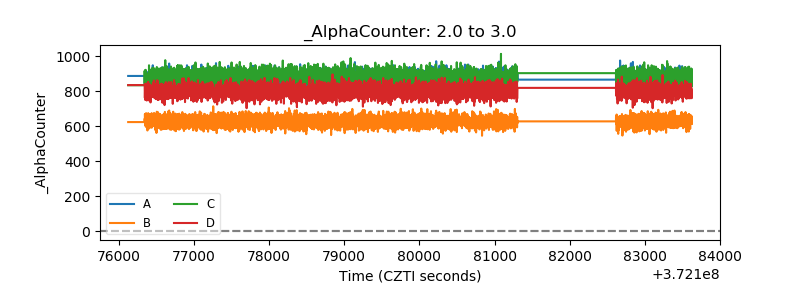 |
| _CPM_Rate | 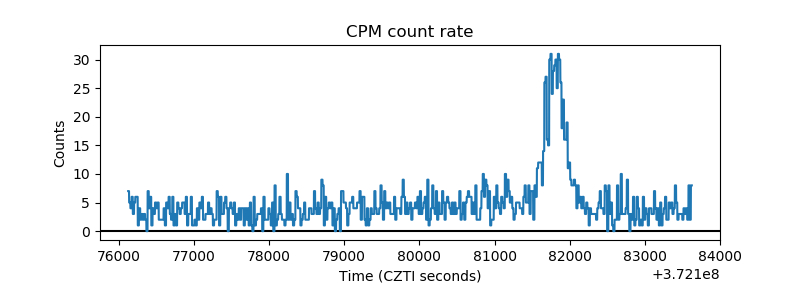 |
| CZT Counter | 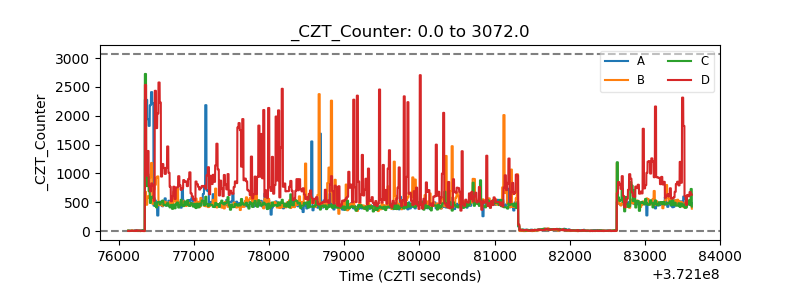 |
| +2.5 Volts monitor |  |
| +5 Volts monitor |  |
| _ROLL_ROT | 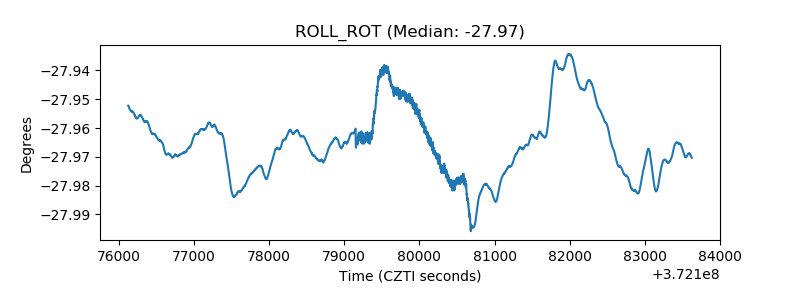 |
| _Roll_DEC | 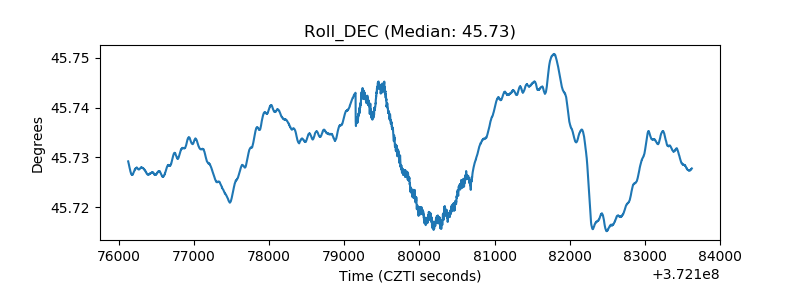 |
| _Roll_RA | 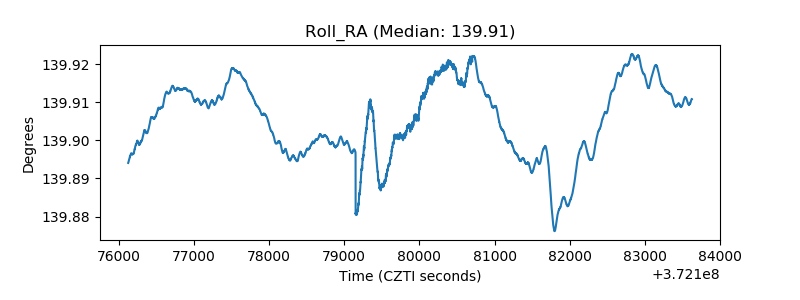 |
| Veto Counter | 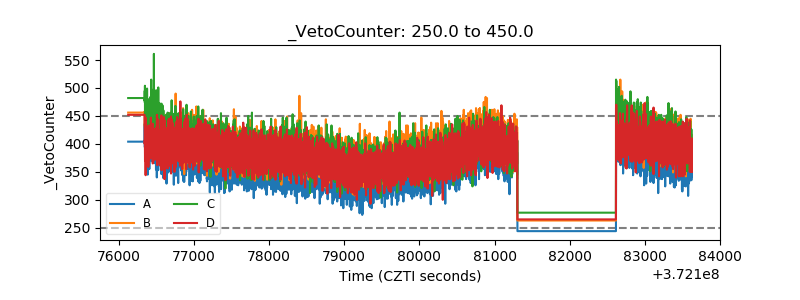 |