| Param | Original file | Final file |
|---|---|---|
| Filename | modeM0/AS1A10_123T04_9000004726_32736cztM0_level2.evt | modeM0/AS1A10_123T04_9000004726_32736cztM0_level2_quad_clean.evt |
| Size (bytes) | 326,113,920 | 47,105,280 |
| Size | 311.0 MB | 44.9 MB |
| Events in quadrant A | 1,857,518 | 291,092 |
| Events in quadrant B | 2,570,340 | 277,649 |
| Events in quadrant C | 1,921,325 | 290,181 |
| Events in quadrant D | 3,246,223 | 276,612 |
| Mode M0 | |||
|---|---|---|---|
| Quadrant | BADHDUFLAG | Total packets | Discarded packets |
| A | 0 | 8355 | 2 |
| B | 0 | 10255 | 1 |
| C | 0 | 8518 | 1 |
| D | 0 | 12574 | 1 |
| Mode M9 | |||
|---|---|---|---|
| Quadrant | BADHDUFLAG | Total packets | Discarded packets |
| A | 0 | 7 | 0 |
| B | 0 | 7 | 0 |
| C | 0 | 7 | 0 |
| D | 0 | 8 | 0 |
| Mode SS | |||
|---|---|---|---|
| Quadrant | BADHDUFLAG | Total packets | Discarded packets |
| A | 0 | 84 | 0 |
| B | 0 | 84 | 0 |
| C | 0 | 84 | 0 |
| D | 0 | 84 | 0 |
| Quadrant | Total seconds | Saturated seconds | Saturation percentage |
|---|---|---|---|
| A | 4114 | 5 | 0.121536% |
| B | 4114 | 199 | 4.837141% |
| C | 4114 | 19 | 0.461838% |
| D | 4114 | 144 | 3.500243% |
Noise dominated data is calculated using 1-second bins in cleaned event files. If a bin has >2000 counts, and if more than 50% of those come from <1% of pixels, then it is considered to be noise-dominated and hence unusable.
| Quadrant | # 1 sec bins | Bins with >0 counts | Bins with >2000 counts | High rate bins dominated by noise | Noise dominated (total time) | Noise dominated (detector-on time) | Marked lightcurve |
|---|---|---|---|---|---|---|---|
| A | 4114 | 4114 | 4 | 4 | 0.10% | 0.10% | 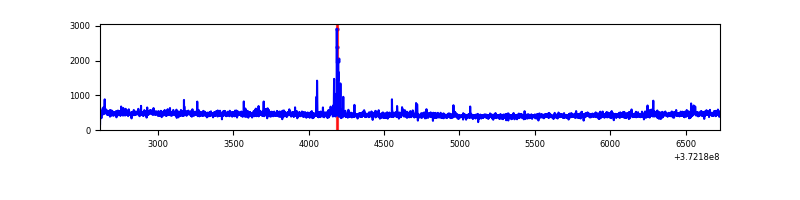 |
| B | 4114 | 4114 | 184 | 184 | 4.47% | 4.47% | 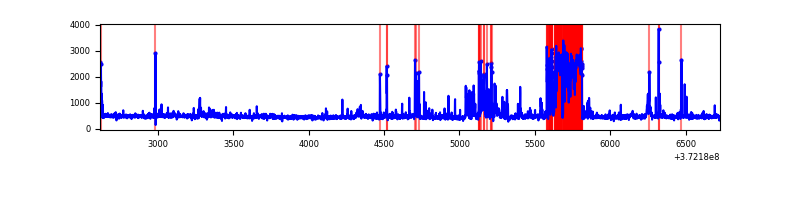 |
| C | 4114 | 4114 | 14 | 14 | 0.34% | 0.34% | 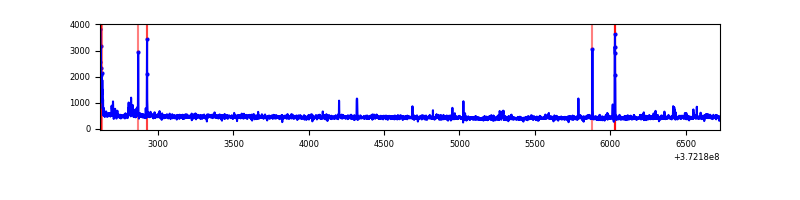 |
| D | 4114 | 4114 | 116 | 116 | 2.82% | 2.82% | 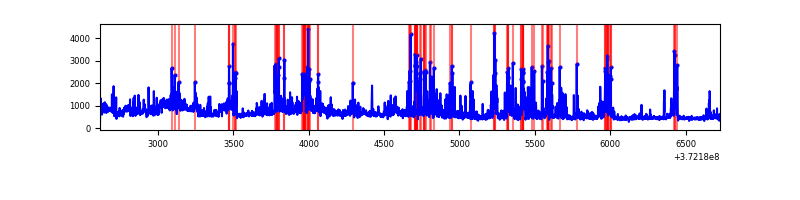 |
Top three noisy pixels from each quadrant. If the there are fewer than three noisy pixels in the level2.evt file, extra rows are filled as -1
| Pixel properties | Quadrant properties | ||||||
|---|---|---|---|---|---|---|---|
| Quadrant | DetID | PixID | Counts | Sigma | Mean | Median | Sigma |
| A | 15 | 237 | 35220 | 366.07 | 466 | 456 | 95.0 |
| A | 15 | 249 | 11397 | 115.21 | 466 | 456 | 95.0 |
| A | 13 | 254 | 7865 | 78.01 | 466 | 456 | 95.0 |
| B | 3 | 26 | 632954 | 7109.82 | 462 | 450 | 89.0 |
| B | 0 | 199 | 23235 | 256.12 | 462 | 450 | 89.0 |
| B | 0 | 219 | 23036 | 253.88 | 462 | 450 | 89.0 |
| C | 0 | 10 | 50071 | 460.45 | 455 | 460 | 107.7 |
| C | 9 | 54 | 26067 | 237.67 | 455 | 460 | 107.7 |
| C | 7 | 247 | 19096 | 172.97 | 455 | 460 | 107.7 |
| D | 2 | 250 | 372554 | 3438.52 | 448 | 437 | 108.2 |
| D | 8 | 195 | 324065 | 2990.46 | 448 | 437 | 108.2 |
| D | 7 | 80 | 191902 | 1769.22 | 448 | 437 | 108.2 |
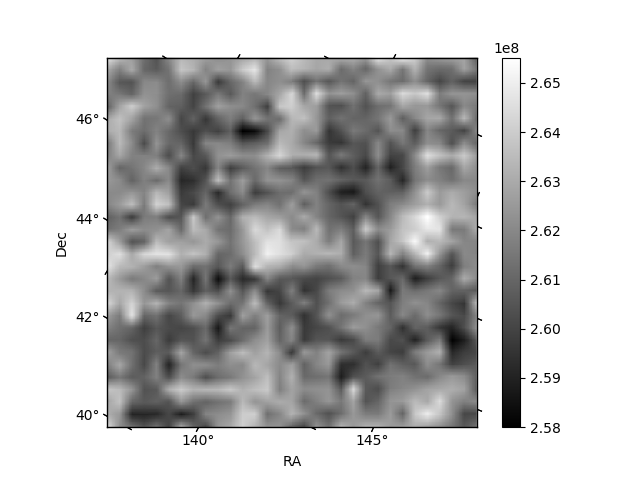
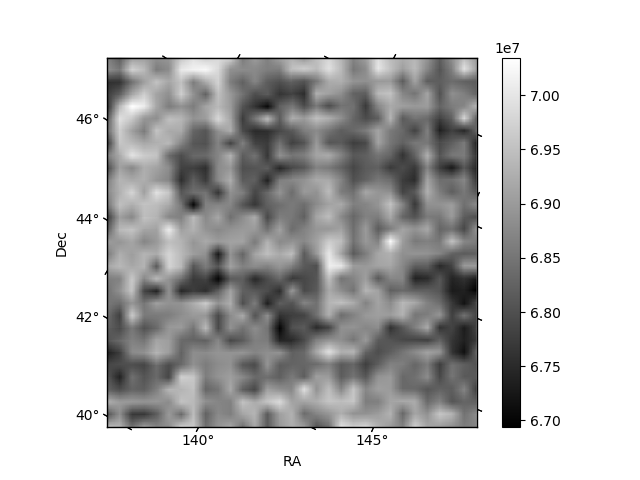
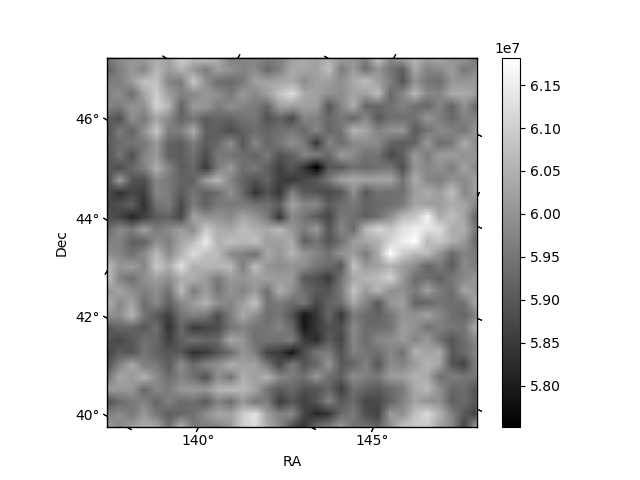
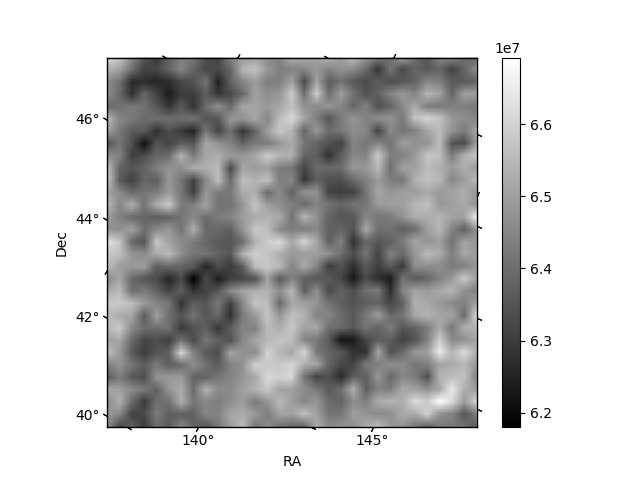
Histogram calculated using DETX and DETY for each event in the final _common_clean file
| Quadrant A | 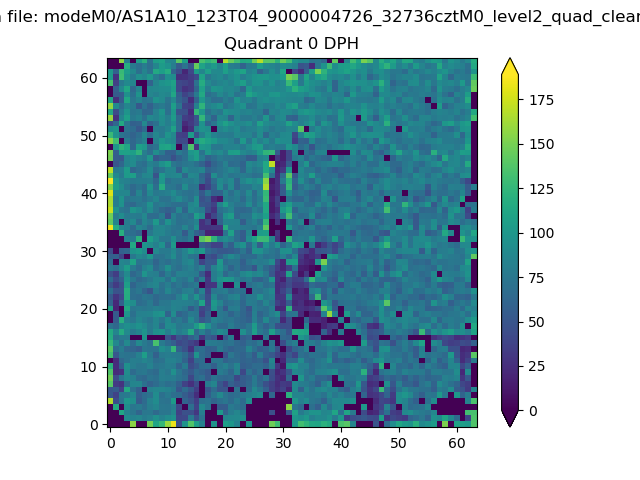 |
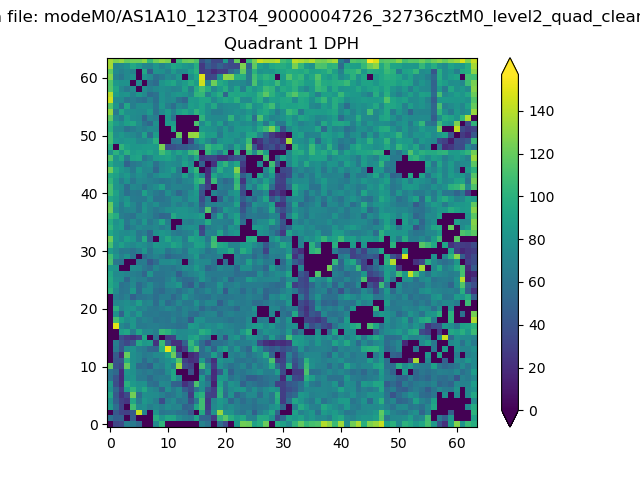 |
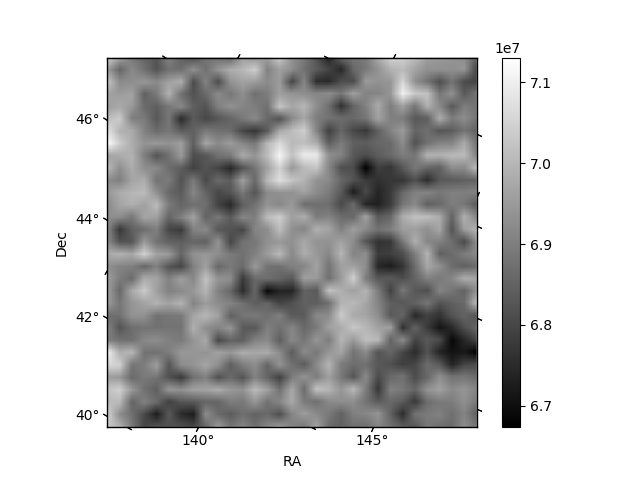
Quadrant B |
|---|---|---|---|
| Quadrant D | 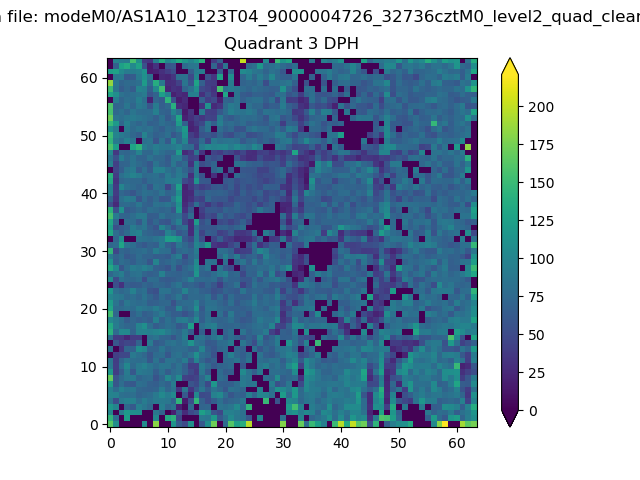 |
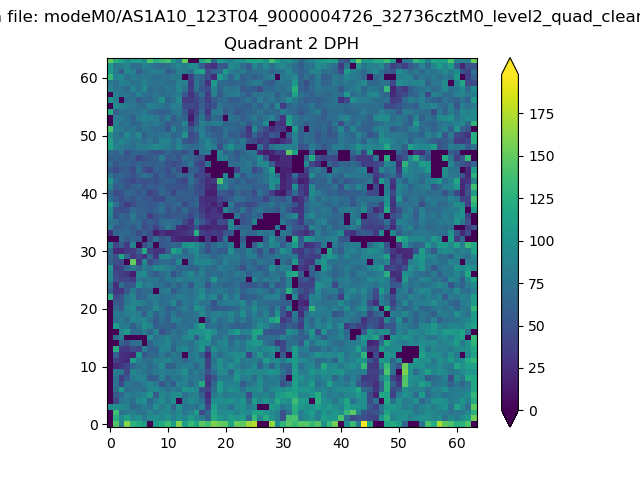 |
Quadrant C |
| Plot type | Count rate plots | Images |
|---|---|---|
| Comparison with Poisson distribution Blue bars denote a histogram of data divided into 1 sec bins. Red curve is a Poisson curve with rate = median count rate of data. |
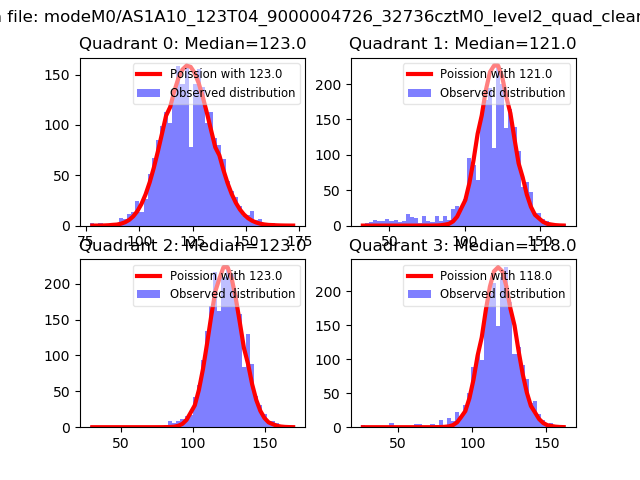 |
 |
| Quadrant-wise count rates Data is divided into 100 sec bins |
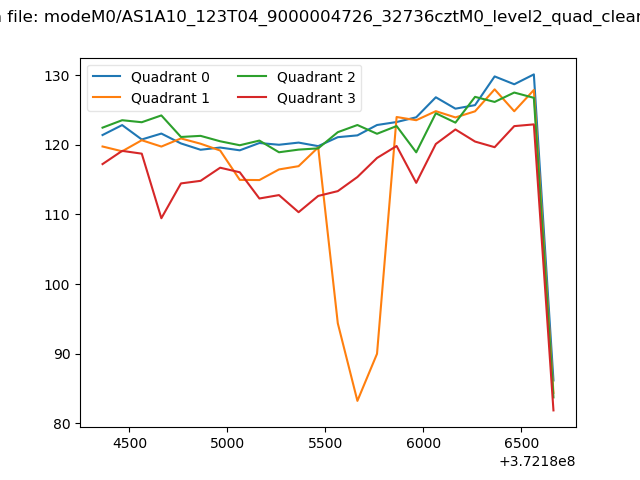 |
|
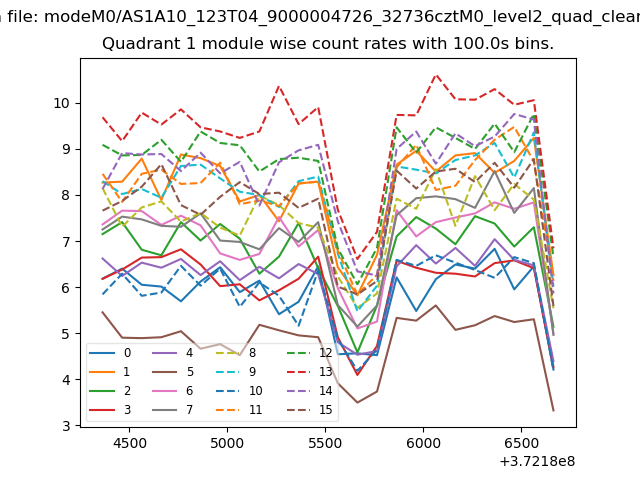
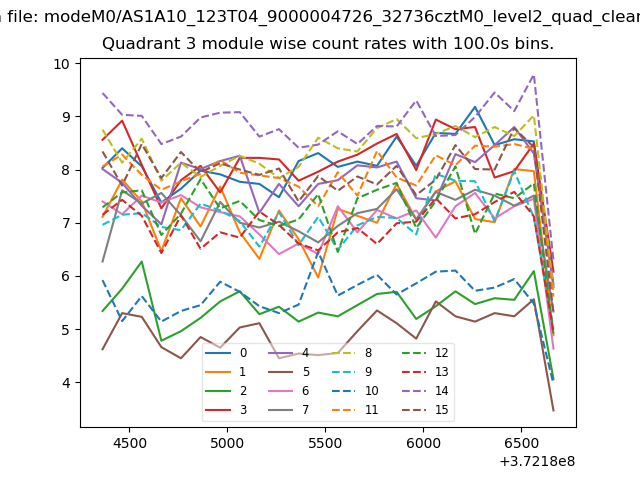
| Module-wise count rates for Quadrant A Data is divided into 100 sec bins |
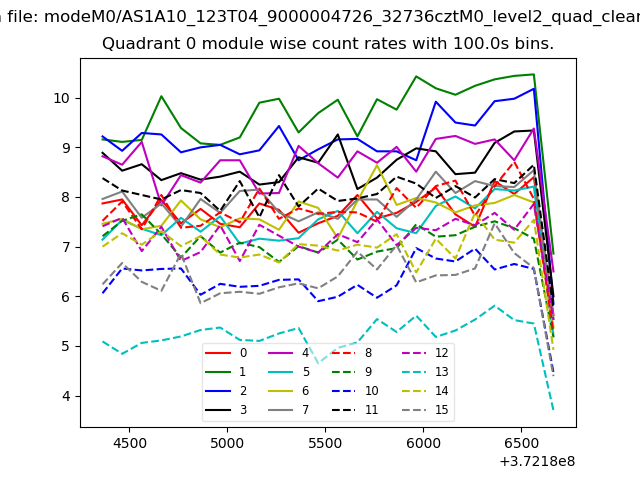 |
 |
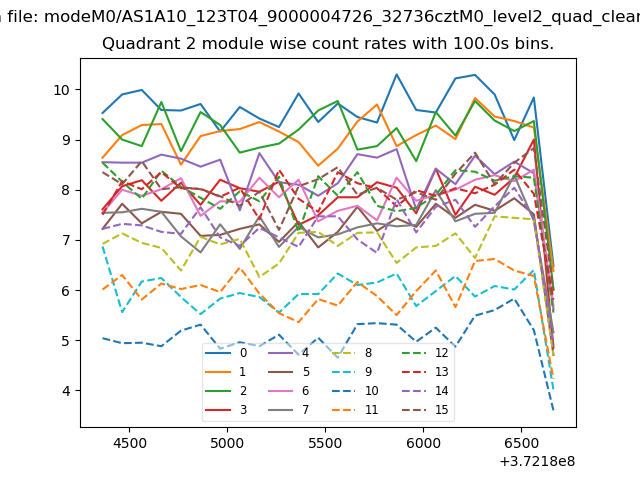
| Module-wise count rates for Quadrant B Data is divided into 100 sec bins |
 |
 |
| Module-wise count rates for Quadrant C Data is divided into 100 sec bins |
 |
 |
| Module-wise count rates for Quadrant D Data is divided into 100 sec bins |
 |
 |
| Parameter | Plot |
|---|---|
| CZT HV Monitor | 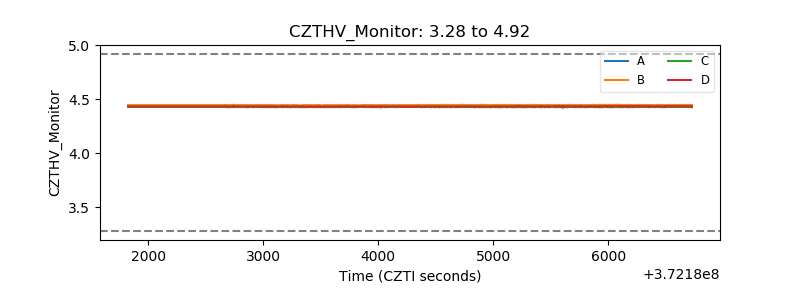 |
| D_VDD | 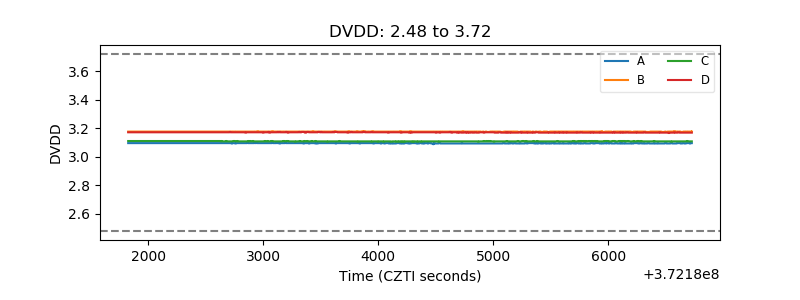 |
| Temperature 1 |  |
| Veto HV Monitor | 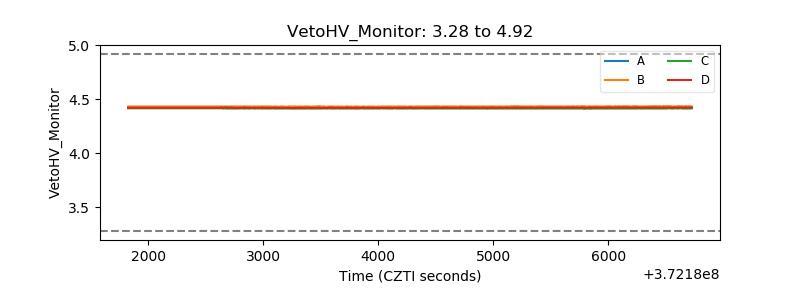 |
| Veto LLD | 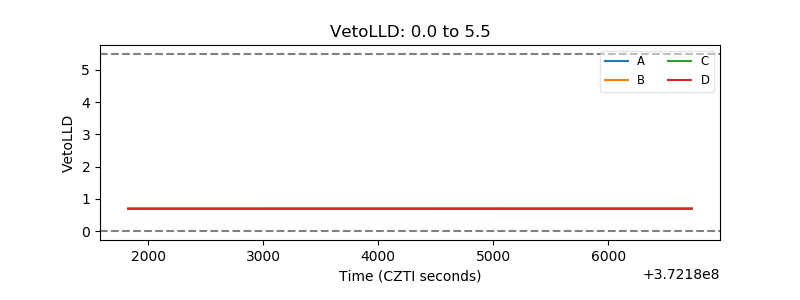 |
| Alpha Counter | 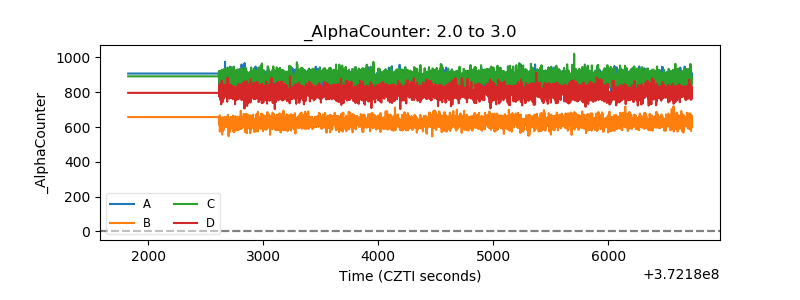 |
| _CPM_Rate |  |
| CZT Counter | 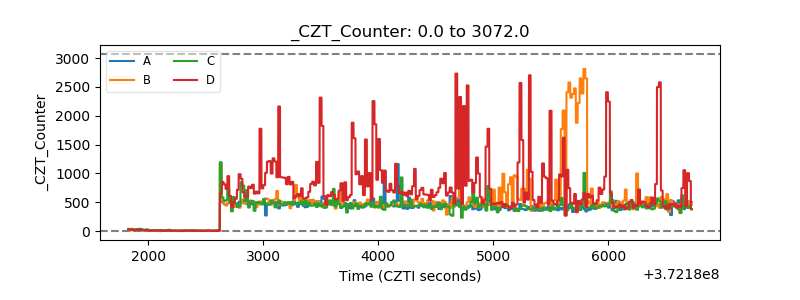 |
| +2.5 Volts monitor |  |
| +5 Volts monitor |  |
| _ROLL_ROT | 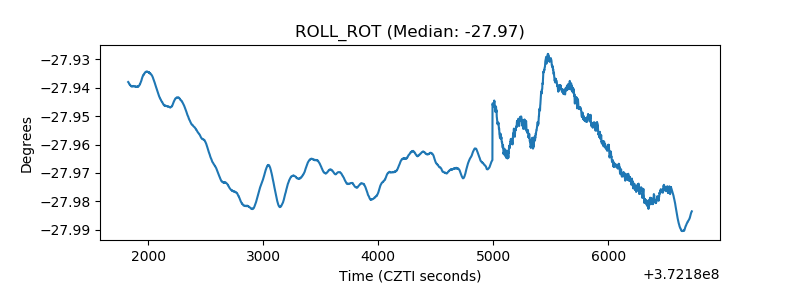 |
| _Roll_DEC | 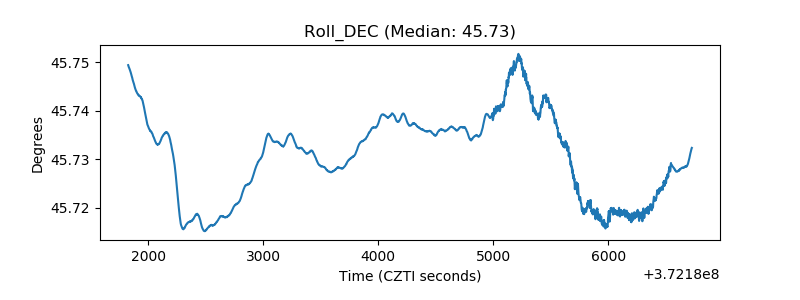 |
| _Roll_RA | 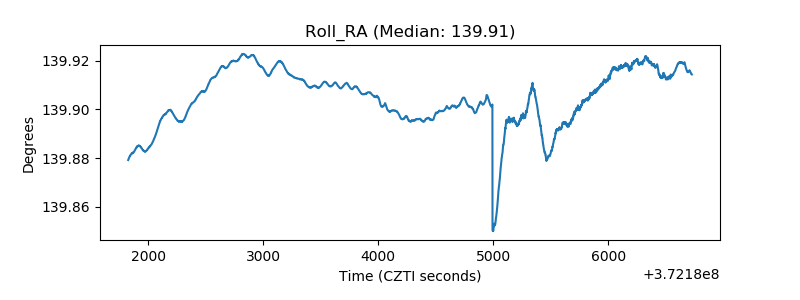 |
| Veto Counter | 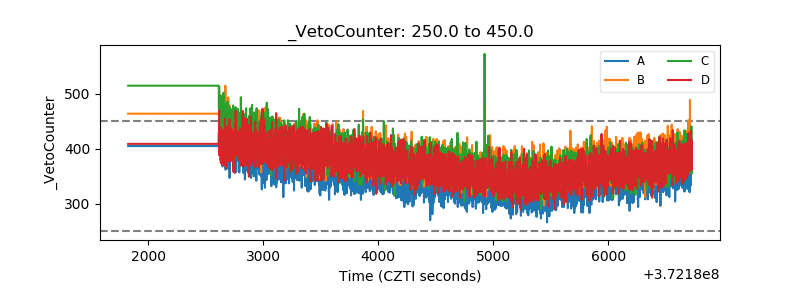 |