| Param | Original file | Final file |
|---|---|---|
| Filename | modeM0/AS1A10_123T04_9000004726_32737cztM0_level2.evt | modeM0/AS1A10_123T04_9000004726_32737cztM0_level2_quad_clean.evt |
| Size (bytes) | 783,083,520 | 146,064,960 |
| Size | 746.8 MB | 139.3 MB |
| Events in quadrant A | 4,933,132 | 947,140 |
| Events in quadrant B | 5,245,907 | 945,835 |
| Events in quadrant C | 4,570,516 | 957,681 |
| Events in quadrant D | 8,295,186 | 885,750 |
| Mode M0 | |||
|---|---|---|---|
| Quadrant | BADHDUFLAG | Total packets | Discarded packets |
| A | 0 | 23160 | 1807 |
| B | 0 | 24075 | 2155 |
| C | 0 | 22250 | 1818 |
| D | 0 | 35215 | 3623 |
| Mode M9 | |||
|---|---|---|---|
| Quadrant | BADHDUFLAG | Total packets | Discarded packets |
| A | 0 | 28 | 0 |
| B | 0 | 28 | 0 |
| C | 0 | 28 | 0 |
| D | 0 | 28 | 0 |
| Mode SS | |||
|---|---|---|---|
| Quadrant | BADHDUFLAG | Total packets | Discarded packets |
| A | 0 | 220 | 18 |
| B | 0 | 219 | 17 |
| C | 0 | 220 | 16 |
| D | 0 | 220 | 18 |
| Quadrant | Total seconds | Saturated seconds | Saturation percentage |
|---|---|---|---|
| A | 9929 | 154 | 1.551012% |
| B | 9911 | 97 | 0.978711% |
| C | 9943 | 50 | 0.502866% |
| D | 9870 | 589 | 5.967579% |
Noise dominated data is calculated using 1-second bins in cleaned event files. If a bin has >2000 counts, and if more than 50% of those come from <1% of pixels, then it is considered to be noise-dominated and hence unusable.
| Quadrant | # 1 sec bins | Bins with >0 counts | Bins with >2000 counts | High rate bins dominated by noise | Noise dominated (total time) | Noise dominated (detector-on time) | Marked lightcurve |
|---|---|---|---|---|---|---|---|
| A | 13386 | 10053 | 73 | 73 | 0.55% | 0.73% | 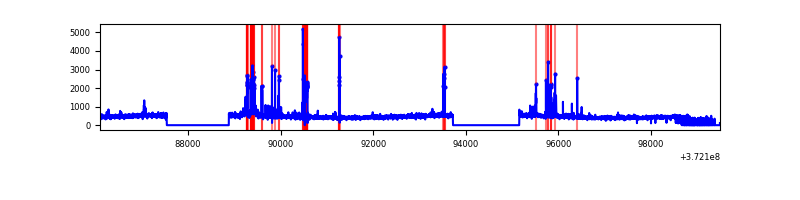 |
| B | 13336 | 10021 | 69 | 69 | 0.52% | 0.69% | 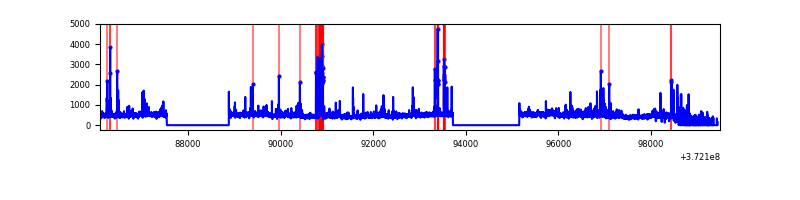 |
| C | 13340 | 10065 | 30 | 30 | 0.22% | 0.30% |  |
| D | 13223 | 9974 | 479 | 479 | 3.62% | 4.80% | 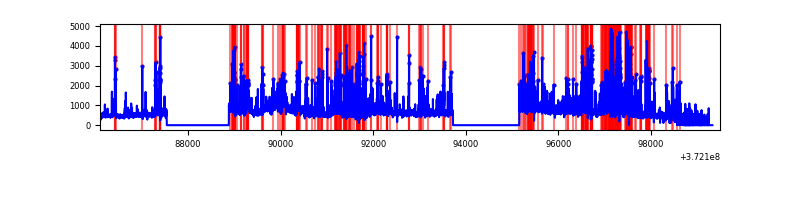 |
Top three noisy pixels from each quadrant. If the there are fewer than three noisy pixels in the level2.evt file, extra rows are filled as -1
| Pixel properties | Quadrant properties | ||||||
|---|---|---|---|---|---|---|---|
| Quadrant | DetID | PixID | Counts | Sigma | Mean | Median | Sigma |
| A | 15 | 237 | 287973 | 1263.0 | 1134 | 1111 | 227.1 |
| A | 15 | 249 | 247085 | 1082.97 | 1134 | 1111 | 227.1 |
| A | 13 | 254 | 20231 | 84.18 | 1134 | 1111 | 227.1 |
| B | 3 | 26 | 288511 | 1323.97 | 1140 | 1113 | 217.1 |
| B | 0 | 219 | 189682 | 868.69 | 1140 | 1113 | 217.1 |
| B | 0 | 199 | 82165 | 373.39 | 1140 | 1113 | 217.1 |
| C | 9 | 54 | 73912 | 282.14 | 1109 | 1121 | 258.0 |
| C | 0 | 10 | 43482 | 164.19 | 1109 | 1121 | 258.0 |
| C | 8 | 79 | 41162 | 155.2 | 1109 | 1121 | 258.0 |
| D | 7 | 80 | 994943 | 3862.64 | 1073 | 1048 | 257.3 |
| D | 8 | 195 | 991759 | 3850.27 | 1073 | 1048 | 257.3 |
| D | 2 | 250 | 840751 | 3263.39 | 1073 | 1048 | 257.3 |
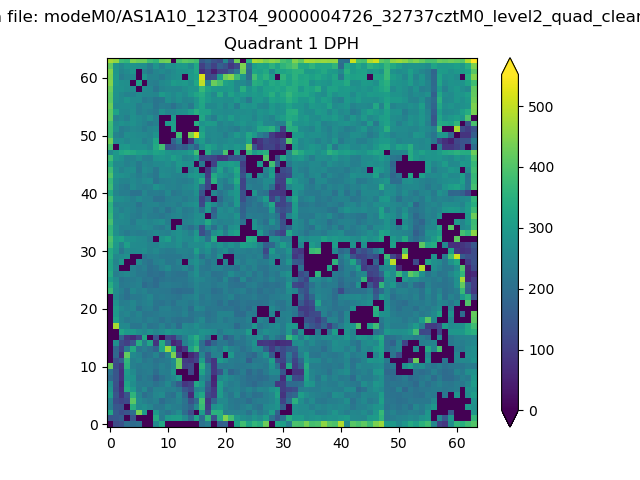
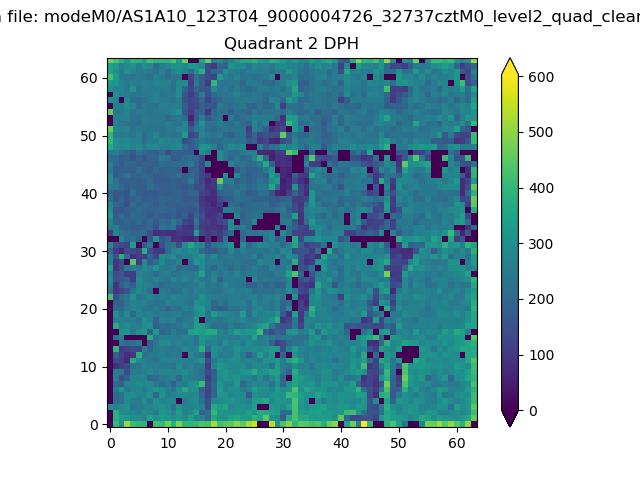
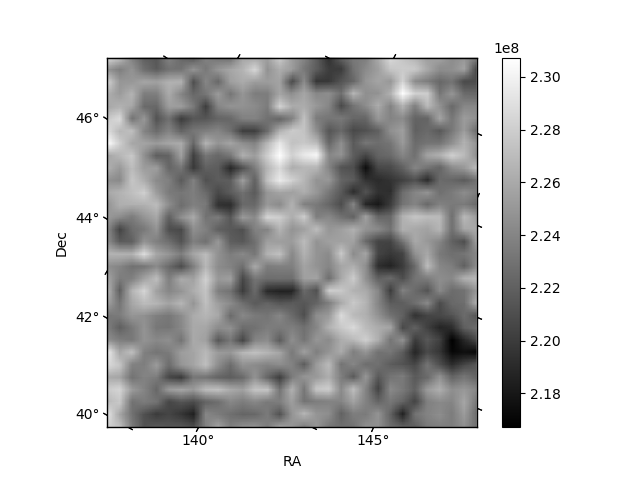
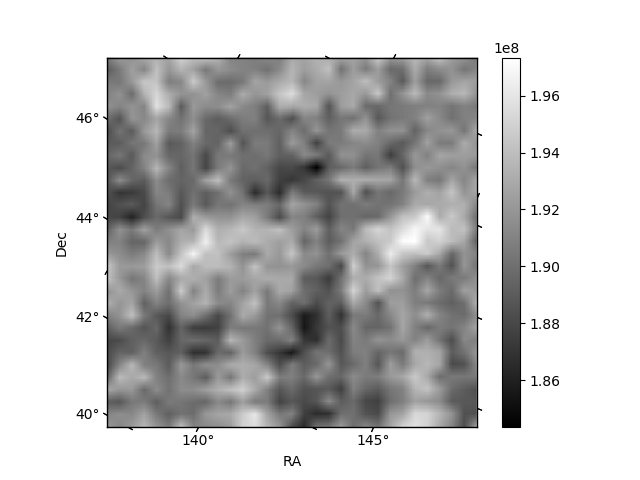
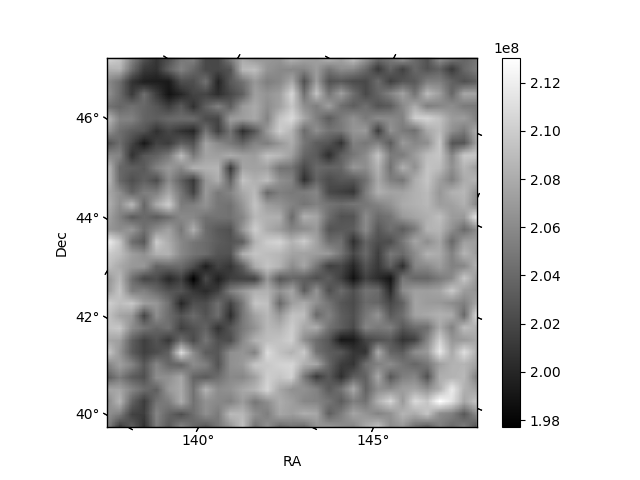
Histogram calculated using DETX and DETY for each event in the final _common_clean file
| Quadrant A |  |
 |
Quadrant B |
|---|---|---|---|
| Quadrant D | 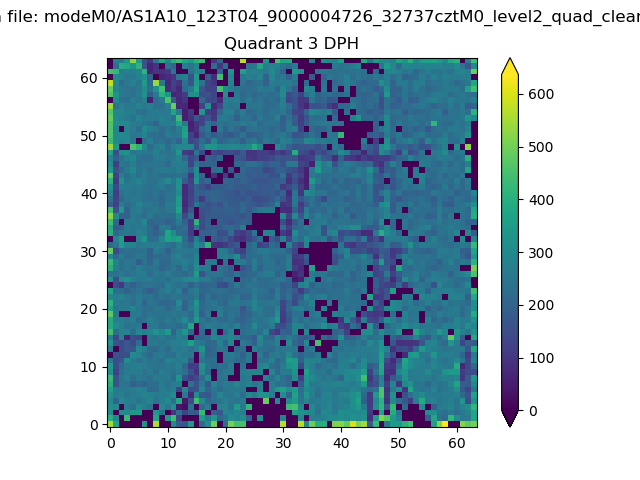 |
 |
Quadrant C |
| Plot type | Count rate plots | Images |
|---|---|---|
| Comparison with Poisson distribution Blue bars denote a histogram of data divided into 1 sec bins. Red curve is a Poisson curve with rate = median count rate of data. |
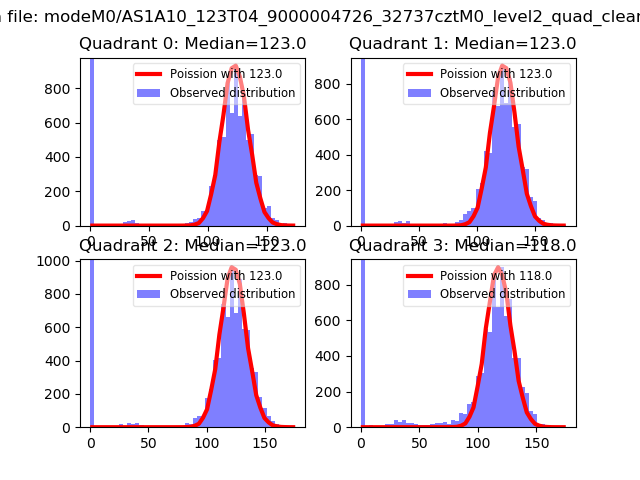 |
 |
| Quadrant-wise count rates Data is divided into 100 sec bins |
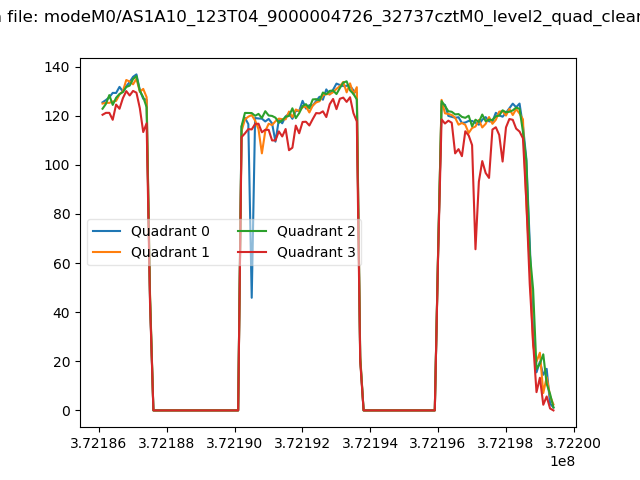 |
|
| Module-wise count rates for Quadrant A Data is divided into 100 sec bins |
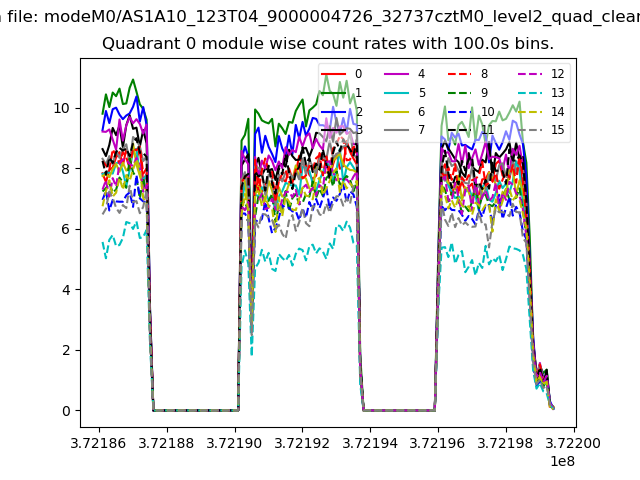 |
 |
| Module-wise count rates for Quadrant B Data is divided into 100 sec bins |
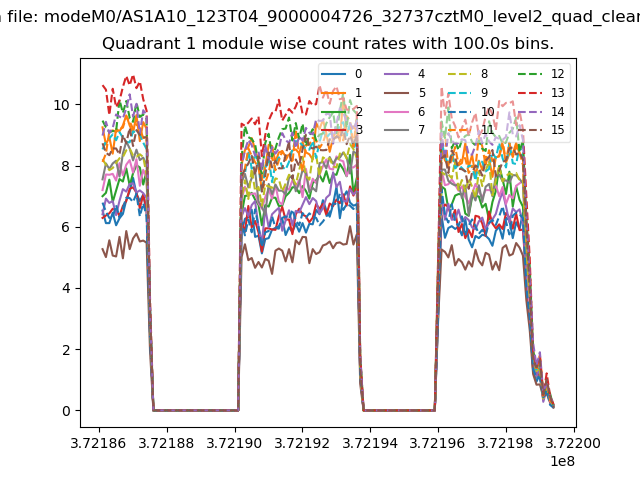 |
 |
| Module-wise count rates for Quadrant C Data is divided into 100 sec bins |
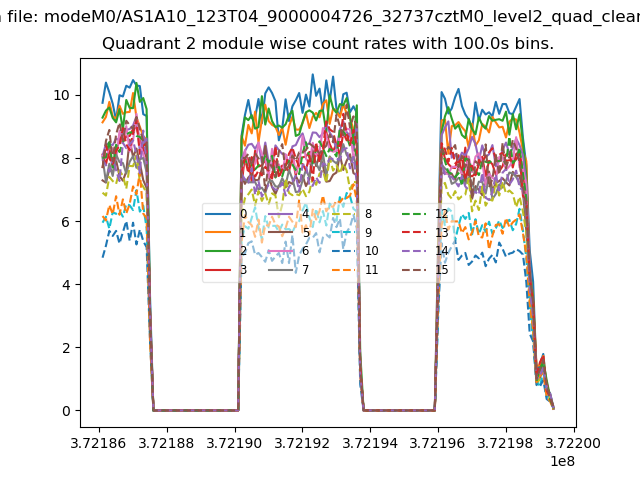 |
 |
| Module-wise count rates for Quadrant D Data is divided into 100 sec bins |
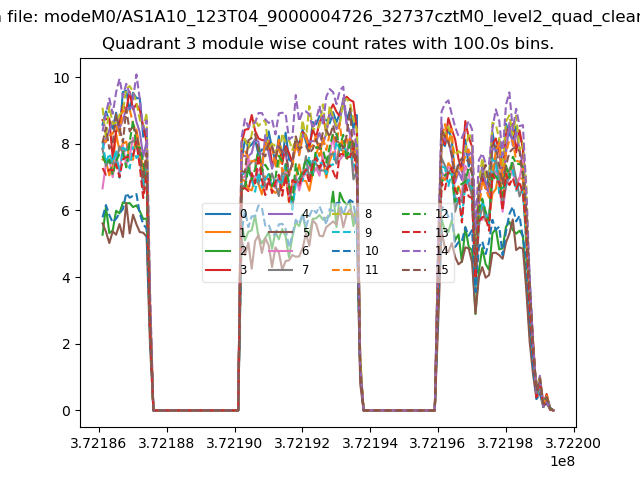 |
 |
| Parameter | Plot |
|---|---|
| CZT HV Monitor | 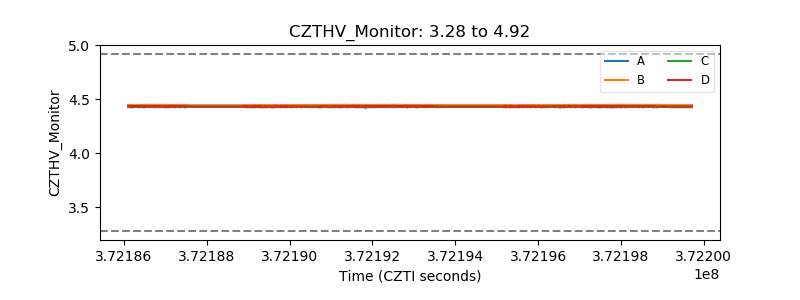 |
| D_VDD | 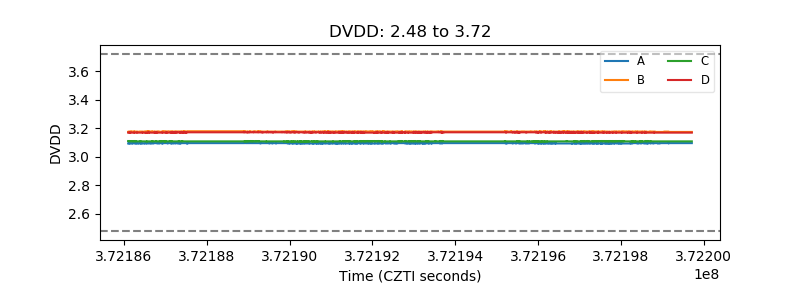 |
| Temperature 1 | 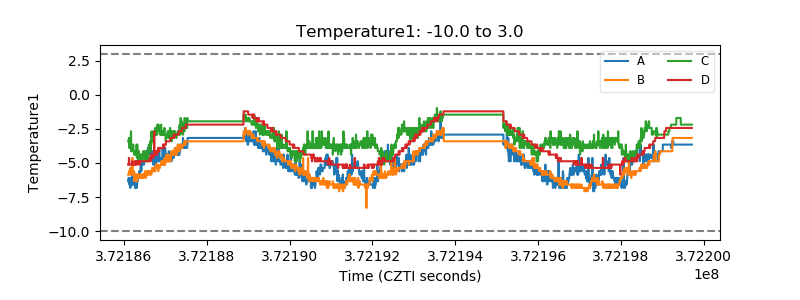 |
| Veto HV Monitor |  |
| Veto LLD | 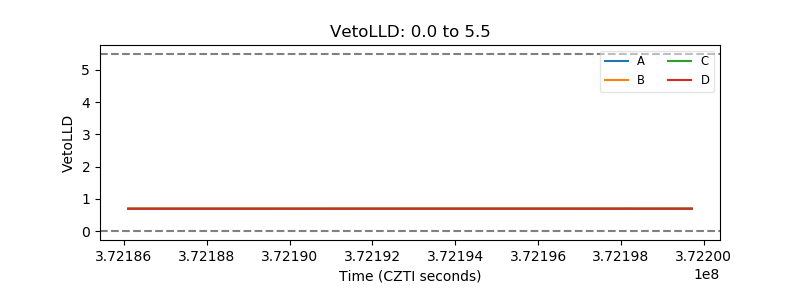 |
| Alpha Counter | 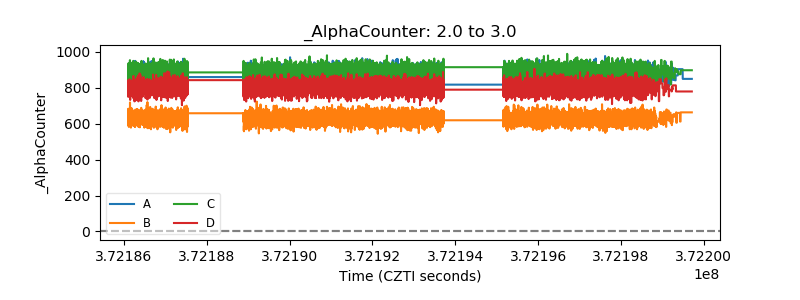 |
| _CPM_Rate | 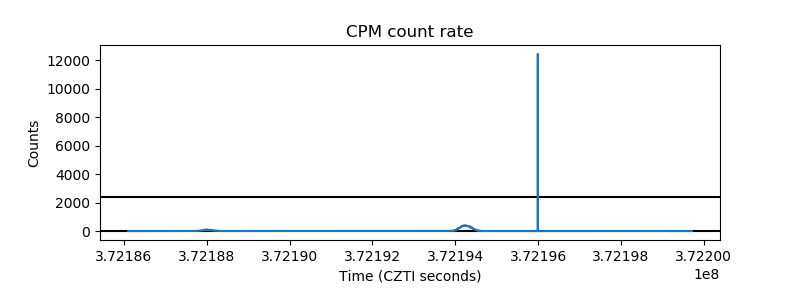 |
| CZT Counter | 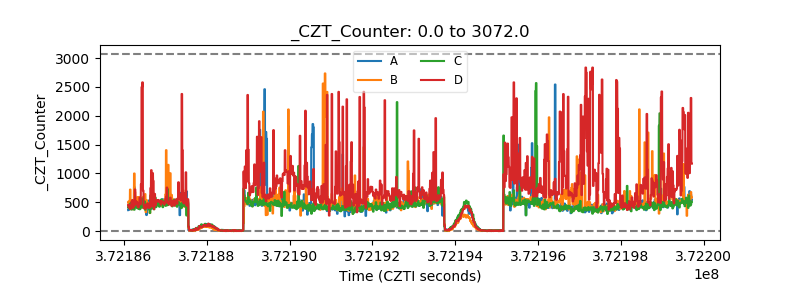 |
| +2.5 Volts monitor | 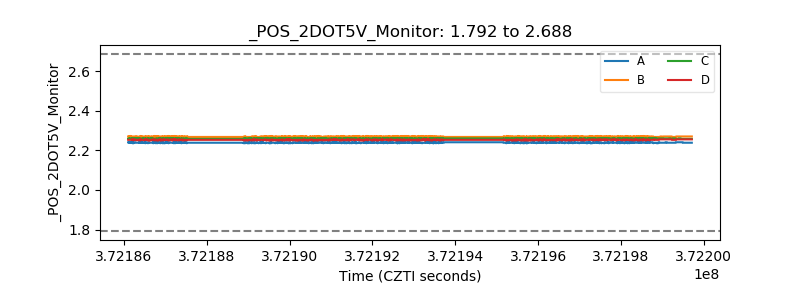 |
| +5 Volts monitor |  |
| _ROLL_ROT | 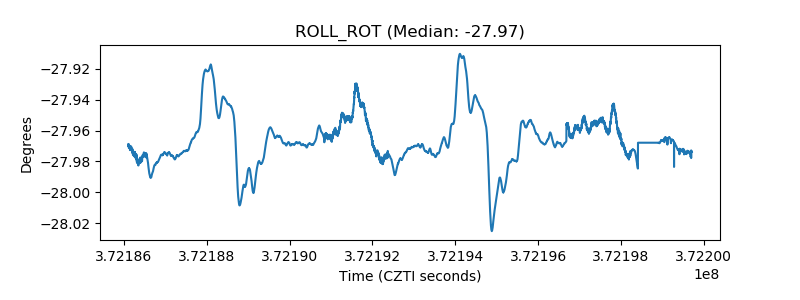 |
| _Roll_DEC | 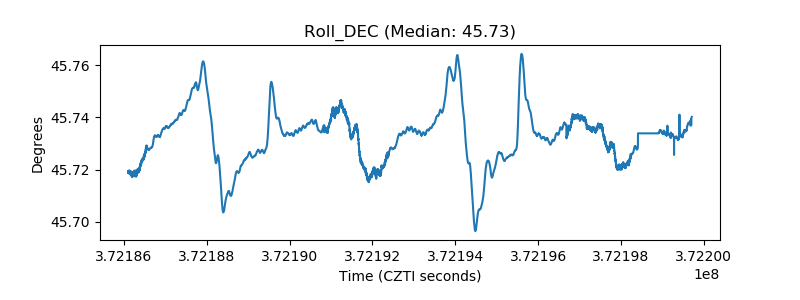 |
| _Roll_RA | 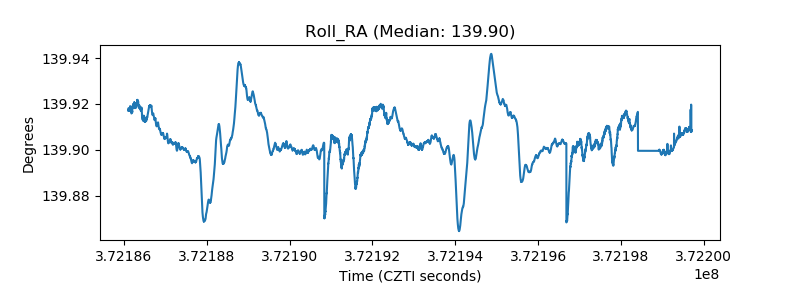 |
| Veto Counter | 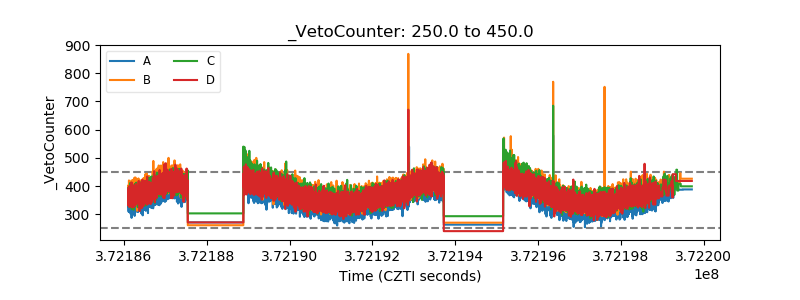 |