| Param | Original file | Final file |
|---|---|---|
| Filename | modeM0/AS1A10_123T04_9000004726_32742cztM0_level2.evt | modeM0/AS1A10_123T04_9000004726_32742cztM0_level2_quad_clean.evt |
| Size (bytes) | 818,280,000 | 156,456,000 |
| Size | 780.4 MB | 149.2 MB |
| Events in quadrant A | 5,161,784 | 1,020,244 |
| Events in quadrant B | 5,058,393 | 1,046,722 |
| Events in quadrant C | 4,467,397 | 1,055,594 |
| Events in quadrant D | 9,458,585 | 963,874 |
| Mode M0 | |||
|---|---|---|---|
| Quadrant | BADHDUFLAG | Total packets | Discarded packets |
| A | 0 | 21736 | 1 |
| B | 0 | 21131 | 1 |
| C | 0 | 19785 | 1 |
| D | 0 | 34694 | 1 |
| Mode M9 | |||
|---|---|---|---|
| Quadrant | BADHDUFLAG | Total packets | Discarded packets |
| A | 0 | 33 | 0 |
| B | 0 | 33 | 0 |
| C | 0 | 33 | 0 |
| D | 0 | 33 | 0 |
| Mode SS | |||
|---|---|---|---|
| Quadrant | BADHDUFLAG | Total packets | Discarded packets |
| A | 0 | 192 | 0 |
| B | 0 | 192 | 0 |
| C | 0 | 192 | 0 |
| D | 0 | 192 | 0 |
| Quadrant | Total seconds | Saturated seconds | Saturation percentage |
|---|---|---|---|
| A | 9403 | 343 | 3.647772% |
| B | 9403 | 63 | 0.669999% |
| C | 9403 | 96 | 1.020951% |
| D | 9403 | 1004 | 10.677443% |
Noise dominated data is calculated using 1-second bins in cleaned event files. If a bin has >2000 counts, and if more than 50% of those come from <1% of pixels, then it is considered to be noise-dominated and hence unusable.
| Quadrant | # 1 sec bins | Bins with >0 counts | Bins with >2000 counts | High rate bins dominated by noise | Noise dominated (total time) | Noise dominated (detector-on time) | Marked lightcurve |
|---|---|---|---|---|---|---|---|
| A | 12629 | 9405 | 295 | 295 | 2.34% | 3.14% | 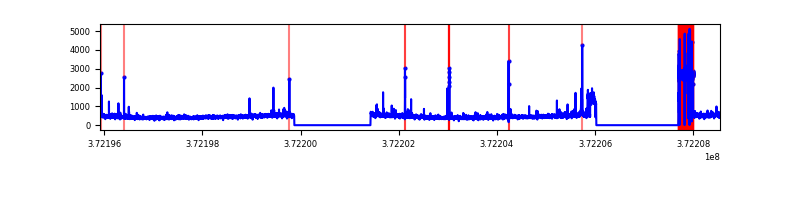 |
| B | 12629 | 9405 | 22 | 22 | 0.17% | 0.23% | 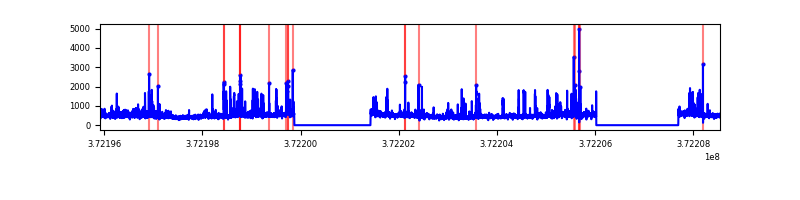 |
| C | 12629 | 9404 | 68 | 68 | 0.54% | 0.72% | 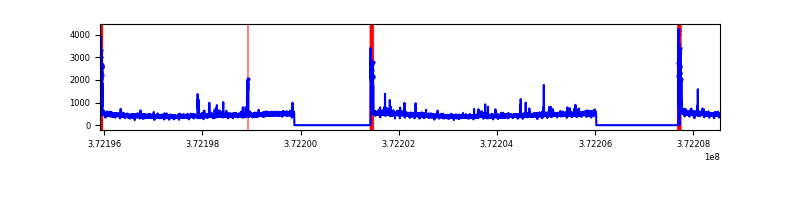 |
| D | 12629 | 9405 | 816 | 816 | 6.46% | 8.68% | 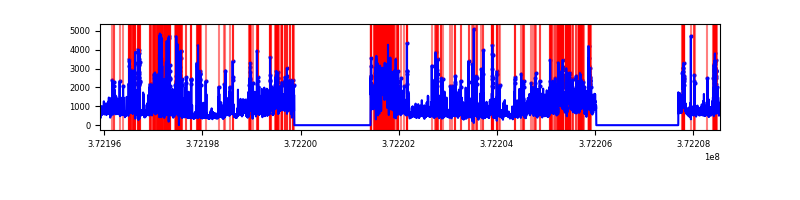 |
Top three noisy pixels from each quadrant. If the there are fewer than three noisy pixels in the level2.evt file, extra rows are filled as -1
| Pixel properties | Quadrant properties | ||||||
|---|---|---|---|---|---|---|---|
| Quadrant | DetID | PixID | Counts | Sigma | Mean | Median | Sigma |
| A | 15 | 249 | 973527 | 4594.13 | 1049 | 1029 | 211.7 |
| A | 15 | 237 | 88493 | 413.18 | 1049 | 1029 | 211.7 |
| A | 0 | 254 | 38460 | 176.83 | 1049 | 1029 | 211.7 |
| B | 3 | 26 | 276704 | 1341.31 | 1085 | 1062 | 205.5 |
| B | 0 | 219 | 180947 | 875.34 | 1085 | 1062 | 205.5 |
| B | 4 | 251 | 90108 | 433.31 | 1085 | 1062 | 205.5 |
| C | 0 | 10 | 165116 | 675.86 | 1046 | 1055 | 242.7 |
| C | 9 | 54 | 73694 | 299.24 | 1046 | 1055 | 242.7 |
| C | 8 | 79 | 41448 | 166.4 | 1046 | 1055 | 242.7 |
| D | 7 | 80 | 1677332 | 7010.06 | 1001 | 978 | 239.1 |
| D | 8 | 195 | 1507582 | 6300.21 | 1001 | 978 | 239.1 |
| D | 2 | 250 | 741426 | 3096.35 | 1001 | 978 | 239.1 |
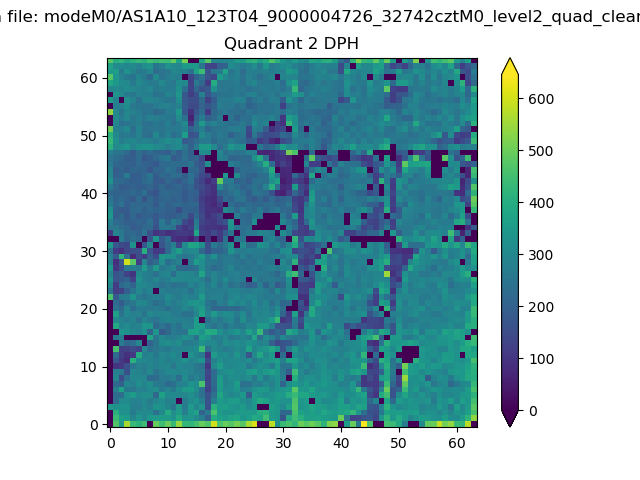
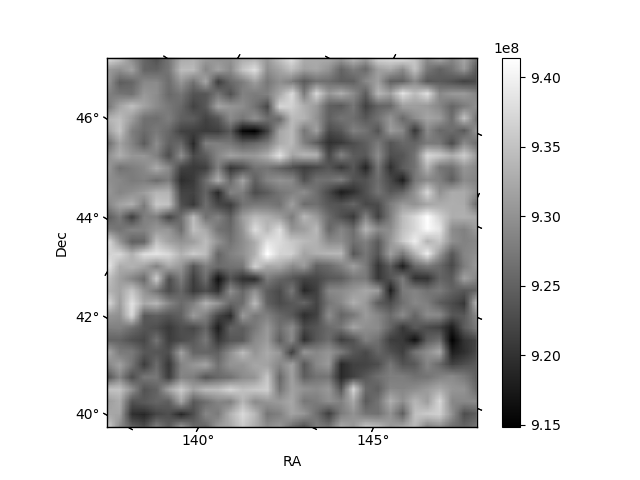
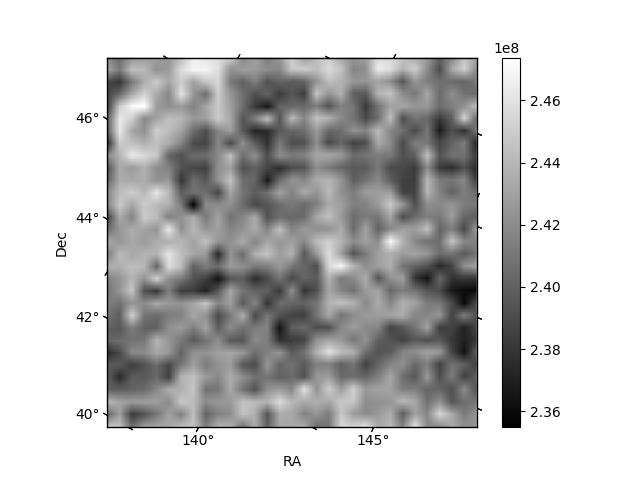
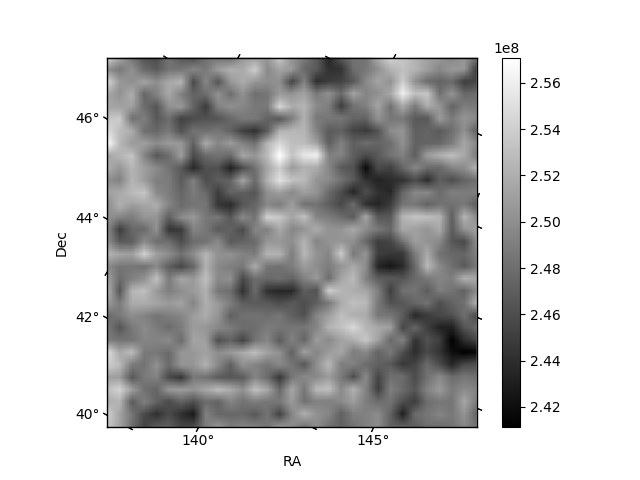
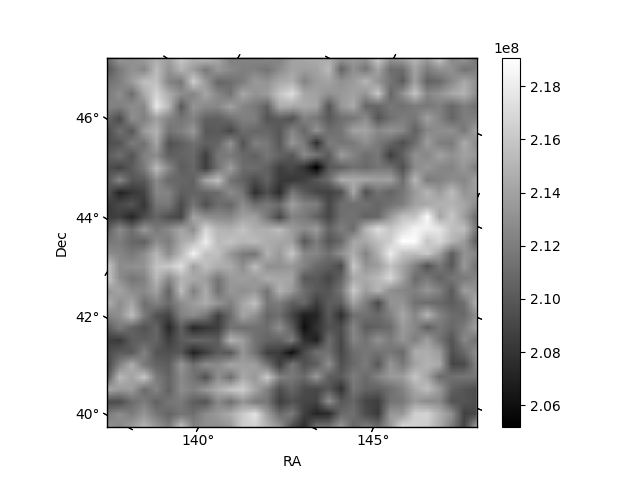
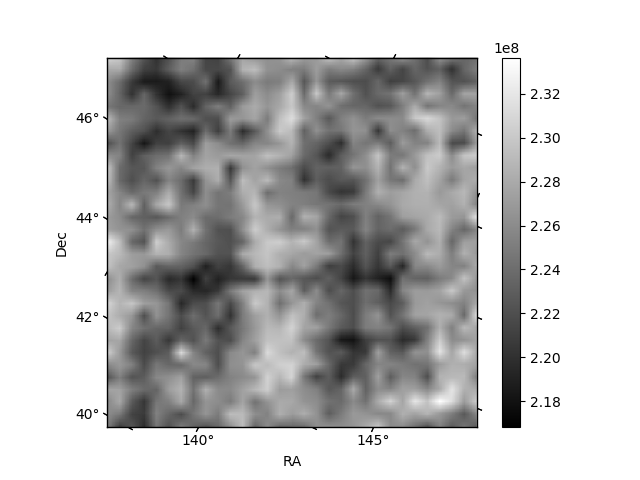
Histogram calculated using DETX and DETY for each event in the final _common_clean file
| Quadrant A | 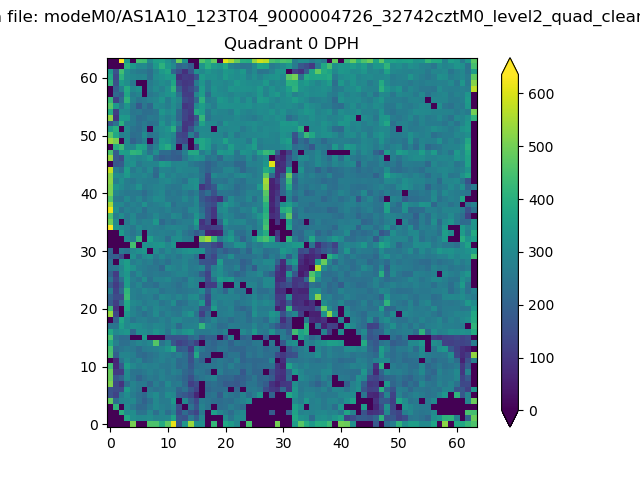 |
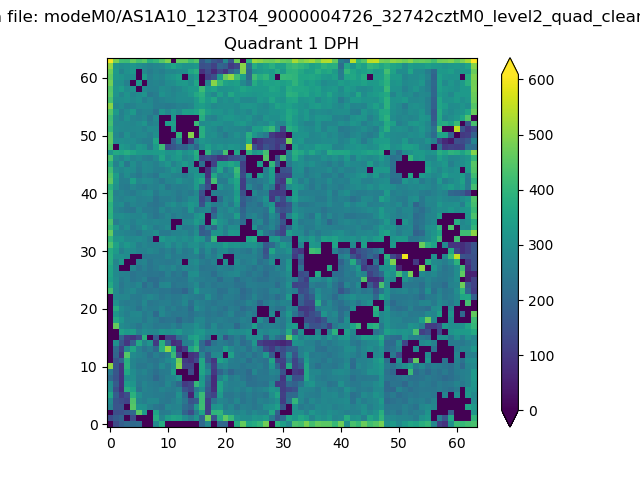 |
Quadrant B |
|---|---|---|---|
| Quadrant D | 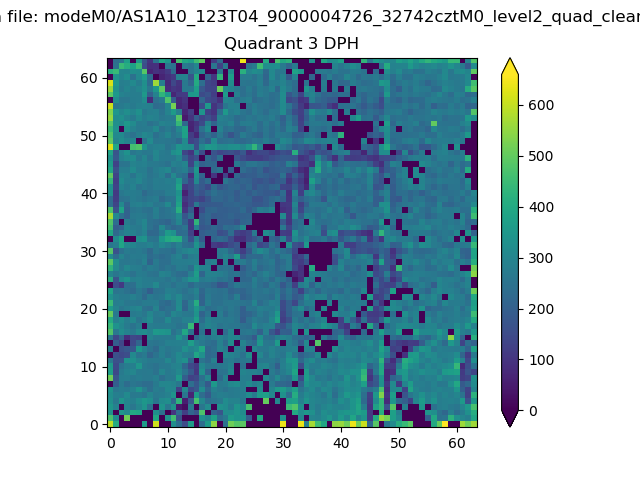 |
 |
Quadrant C |
| Plot type | Count rate plots | Images |
|---|---|---|
| Comparison with Poisson distribution Blue bars denote a histogram of data divided into 1 sec bins. Red curve is a Poisson curve with rate = median count rate of data. |
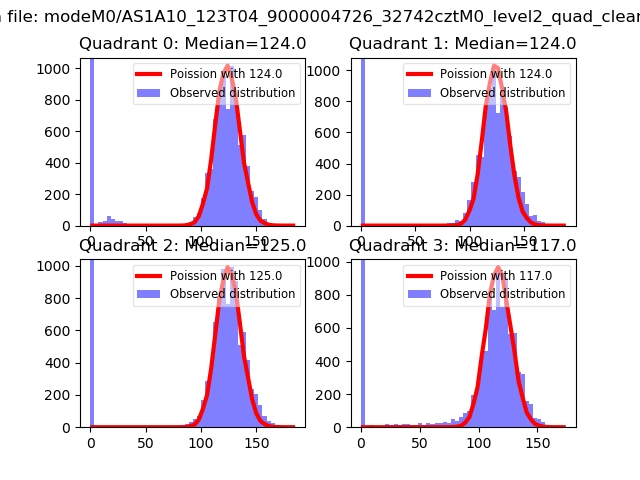 |
 |
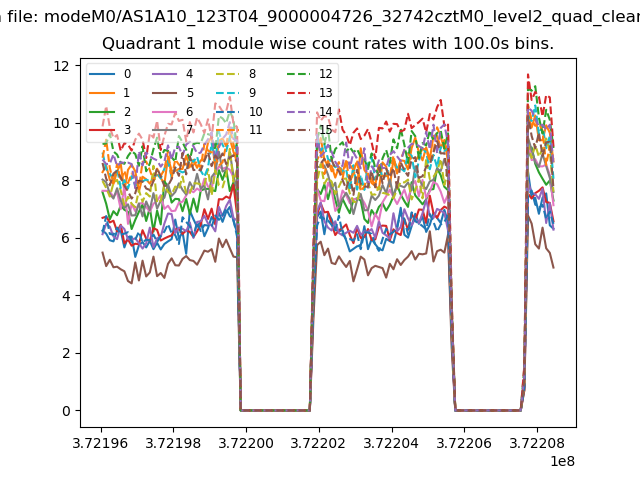
| Quadrant-wise count rates Data is divided into 100 sec bins |
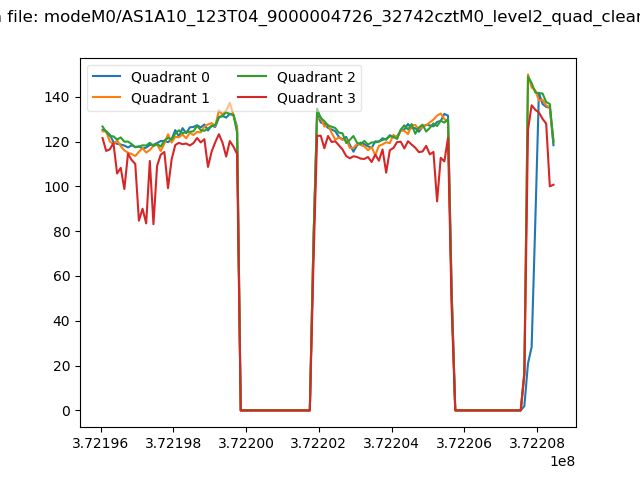 |
|
| Module-wise count rates for Quadrant A Data is divided into 100 sec bins |
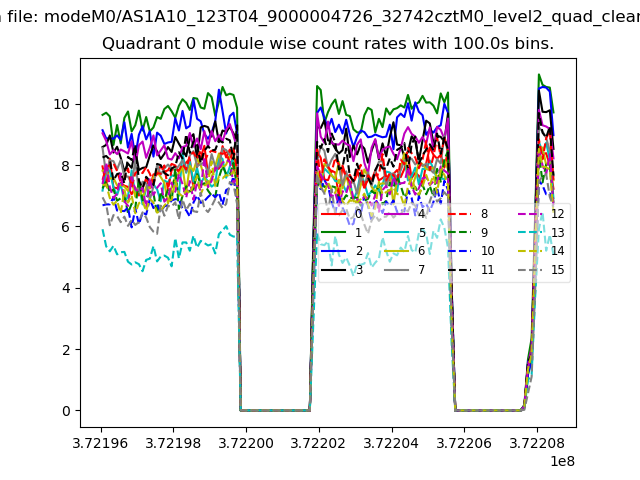 |
 |
| Module-wise count rates for Quadrant B Data is divided into 100 sec bins |
 |
 |
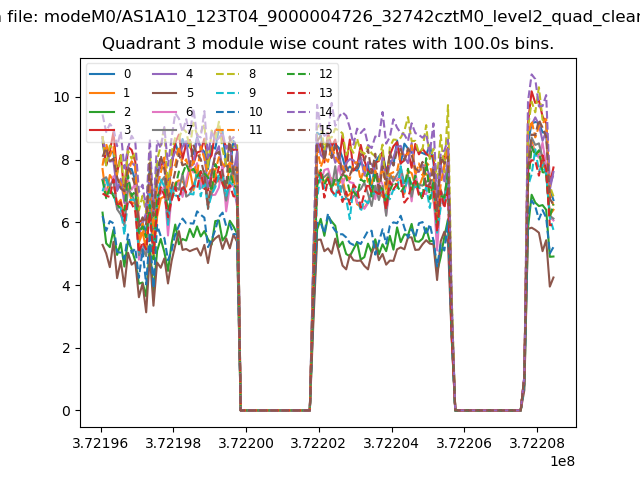
| Module-wise count rates for Quadrant C Data is divided into 100 sec bins |
 |
 |
| Module-wise count rates for Quadrant D Data is divided into 100 sec bins |
 |
 |
| Parameter | Plot |
|---|---|
| CZT HV Monitor | 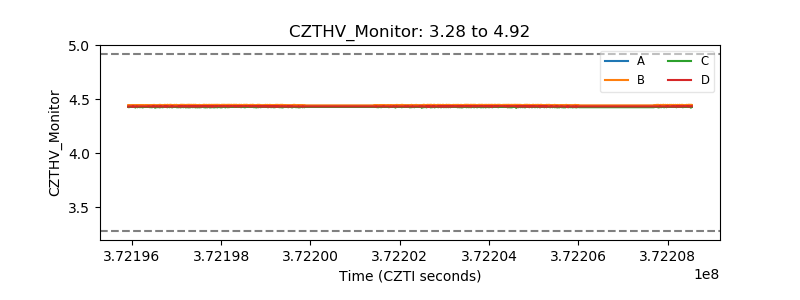 |
| D_VDD | 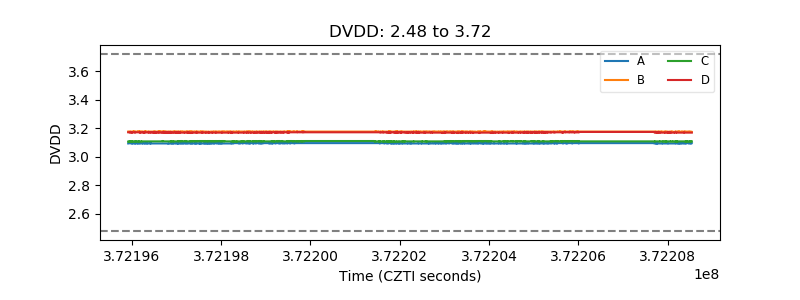 |
| Temperature 1 | 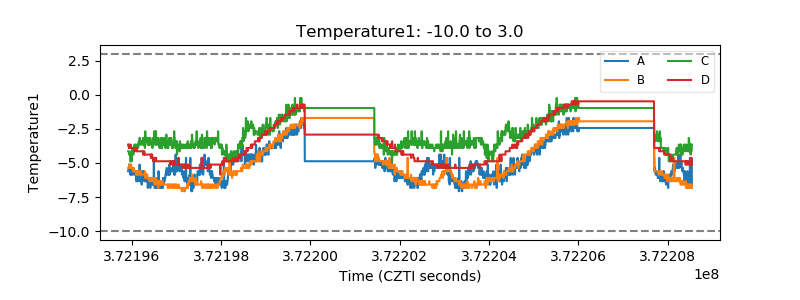 |
| Veto HV Monitor | 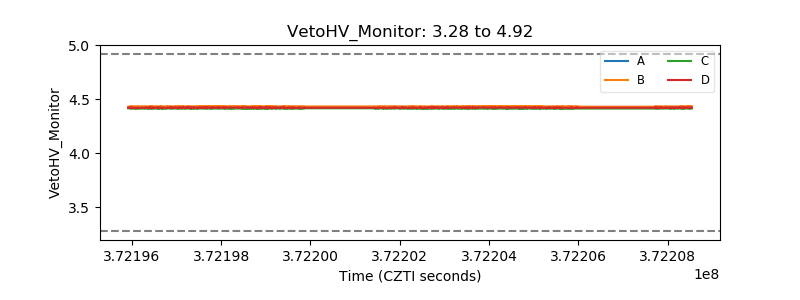 |
| Veto LLD | 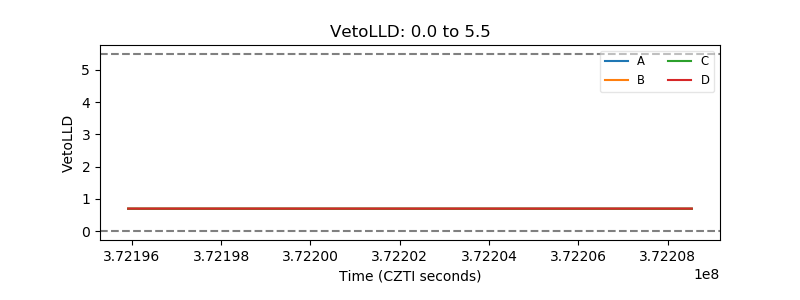 |
| Alpha Counter | 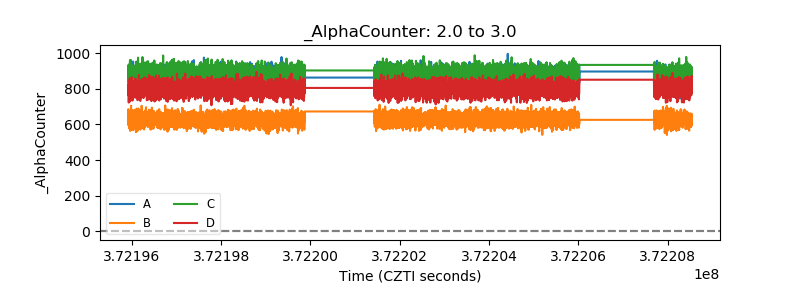 |
| _CPM_Rate | 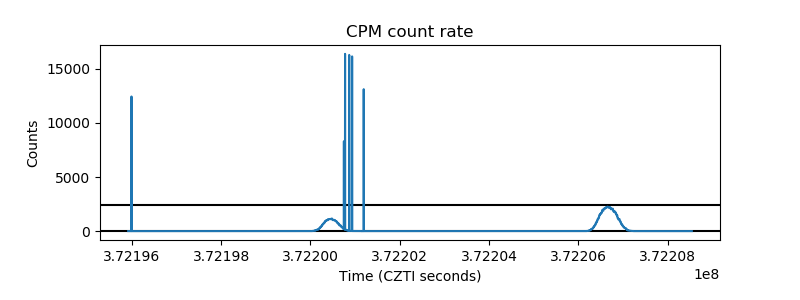 |
| CZT Counter | 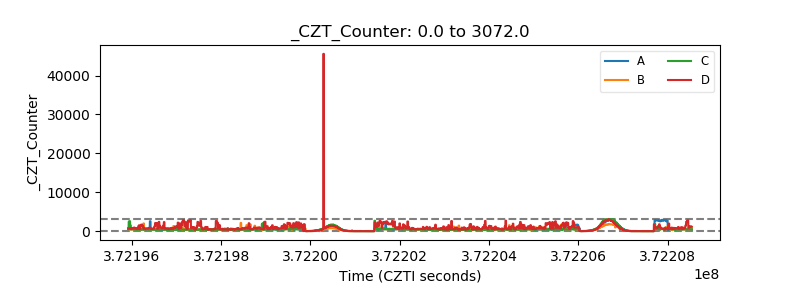 |
| +2.5 Volts monitor |  |
| +5 Volts monitor |  |
| _ROLL_ROT | 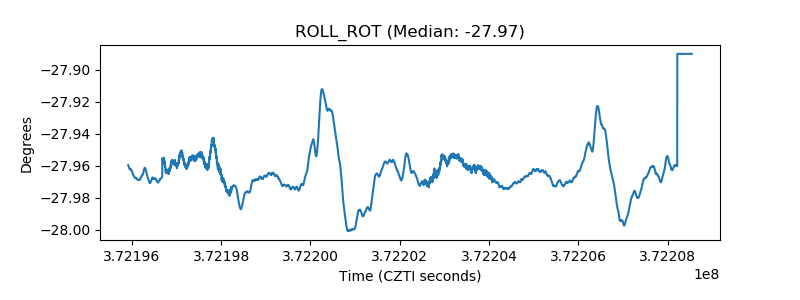 |
| _Roll_DEC | 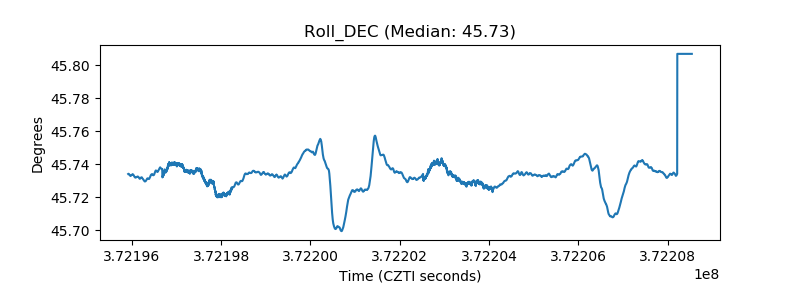 |
| _Roll_RA | 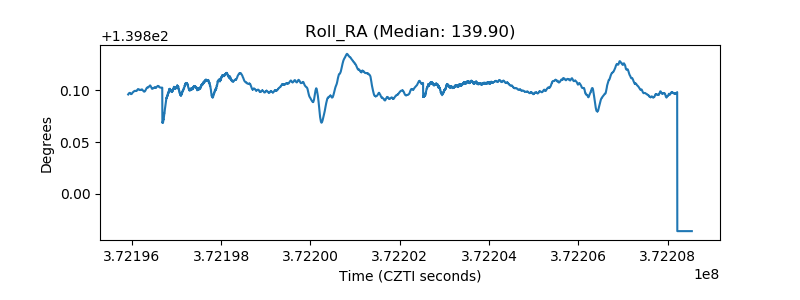 |
| Veto Counter |  |