| Param | Original file | Final file |
|---|---|---|
| Filename | modeM0/AS1A10_057T04_9000004728_32740cztM0_level2.evt | modeM0/AS1A10_057T04_9000004728_32740cztM0_level2_quad_clean.evt |
| Size (bytes) | 346,213,440 | 59,757,120 |
| Size | 330.2 MB | 57.0 MB |
| Events in quadrant A | 2,422,334 | 375,141 |
| Events in quadrant B | 2,252,202 | 396,025 |
| Events in quadrant C | 1,936,272 | 391,772 |
| Events in quadrant D | 3,597,391 | 359,578 |
| Mode M0 | |||
|---|---|---|---|
| Quadrant | BADHDUFLAG | Total packets | Discarded packets |
| A | 0 | 9827 | 2 |
| B | 0 | 9337 | 1 |
| C | 0 | 8502 | 1 |
| D | 0 | 13501 | 1 |
| Mode M9 | |||
|---|---|---|---|
| Quadrant | BADHDUFLAG | Total packets | Discarded packets |
| A | 0 | 18 | 0 |
| B | 0 | 18 | 0 |
| C | 0 | 18 | 0 |
| D | 0 | 18 | 0 |
| Mode SS | |||
|---|---|---|---|
| Quadrant | BADHDUFLAG | Total packets | Discarded packets |
| A | 0 | 84 | 0 |
| B | 0 | 84 | 0 |
| C | 0 | 84 | 0 |
| D | 0 | 84 | 0 |
| Quadrant | Total seconds | Saturated seconds | Saturation percentage |
|---|---|---|---|
| A | 4063 | 161 | 3.962589% |
| B | 4063 | 31 | 0.762983% |
| C | 4063 | 14 | 0.344573% |
| D | 4063 | 251 | 6.177701% |
Noise dominated data is calculated using 1-second bins in cleaned event files. If a bin has >2000 counts, and if more than 50% of those come from <1% of pixels, then it is considered to be noise-dominated and hence unusable.
| Quadrant | # 1 sec bins | Bins with >0 counts | Bins with >2000 counts | High rate bins dominated by noise | Noise dominated (total time) | Noise dominated (detector-on time) | Marked lightcurve |
|---|---|---|---|---|---|---|---|
| A | 5855 | 4064 | 131 | 131 | 2.24% | 3.22% | 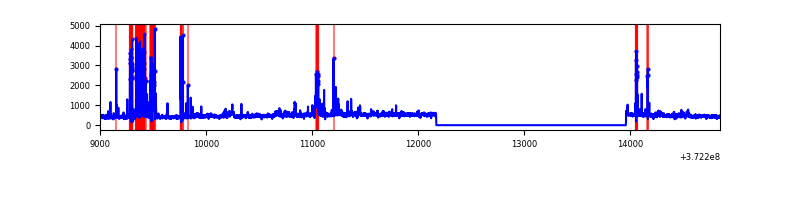 |
| B | 5855 | 4064 | 19 | 19 | 0.32% | 0.47% | 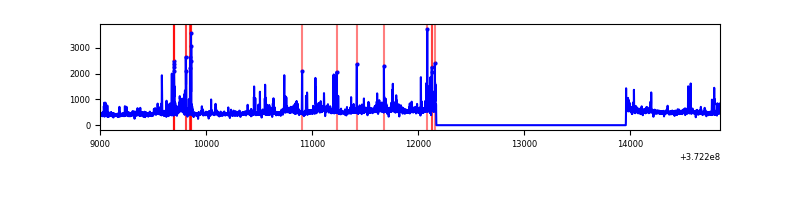 |
| C | 5855 | 4064 | 6 | 6 | 0.10% | 0.15% | 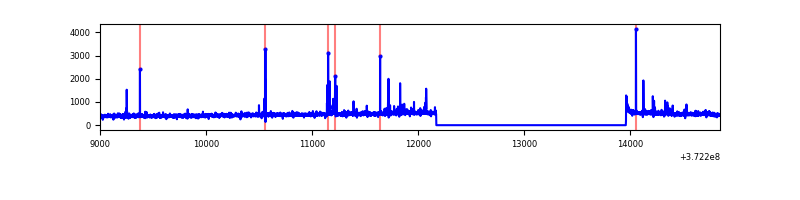 |
| D | 5855 | 4064 | 192 | 192 | 3.28% | 4.72% | 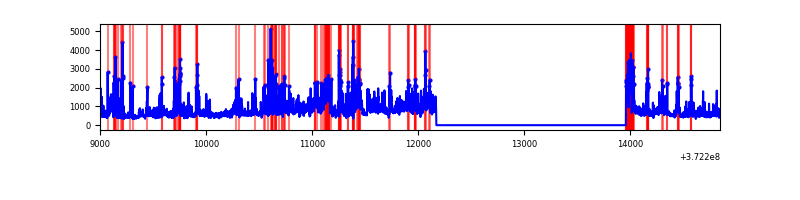 |
Top three noisy pixels from each quadrant. If the there are fewer than three noisy pixels in the level2.evt file, extra rows are filled as -1
| Pixel properties | Quadrant properties | ||||||
|---|---|---|---|---|---|---|---|
| Quadrant | DetID | PixID | Counts | Sigma | Mean | Median | Sigma |
| A | 15 | 249 | 484702 | 5163.41 | 468 | 461 | 93.8 |
| A | 0 | 254 | 66732 | 706.64 | 468 | 461 | 93.8 |
| A | 15 | 237 | 50878 | 537.59 | 468 | 461 | 93.8 |
| B | 3 | 26 | 136755 | 1498.15 | 479 | 469 | 91.0 |
| B | 0 | 199 | 57168 | 623.28 | 479 | 469 | 91.0 |
| B | 0 | 219 | 53849 | 586.79 | 479 | 469 | 91.0 |
| C | 8 | 35 | 41749 | 382.55 | 463 | 466 | 107.9 |
| C | 8 | 79 | 26053 | 237.1 | 463 | 466 | 107.9 |
| C | 3 | 233 | 18624 | 168.26 | 463 | 466 | 107.9 |
| D | 8 | 195 | 603103 | 5566.3 | 448 | 438 | 108.3 |
| D | 7 | 80 | 256453 | 2364.59 | 448 | 438 | 108.3 |
| D | 2 | 250 | 206876 | 1906.69 | 448 | 438 | 108.3 |
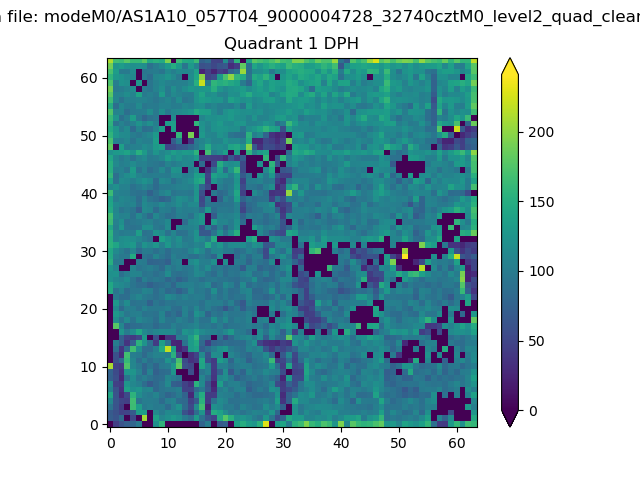
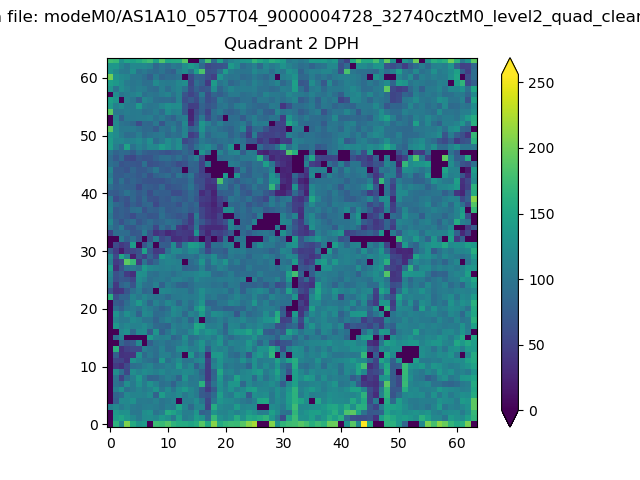
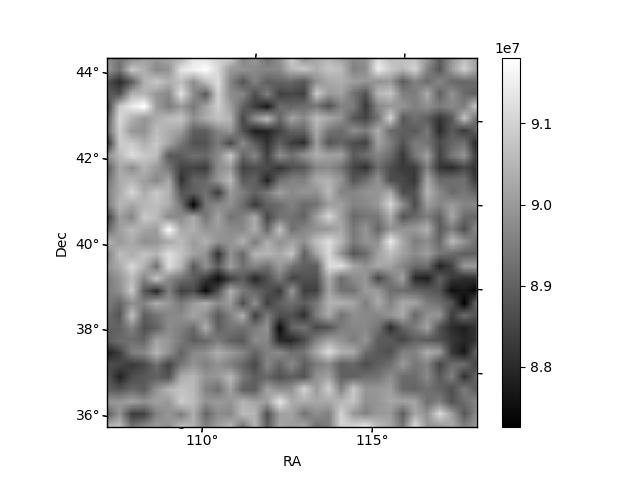
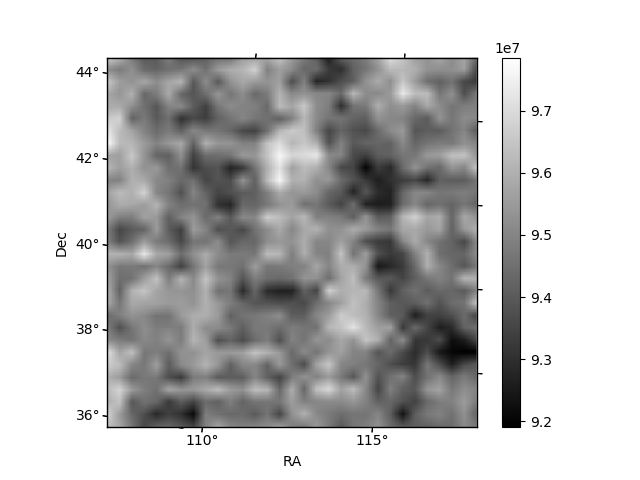
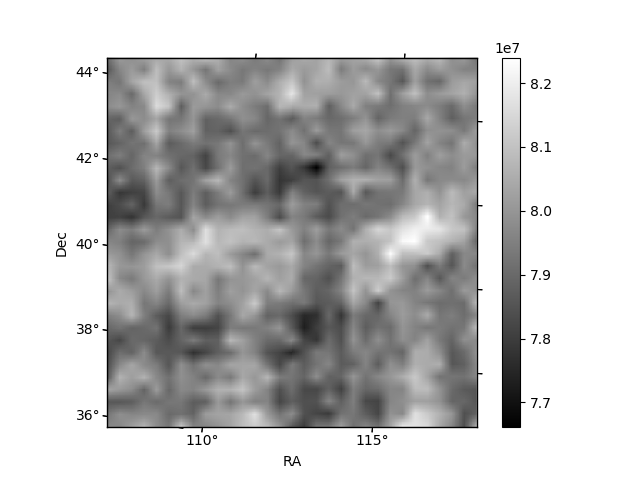
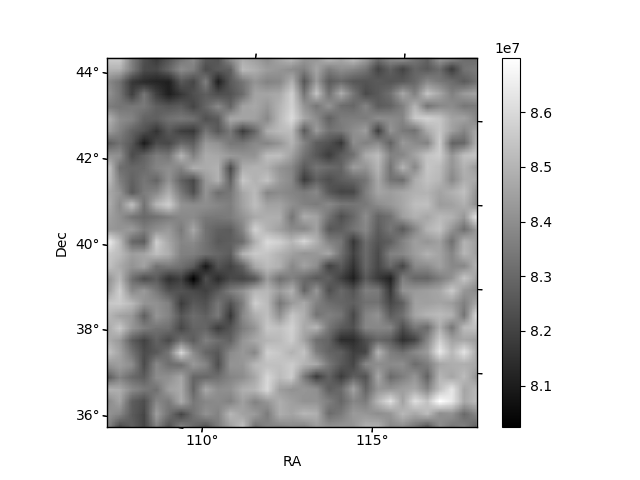
Histogram calculated using DETX and DETY for each event in the final _common_clean file
| Quadrant A |  |
 |
Quadrant B |
|---|---|---|---|
| Quadrant D |  |
 |
Quadrant C |
| Plot type | Count rate plots | Images |
|---|---|---|
| Comparison with Poisson distribution Blue bars denote a histogram of data divided into 1 sec bins. Red curve is a Poisson curve with rate = median count rate of data. |
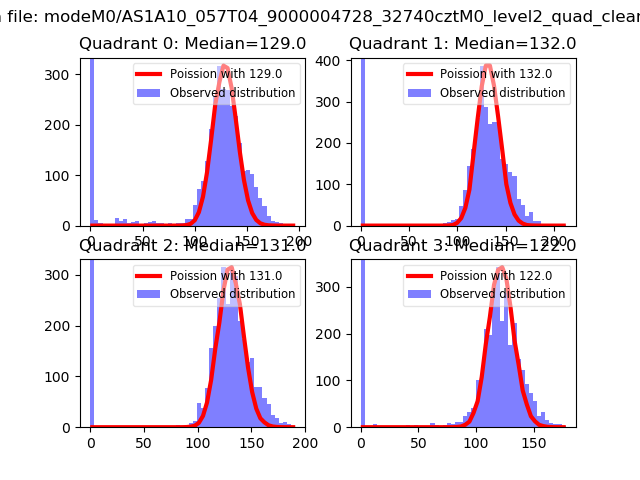 |
 |
| Quadrant-wise count rates Data is divided into 100 sec bins |
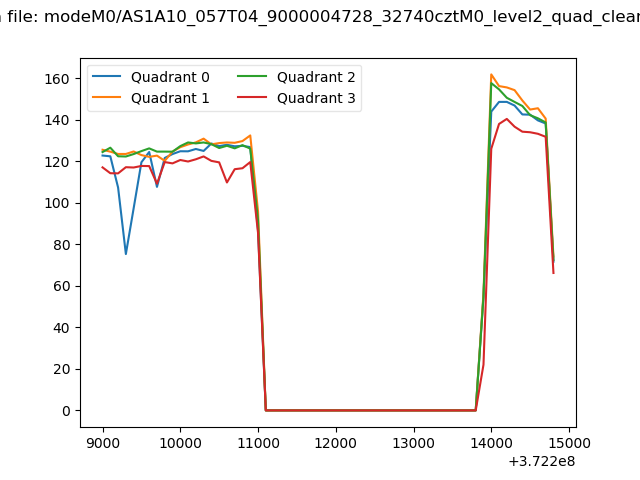 |
|
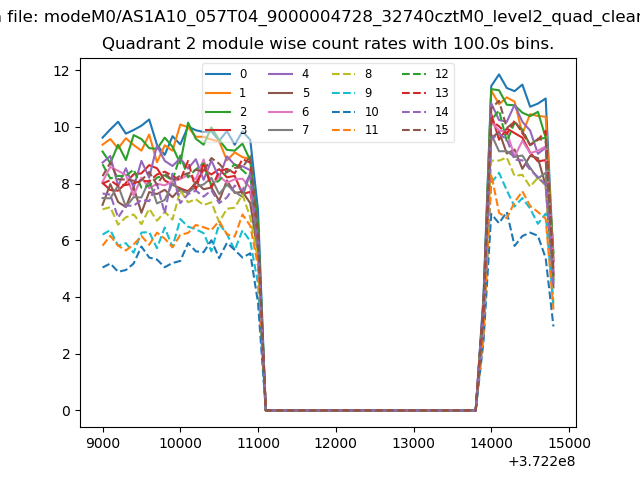
| Module-wise count rates for Quadrant A Data is divided into 100 sec bins |
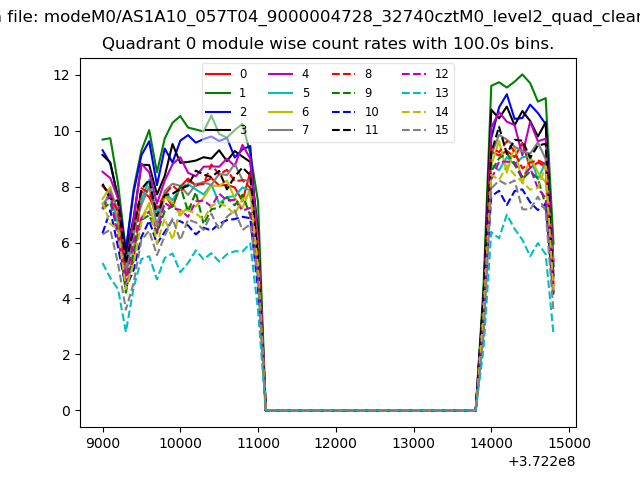 |
 |
| Module-wise count rates for Quadrant B Data is divided into 100 sec bins |
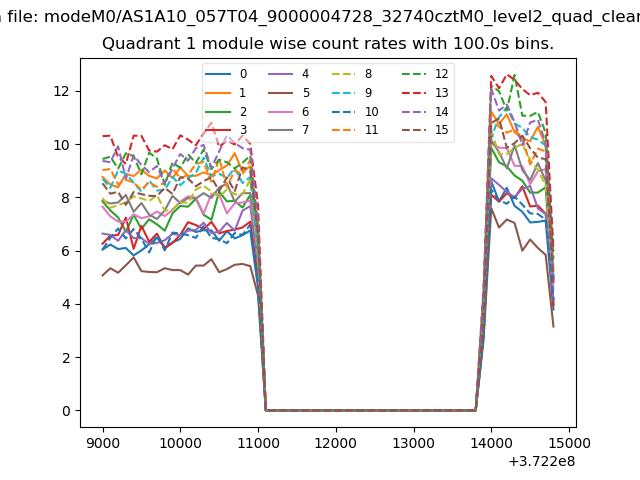 |
 |
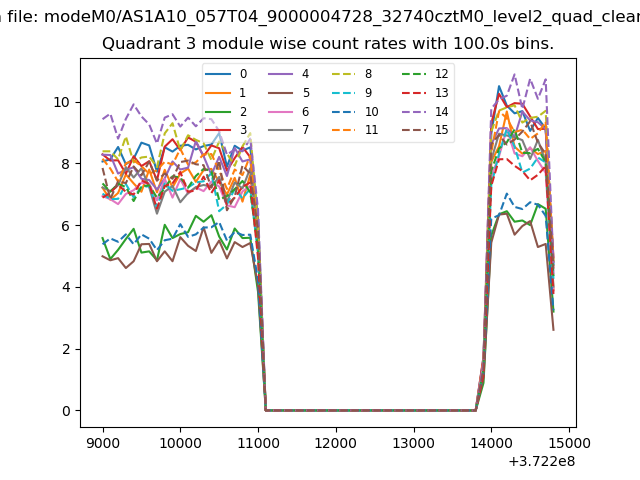
| Module-wise count rates for Quadrant C Data is divided into 100 sec bins |
 |
 |
| Module-wise count rates for Quadrant D Data is divided into 100 sec bins |
 |
 |
| Parameter | Plot |
|---|---|
| CZT HV Monitor | 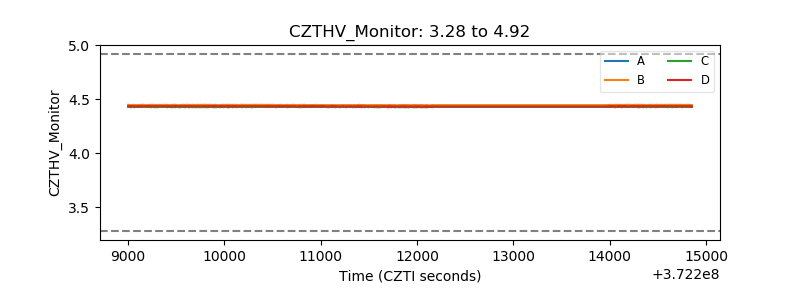 |
| D_VDD | 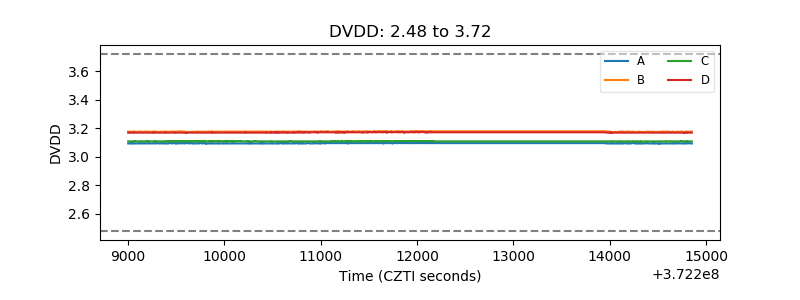 |
| Temperature 1 | 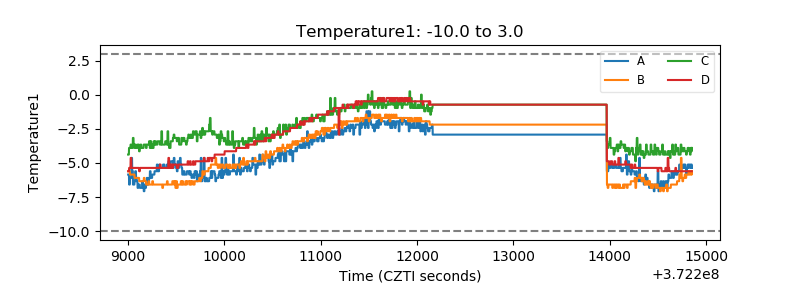 |
| Veto HV Monitor |  |
| Veto LLD | 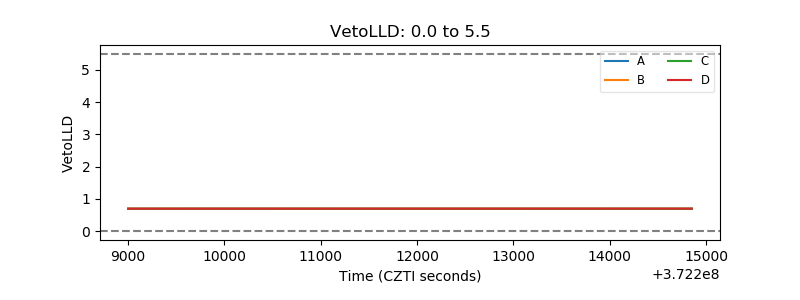 |
| Alpha Counter | 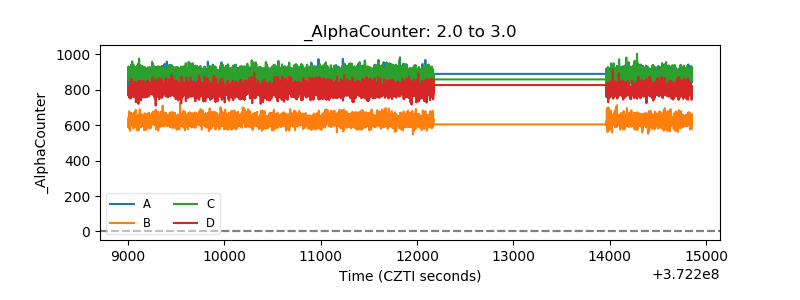 |
| _CPM_Rate | 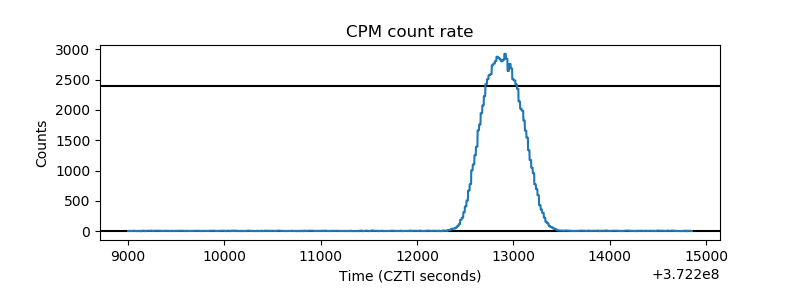 |
| CZT Counter | 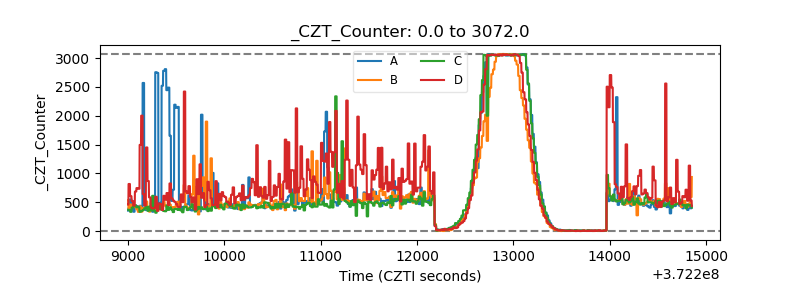 |
| +2.5 Volts monitor |  |
| +5 Volts monitor |  |
| _ROLL_ROT | 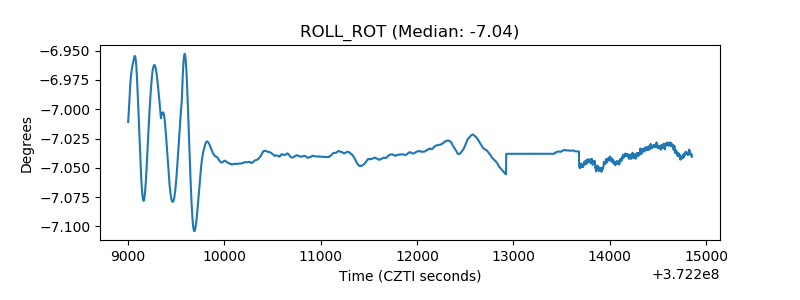 |
| _Roll_DEC | 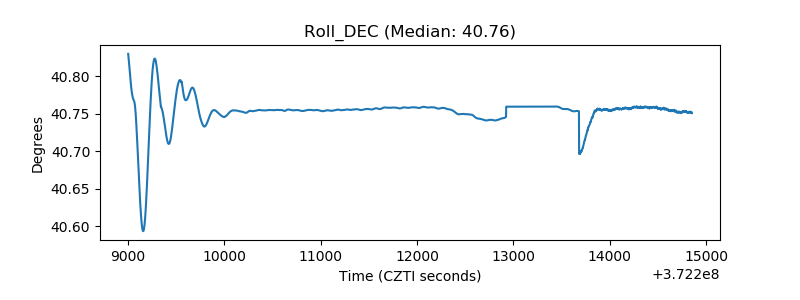 |
| _Roll_RA | 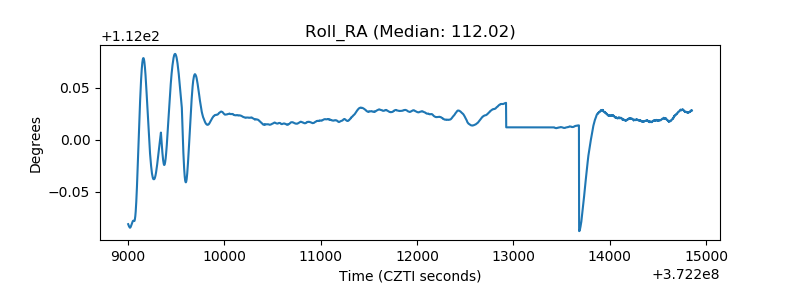 |
| Veto Counter | 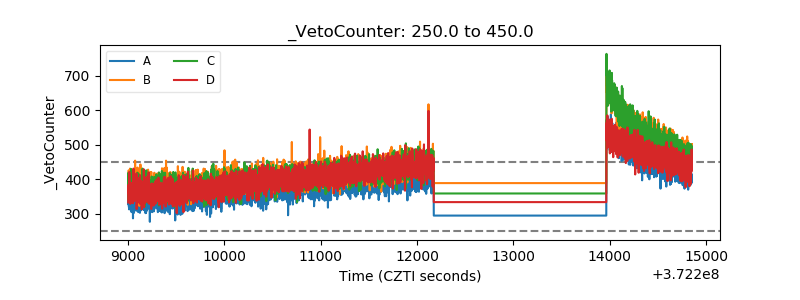 |