| Param | Original file | Final file |
|---|---|---|
| Filename | modeM0/AS1A10_057T04_9000004728_32741cztM0_level2.evt | modeM0/AS1A10_057T04_9000004728_32741cztM0_level2_quad_clean.evt |
| Size (bytes) | 484,871,040 | 84,205,440 |
| Size | 462.4 MB | 80.3 MB |
| Events in quadrant A | 2,914,026 | 557,158 |
| Events in quadrant B | 4,604,065 | 532,021 |
| Events in quadrant C | 2,665,730 | 562,093 |
| Events in quadrant D | 4,133,677 | 520,055 |
| Mode M0 | |||
|---|---|---|---|
| Quadrant | BADHDUFLAG | Total packets | Discarded packets |
| A | 0 | 12114 | 3 |
| B | 0 | 17223 | 2 |
| C | 0 | 11382 | 2 |
| D | 0 | 15977 | 2 |
| Mode M9 | |||
|---|---|---|---|
| Quadrant | BADHDUFLAG | Total packets | Discarded packets |
| A | 0 | 36 | 0 |
| B | 0 | 36 | 0 |
| C | 0 | 36 | 0 |
| D | 0 | 37 | 0 |
| Mode SS | |||
|---|---|---|---|
| Quadrant | BADHDUFLAG | Total packets | Discarded packets |
| A | 0 | 108 | 0 |
| B | 0 | 108 | 0 |
| C | 0 | 108 | 0 |
| D | 0 | 108 | 0 |
| Quadrant | Total seconds | Saturated seconds | Saturation percentage |
|---|---|---|---|
| A | 5413 | 73 | 1.348605% |
| B | 5413 | 734 | 13.559948% |
| C | 5413 | 39 | 0.720488% |
| D | 5413 | 242 | 4.470719% |
Noise dominated data is calculated using 1-second bins in cleaned event files. If a bin has >2000 counts, and if more than 50% of those come from <1% of pixels, then it is considered to be noise-dominated and hence unusable.
| Quadrant | # 1 sec bins | Bins with >0 counts | Bins with >2000 counts | High rate bins dominated by noise | Noise dominated (total time) | Noise dominated (detector-on time) | Marked lightcurve |
|---|---|---|---|---|---|---|---|
| A | 7355 | 5414 | 44 | 44 | 0.60% | 0.81% | 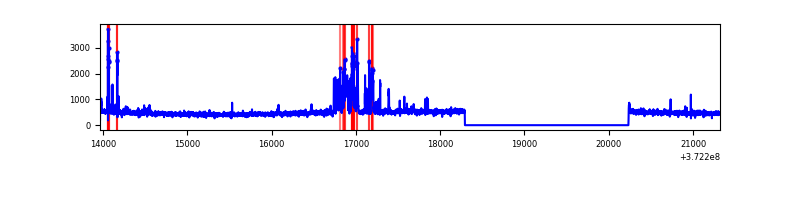 |
| B | 7354 | 5413 | 511 | 511 | 6.95% | 9.44% | 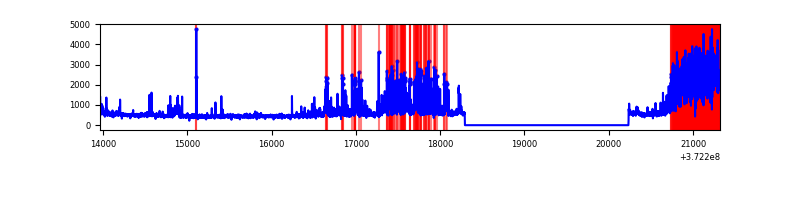 |
| C | 7355 | 5414 | 21 | 21 | 0.29% | 0.39% | 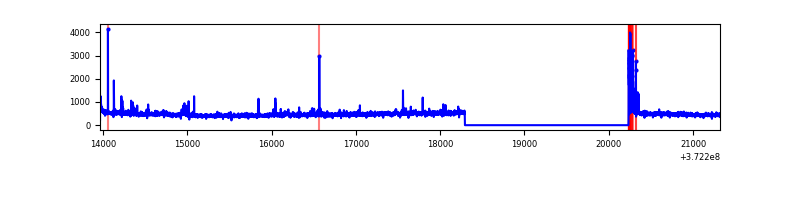 |
| D | 7355 | 5414 | 191 | 191 | 2.60% | 3.53% | 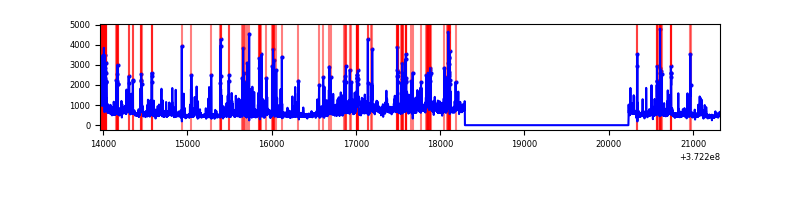 |
Top three noisy pixels from each quadrant. If the there are fewer than three noisy pixels in the level2.evt file, extra rows are filled as -1
| Pixel properties | Quadrant properties | ||||||
|---|---|---|---|---|---|---|---|
| Quadrant | DetID | PixID | Counts | Sigma | Mean | Median | Sigma |
| A | 15 | 249 | 331377 | 2595.93 | 645 | 637 | 127.4 |
| A | 15 | 237 | 44279 | 342.54 | 645 | 637 | 127.4 |
| A | 12 | 16 | 15246 | 114.66 | 645 | 637 | 127.4 |
| B | 12 | 1 | 1229800 | 10727.06 | 620 | 608 | 114.6 |
| B | 15 | 36 | 640741 | 5586.39 | 620 | 608 | 114.6 |
| B | 0 | 197 | 60657 | 524.04 | 620 | 608 | 114.6 |
| C | 0 | 10 | 116366 | 802.14 | 629 | 635 | 144.3 |
| C | 8 | 79 | 43939 | 300.14 | 629 | 635 | 144.3 |
| C | 3 | 233 | 17616 | 117.7 | 629 | 635 | 144.3 |
| D | 8 | 195 | 419745 | 2881.04 | 608 | 596 | 145.5 |
| D | 2 | 250 | 352954 | 2421.95 | 608 | 596 | 145.5 |
| D | 2 | 249 | 321270 | 2204.17 | 608 | 596 | 145.5 |
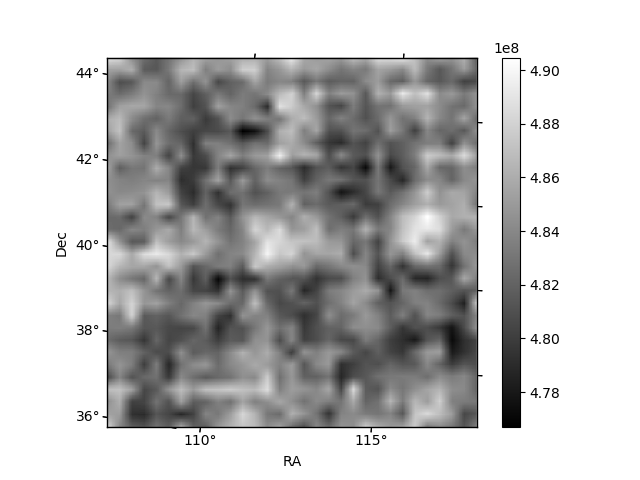
Histogram calculated using DETX and DETY for each event in the final _common_clean file
| Quadrant A | 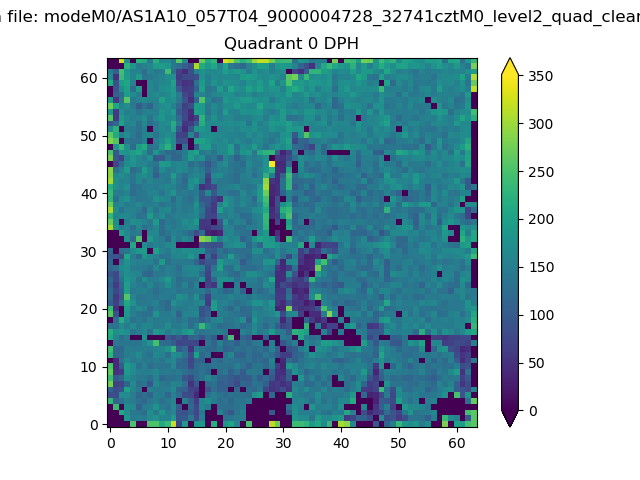 |
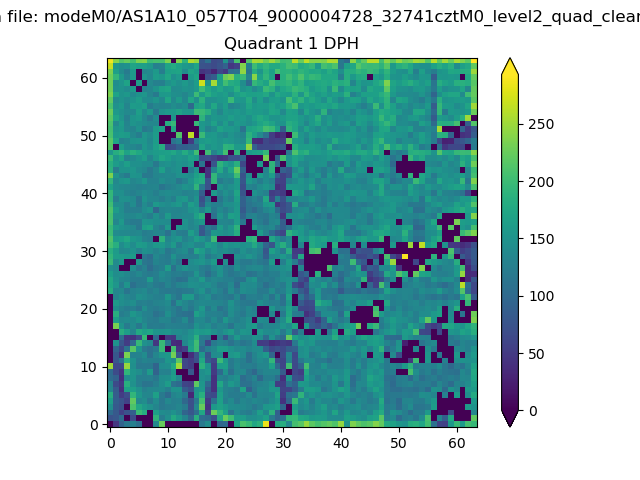 |
Quadrant B |
|---|---|---|---|
| Quadrant D | 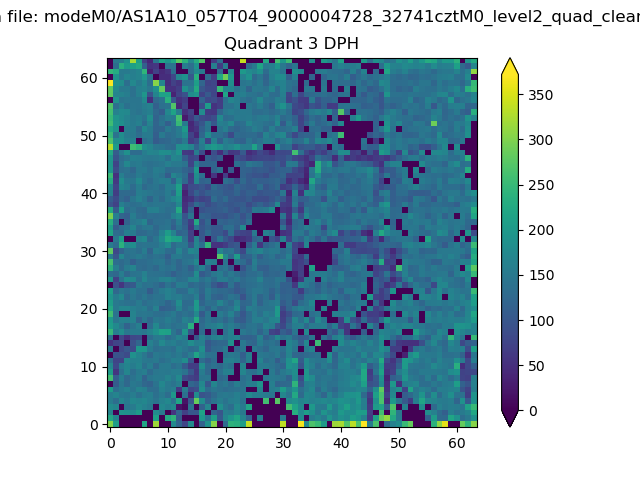 |
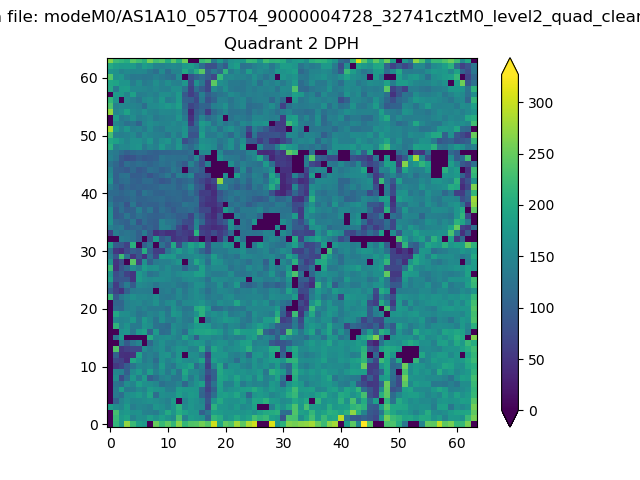 |
Quadrant C |
| Plot type | Count rate plots | Images |
|---|---|---|
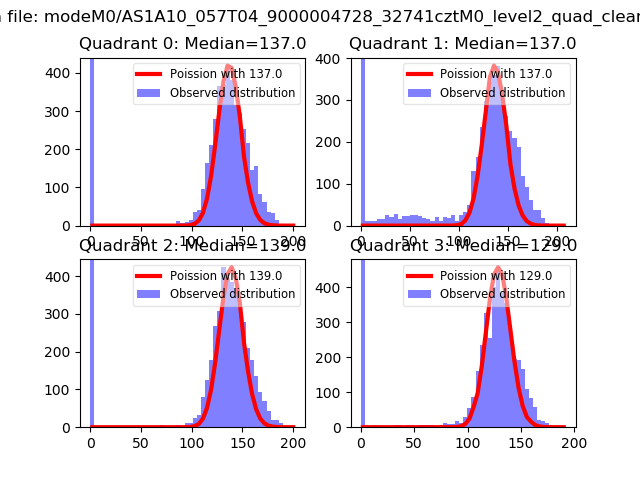
| Comparison with Poisson distribution Blue bars denote a histogram of data divided into 1 sec bins. Red curve is a Poisson curve with rate = median count rate of data. |
 |
 |
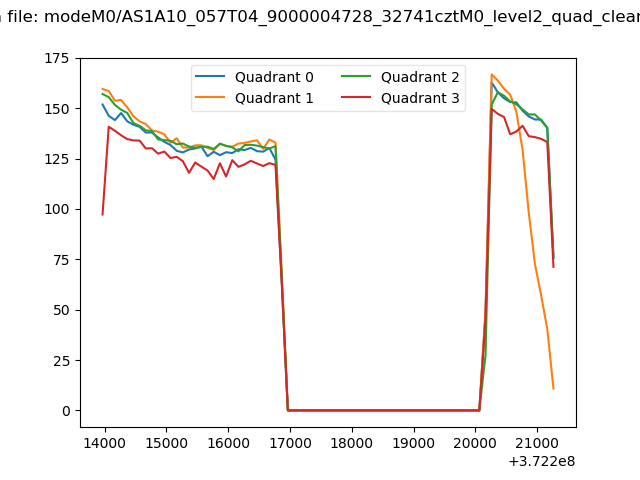
| Quadrant-wise count rates Data is divided into 100 sec bins |
 |
|
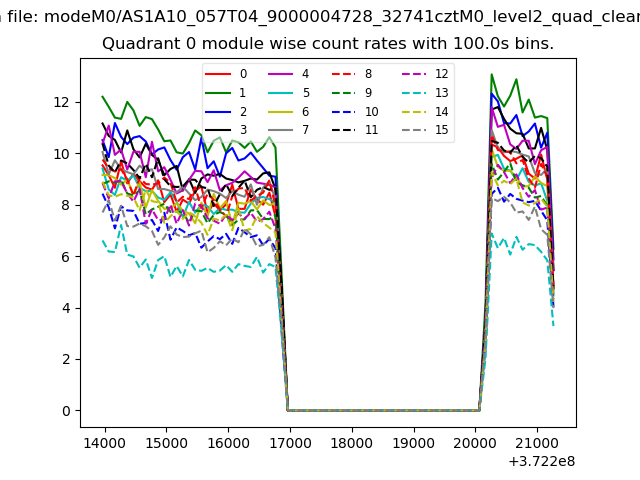
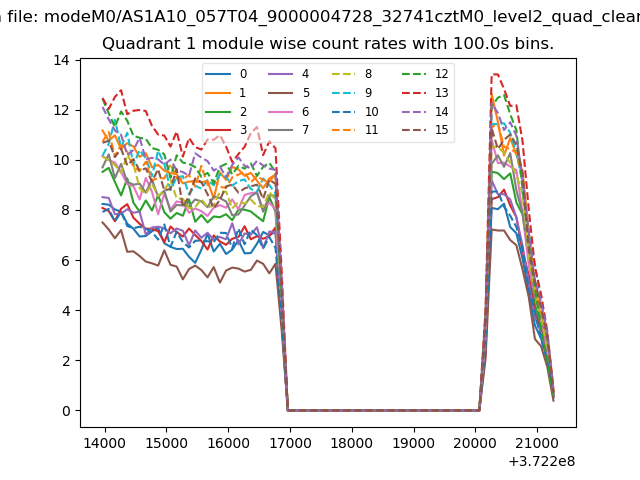
| Module-wise count rates for Quadrant A Data is divided into 100 sec bins |
 |
 |
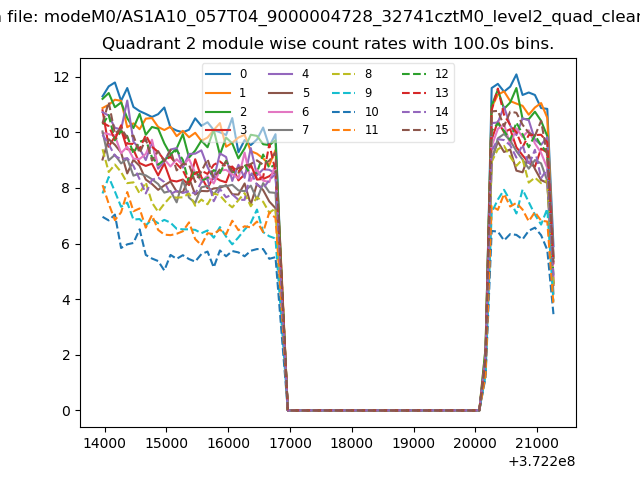
| Module-wise count rates for Quadrant B Data is divided into 100 sec bins |
 |
 |
| Module-wise count rates for Quadrant C Data is divided into 100 sec bins |
 |
 |
| Module-wise count rates for Quadrant D Data is divided into 100 sec bins |
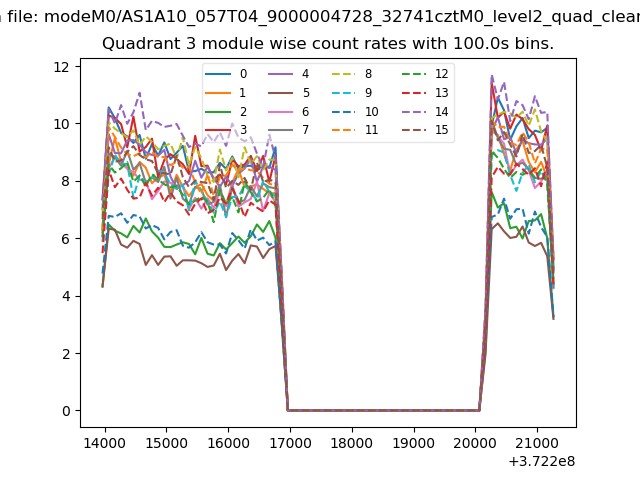 |
 |
| Parameter | Plot |
|---|---|
| CZT HV Monitor | 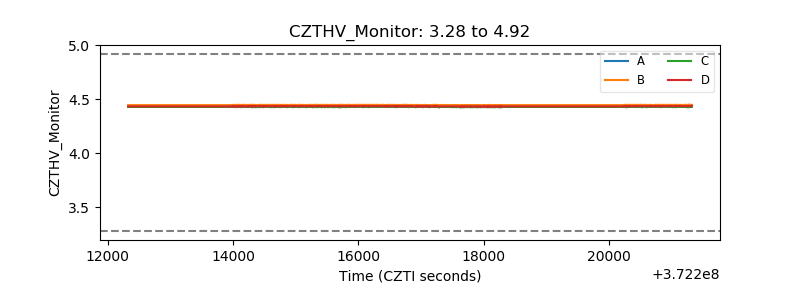 |
| D_VDD | 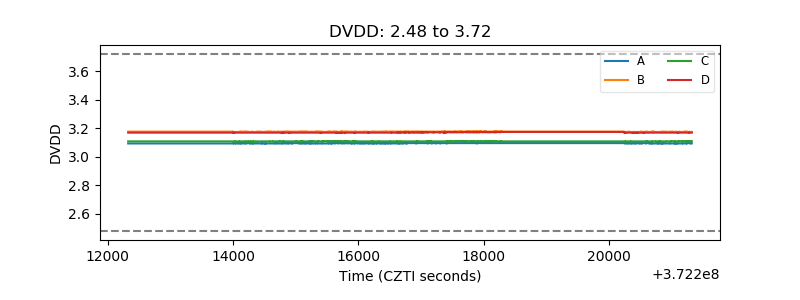 |
| Temperature 1 | 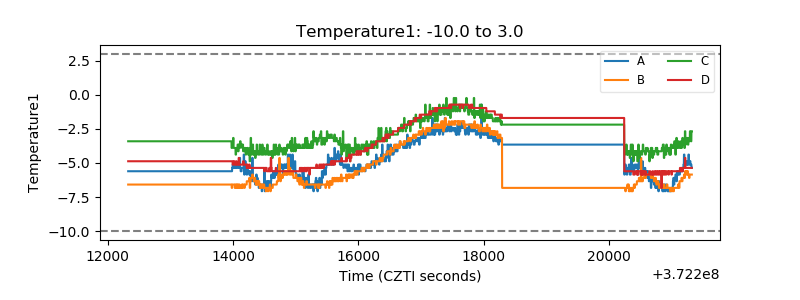 |
| Veto HV Monitor | 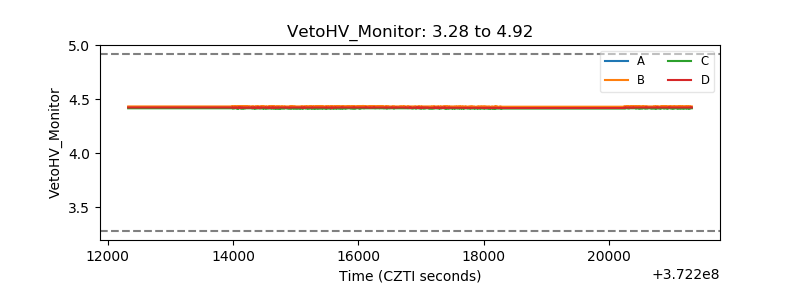 |
| Veto LLD | 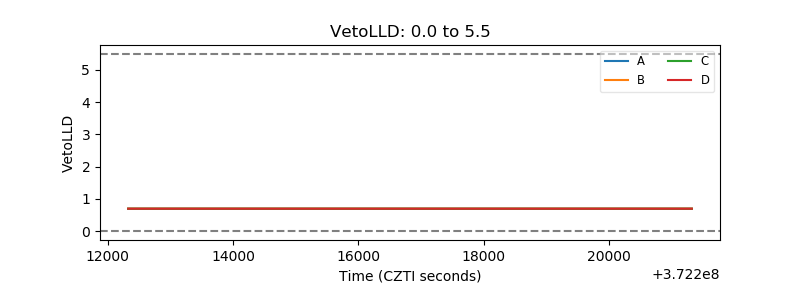 |
| Alpha Counter | 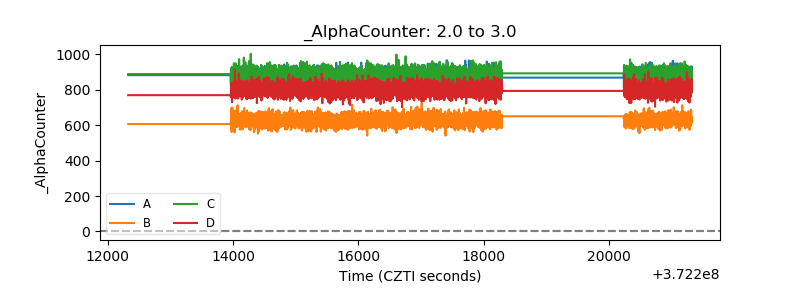 |
| _CPM_Rate | 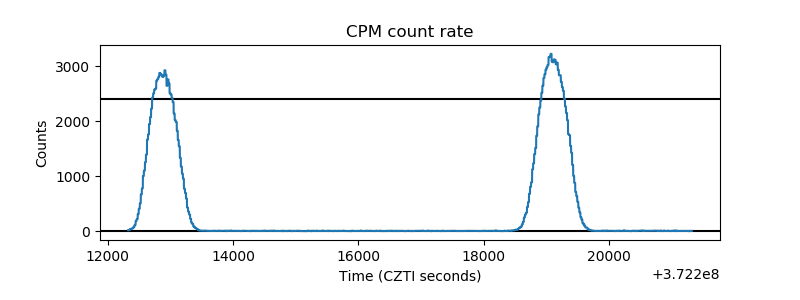 |
| CZT Counter | 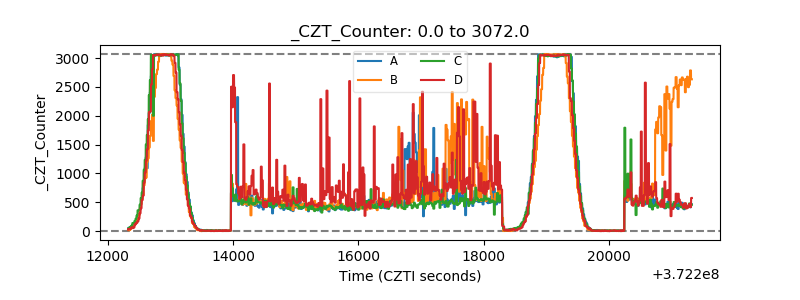 |
| +2.5 Volts monitor |  |
| +5 Volts monitor |  |
| _ROLL_ROT | 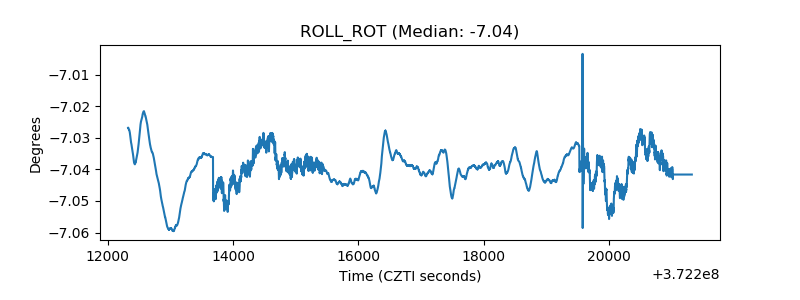 |
| _Roll_DEC | 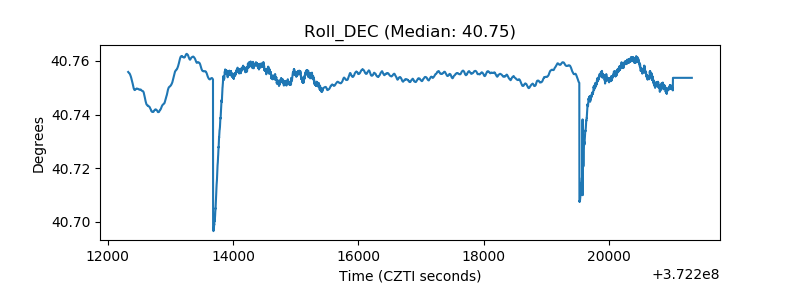 |
| _Roll_RA | 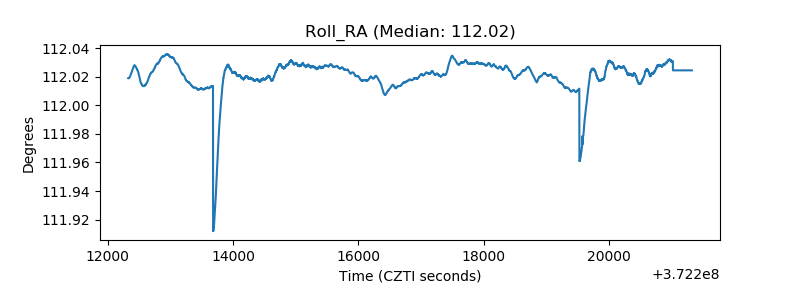 |
| Veto Counter | 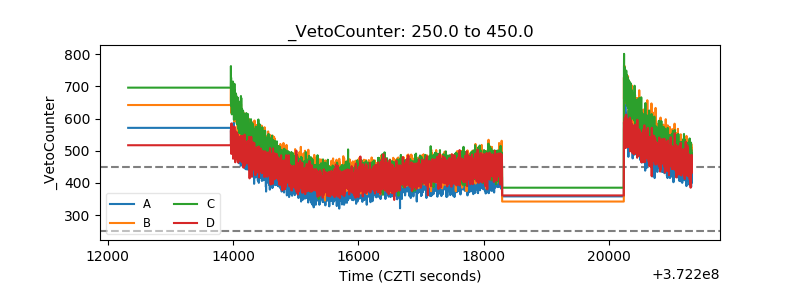 |