| Param | Original file | Final file |
|---|---|---|
| Filename | modeM0/AS1A10_057T04_9000004728_32742cztM0_level2.evt | modeM0/AS1A10_057T04_9000004728_32742cztM0_level2_quad_clean.evt |
| Size (bytes) | 1,349,069,760 | 176,552,640 |
| Size | 1.3 GB | 168.4 MB |
| Events in quadrant A | 8,189,387 | 1,156,936 |
| Events in quadrant B | 14,574,906 | 1,003,868 |
| Events in quadrant C | 6,449,269 | 1,191,184 |
| Events in quadrant D | 10,772,215 | 1,100,793 |
| Mode M0 | |||
|---|---|---|---|
| Quadrant | BADHDUFLAG | Total packets | Discarded packets |
| A | 0 | 32563 | 4 |
| B | 0 | 51931 | 3 |
| C | 0 | 27637 | 3 |
| D | 0 | 40914 | 7 |
| Mode M9 | |||
|---|---|---|---|
| Quadrant | BADHDUFLAG | Total packets | Discarded packets |
| A | 0 | 58 | 0 |
| B | 0 | 58 | 0 |
| C | 0 | 58 | 0 |
| D | 0 | 58 | 0 |
| Mode SS | |||
|---|---|---|---|
| Quadrant | BADHDUFLAG | Total packets | Discarded packets |
| A | 0 | 264 | 0 |
| B | 0 | 264 | 0 |
| C | 0 | 264 | 0 |
| D | 0 | 264 | 0 |
| Quadrant | Total seconds | Saturated seconds | Saturation percentage |
|---|---|---|---|
| A | 12929 | 527 | 4.076108% |
| B | 12929 | 3559 | 27.527264% |
| C | 12929 | 83 | 0.641968% |
| D | 12928 | 716 | 5.538366% |
Noise dominated data is calculated using 1-second bins in cleaned event files. If a bin has >2000 counts, and if more than 50% of those come from <1% of pixels, then it is considered to be noise-dominated and hence unusable.
| Quadrant | # 1 sec bins | Bins with >0 counts | Bins with >2000 counts | High rate bins dominated by noise | Noise dominated (total time) | Noise dominated (detector-on time) | Marked lightcurve |
|---|---|---|---|---|---|---|---|
| A | 18696 | 12932 | 475 | 475 | 2.54% | 3.67% | 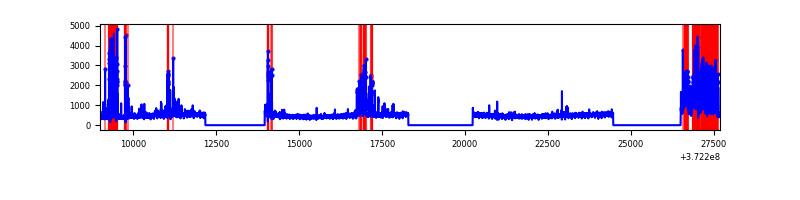 |
| B | 18696 | 12931 | 2818 | 2818 | 15.07% | 21.79% | 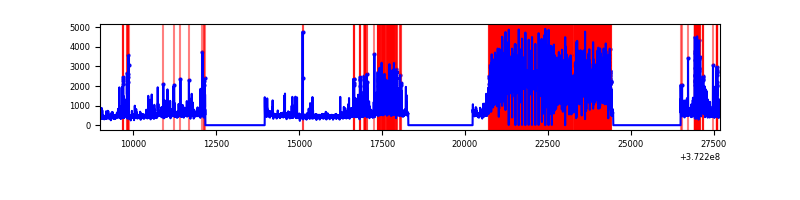 |
| C | 18696 | 12932 | 47 | 47 | 0.25% | 0.36% | 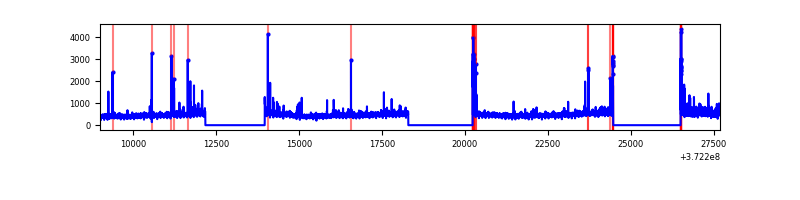 |
| D | 18696 | 12932 | 567 | 567 | 3.03% | 4.38% | 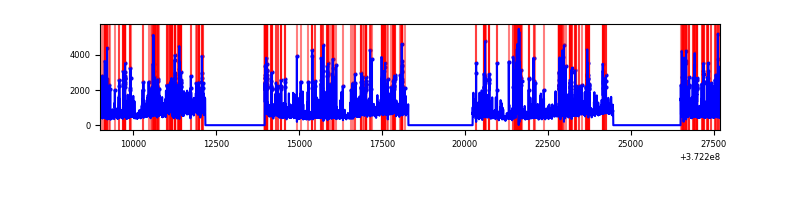 |
Top three noisy pixels from each quadrant. If the there are fewer than three noisy pixels in the level2.evt file, extra rows are filled as -1
| Pixel properties | Quadrant properties | ||||||
|---|---|---|---|---|---|---|---|
| Quadrant | DetID | PixID | Counts | Sigma | Mean | Median | Sigma |
| A | 15 | 249 | 2063576 | 6909.65 | 1533 | 1511 | 298.4 |
| A | 0 | 254 | 89874 | 296.09 | 1533 | 1511 | 298.4 |
| A | 15 | 237 | 64745 | 211.89 | 1533 | 1511 | 298.4 |
| B | 12 | 1 | 7503227 | 30833.59 | 1317 | 1291 | 243.3 |
| B | 15 | 36 | 704036 | 2888.34 | 1317 | 1291 | 243.3 |
| B | 5 | 172 | 361020 | 1478.52 | 1317 | 1291 | 243.3 |
| C | 0 | 10 | 191840 | 558.21 | 1496 | 1511 | 341.0 |
| C | 8 | 229 | 168195 | 488.86 | 1496 | 1511 | 341.0 |
| C | 8 | 79 | 86686 | 249.81 | 1496 | 1511 | 341.0 |
| D | 8 | 195 | 1296517 | 3770.3 | 1456 | 1427 | 343.5 |
| D | 2 | 250 | 736458 | 2139.84 | 1456 | 1427 | 343.5 |
| D | 2 | 249 | 731622 | 2125.76 | 1456 | 1427 | 343.5 |
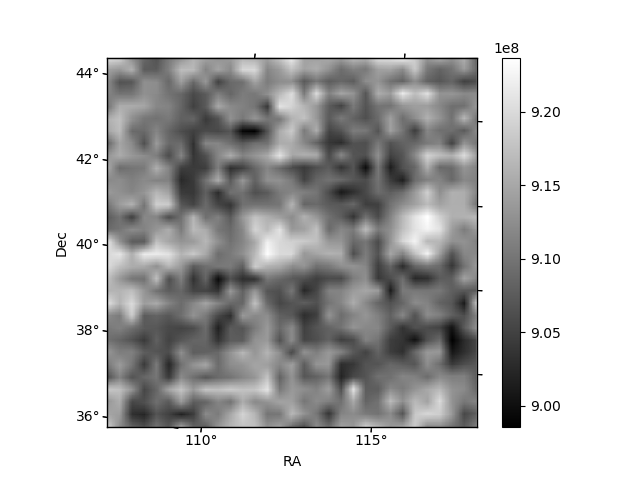
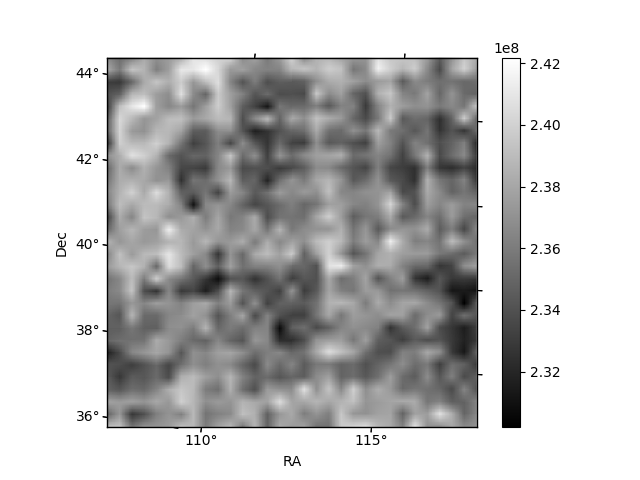
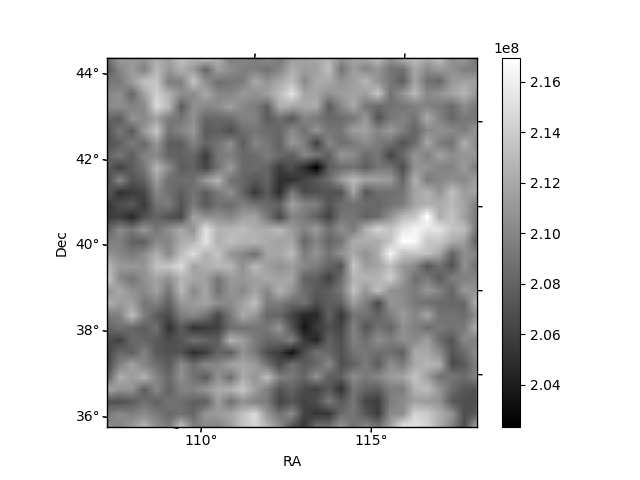
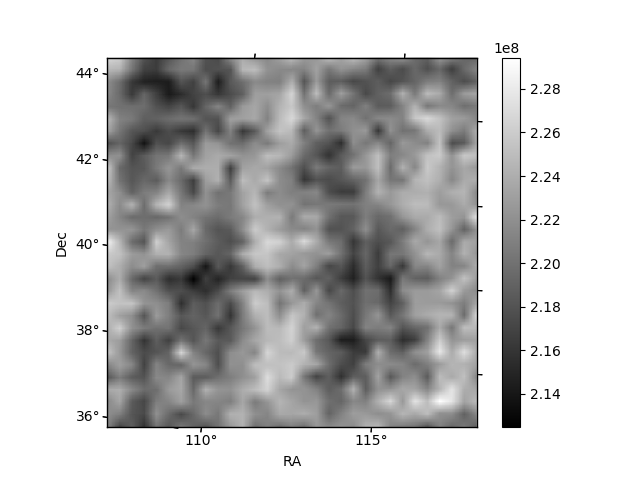
Histogram calculated using DETX and DETY for each event in the final _common_clean file
| Quadrant A | 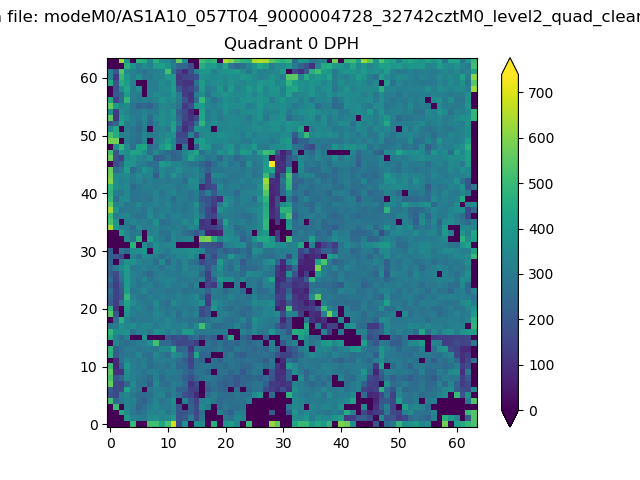 |
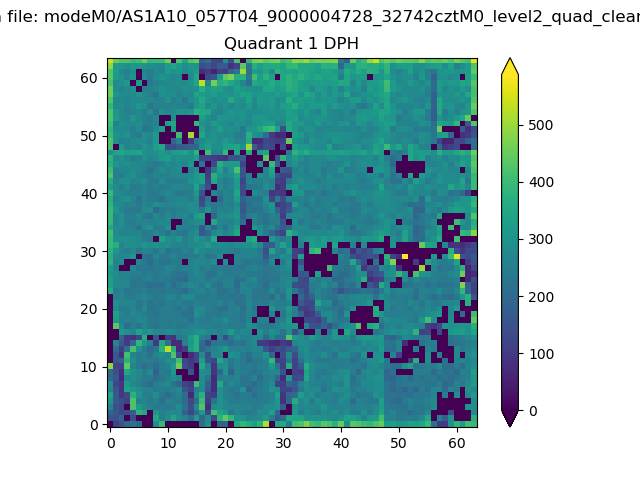 |
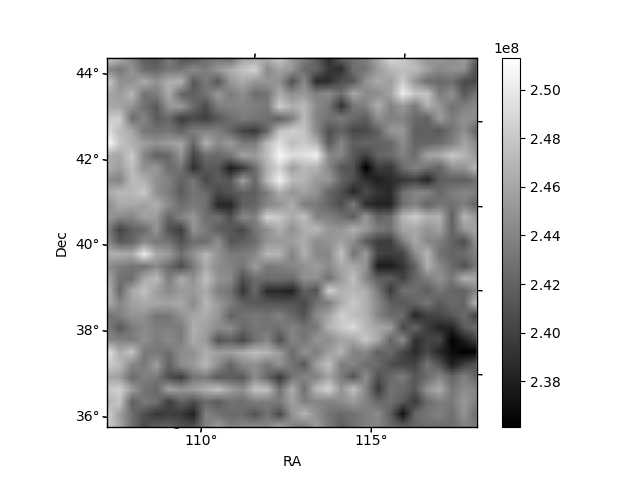
Quadrant B |
|---|---|---|---|
| Quadrant D | 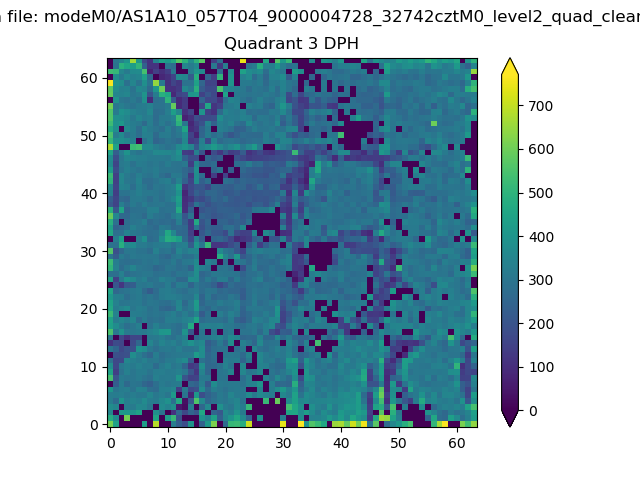 |
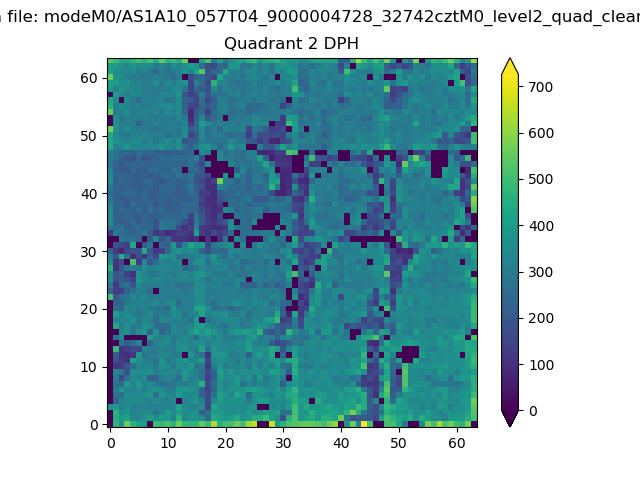 |
Quadrant C |
| Plot type | Count rate plots | Images |
|---|---|---|
| Comparison with Poisson distribution Blue bars denote a histogram of data divided into 1 sec bins. Red curve is a Poisson curve with rate = median count rate of data. |
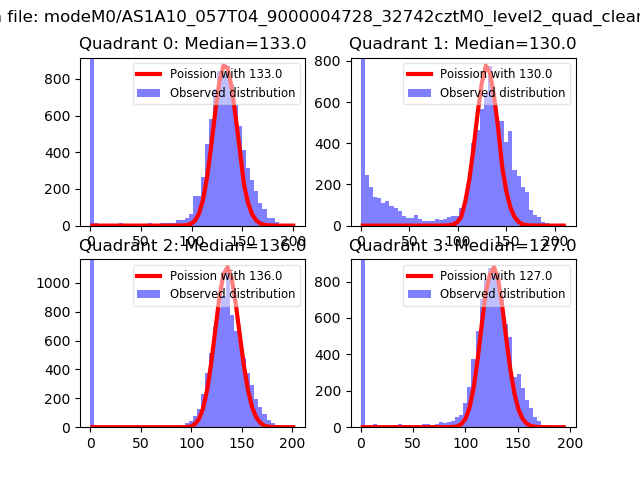 |
 |
| Quadrant-wise count rates Data is divided into 100 sec bins |
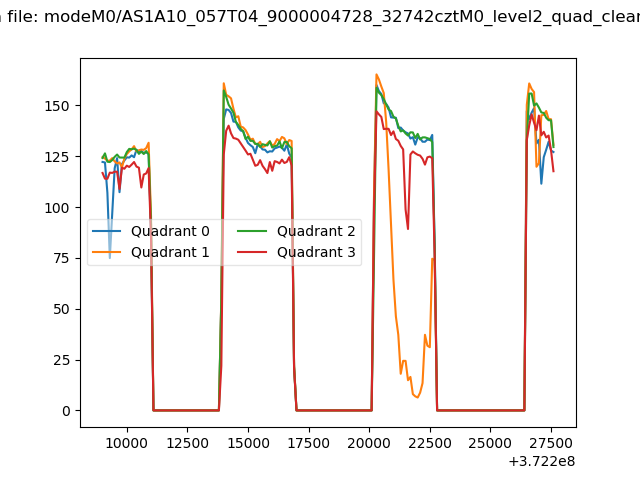 |
|
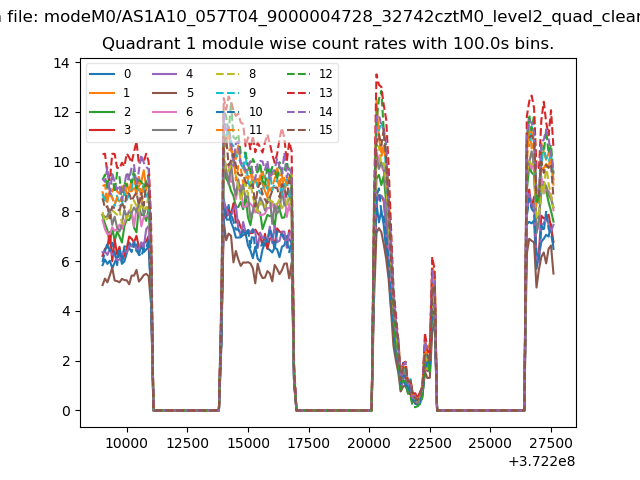
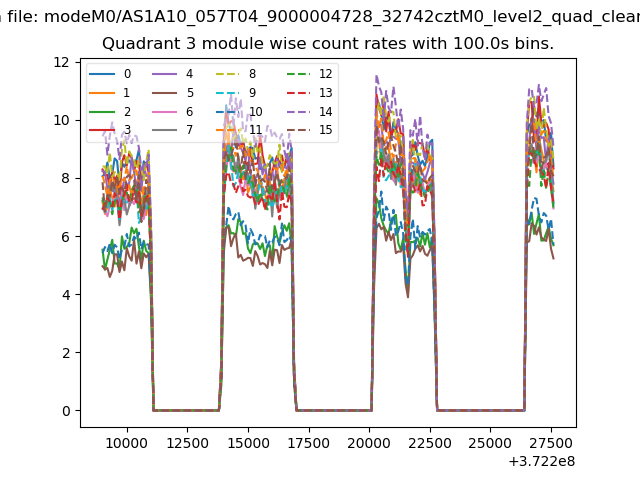
| Module-wise count rates for Quadrant A Data is divided into 100 sec bins |
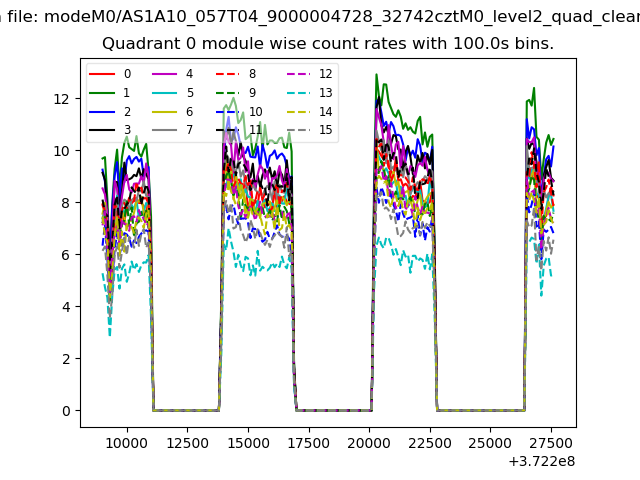 |
 |
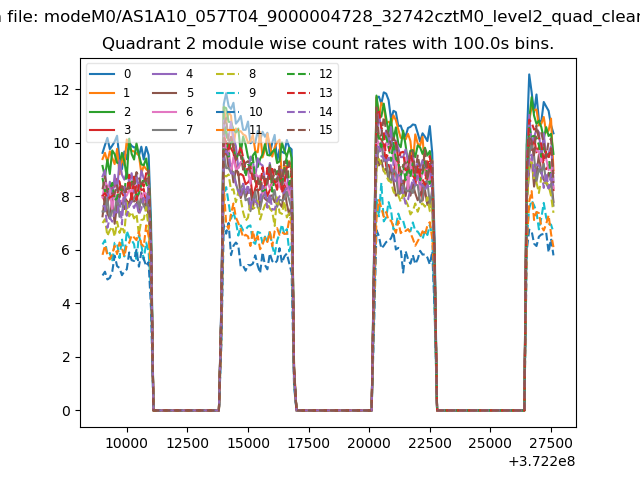
| Module-wise count rates for Quadrant B Data is divided into 100 sec bins |
 |
 |
| Module-wise count rates for Quadrant C Data is divided into 100 sec bins |
 |
 |
| Module-wise count rates for Quadrant D Data is divided into 100 sec bins |
 |
 |
| Parameter | Plot |
|---|---|
| CZT HV Monitor | 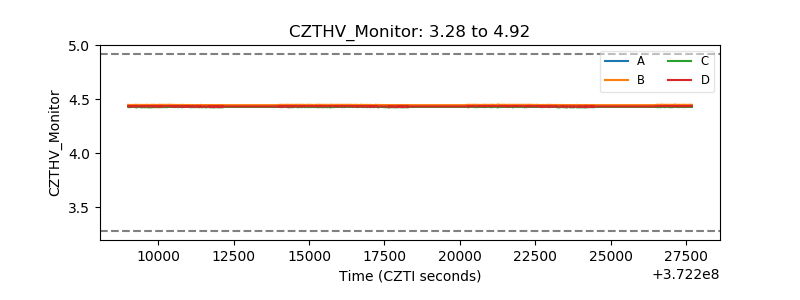 |
| D_VDD | 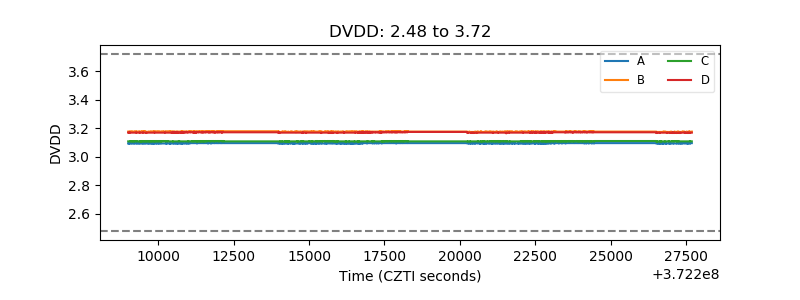 |
| Temperature 1 | 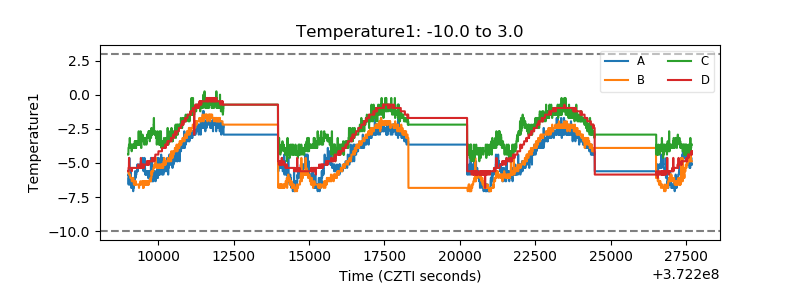 |
| Veto HV Monitor | 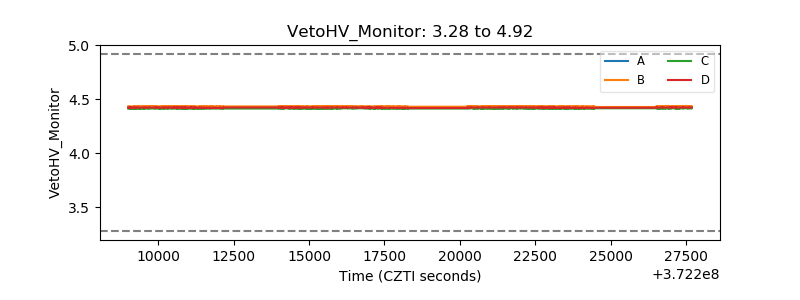 |
| Veto LLD | 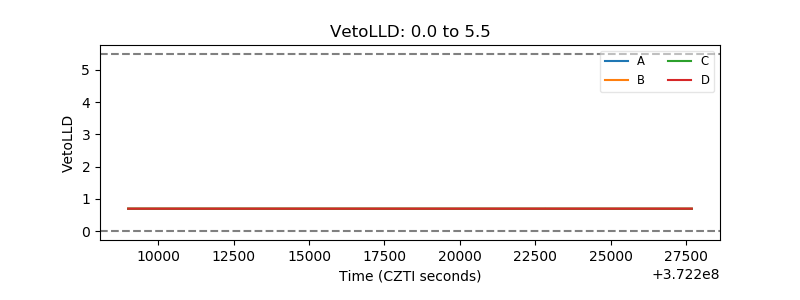 |
| Alpha Counter | 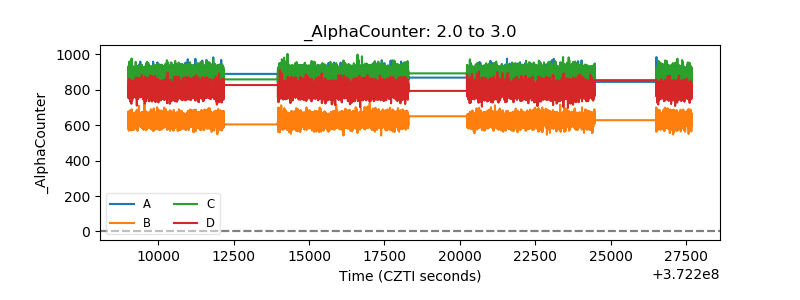 |
| _CPM_Rate | 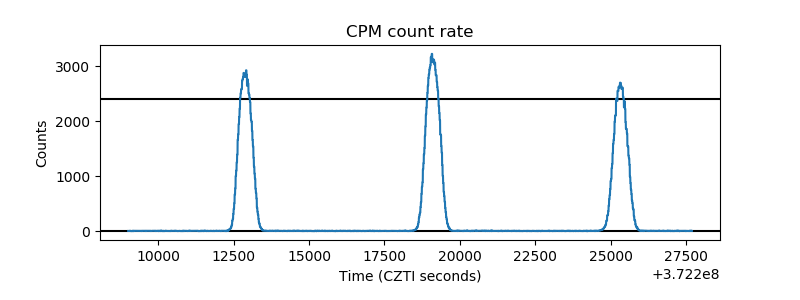 |
| CZT Counter | 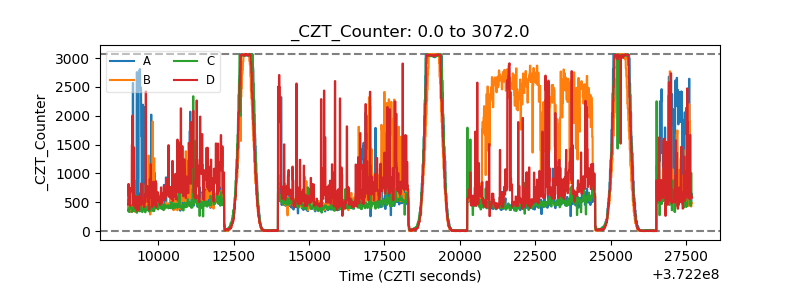 |
| +2.5 Volts monitor |  |
| +5 Volts monitor | 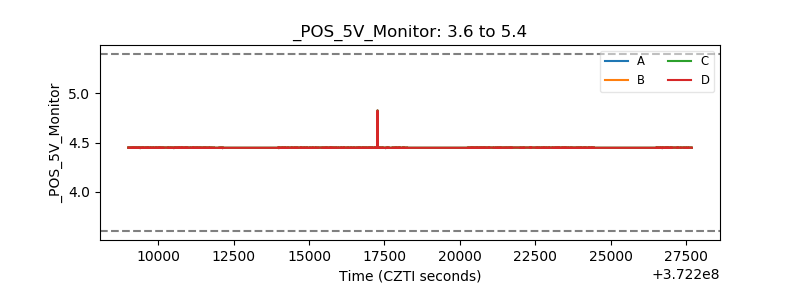 |
| _ROLL_ROT | 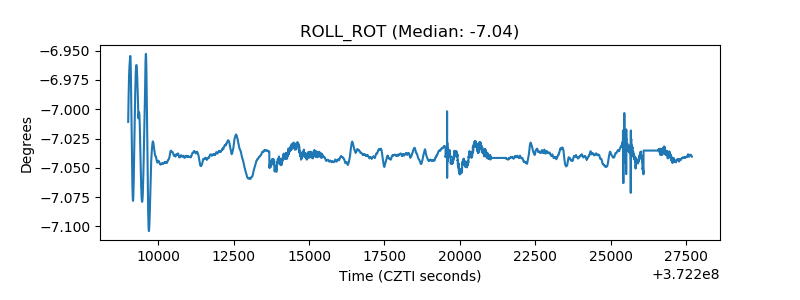 |
| _Roll_DEC | 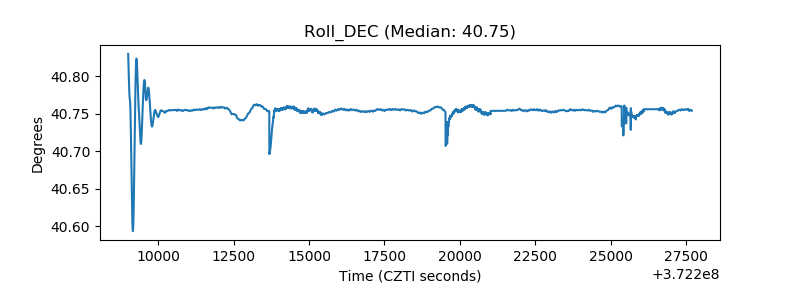 |
| _Roll_RA | 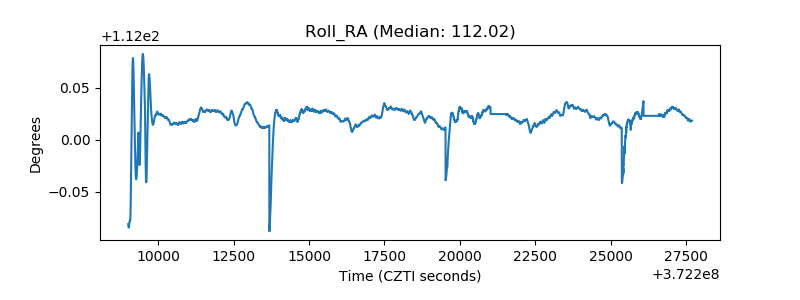 |
| Veto Counter | 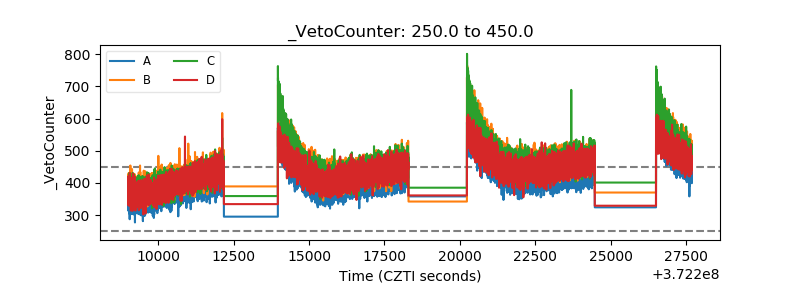 |