| Param | Original file | Final file |
|---|---|---|
| Filename | modeM0/AS1A10_057T04_9000004728_32743cztM0_level2.evt | modeM0/AS1A10_057T04_9000004728_32743cztM0_level2_quad_clean.evt |
| Size (bytes) | 611,392,320 | 66,677,760 |
| Size | 583.1 MB | 63.6 MB |
| Events in quadrant A | 4,672,794 | 413,833 |
| Events in quadrant B | 6,009,237 | 430,644 |
| Events in quadrant C | 3,291,844 | 425,498 |
| Events in quadrant D | 4,201,517 | 395,494 |
| Mode M0 | |||
|---|---|---|---|
| Quadrant | BADHDUFLAG | Total packets | Discarded packets |
| A | 0 | 17161 | 2 |
| B | 0 | 21123 | 1 |
| C | 0 | 13152 | 1 |
| D | 0 | 16020 | 1 |
| Mode M9 | |||
|---|---|---|---|
| Quadrant | BADHDUFLAG | Total packets | Discarded packets |
| A | 0 | 21 | 0 |
| B | 0 | 21 | 0 |
| C | 0 | 21 | 0 |
| D | 0 | 21 | 0 |
| Mode SS | |||
|---|---|---|---|
| Quadrant | BADHDUFLAG | Total packets | Discarded packets |
| A | 0 | 104 | 0 |
| B | 0 | 104 | 0 |
| C | 0 | 104 | 0 |
| D | 0 | 104 | 0 |
| Quadrant | Total seconds | Saturated seconds | Saturation percentage |
|---|---|---|---|
| A | 5037 | 643 | 12.765535% |
| B | 5037 | 1534 | 30.454636% |
| C | 5037 | 63 | 1.250744% |
| D | 5037 | 169 | 3.355172% |
Noise dominated data is calculated using 1-second bins in cleaned event files. If a bin has >2000 counts, and if more than 50% of those come from <1% of pixels, then it is considered to be noise-dominated and hence unusable.
| Quadrant | # 1 sec bins | Bins with >0 counts | Bins with >2000 counts | High rate bins dominated by noise | Noise dominated (total time) | Noise dominated (detector-on time) | Marked lightcurve |
|---|---|---|---|---|---|---|---|
| A | 7161 | 5038 | 508 | 508 | 7.09% | 10.08% | 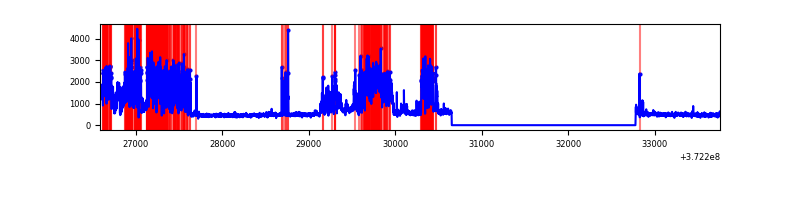 |
| B | 7161 | 5038 | 1133 | 1133 | 15.82% | 22.49% | 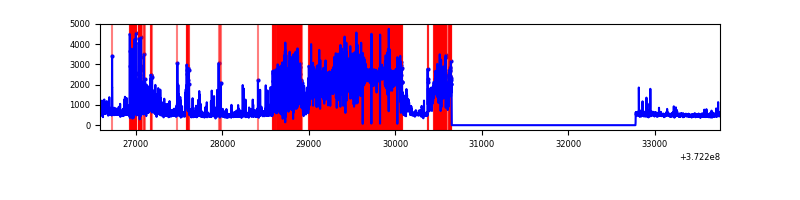 |
| C | 7161 | 5038 | 51 | 51 | 0.71% | 1.01% | 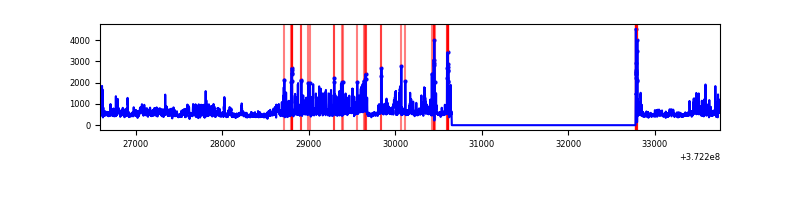 |
| D | 7161 | 5038 | 173 | 173 | 2.42% | 3.43% | 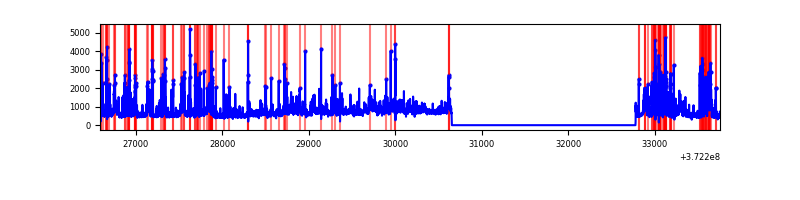 |
Top three noisy pixels from each quadrant. If the there are fewer than three noisy pixels in the level2.evt file, extra rows are filled as -1
| Pixel properties | Quadrant properties | ||||||
|---|---|---|---|---|---|---|---|
| Quadrant | DetID | PixID | Counts | Sigma | Mean | Median | Sigma |
| A | 15 | 249 | 2184020 | 18289.13 | 602 | 593 | 119.4 |
| A | 12 | 16 | 46449 | 384.11 | 602 | 593 | 119.4 |
| A | 15 | 237 | 43356 | 358.2 | 602 | 593 | 119.4 |
| B | 12 | 1 | 3022269 | 31233.55 | 516 | 506 | 96.7 |
| B | 15 | 36 | 360769 | 3723.75 | 516 | 506 | 96.7 |
| B | 5 | 172 | 287792 | 2969.45 | 516 | 506 | 96.7 |
| C | 8 | 229 | 796216 | 5812.39 | 596 | 602 | 136.9 |
| C | 0 | 10 | 60442 | 437.16 | 596 | 602 | 136.9 |
| C | 9 | 54 | 33919 | 243.4 | 596 | 602 | 136.9 |
| D | 8 | 195 | 471476 | 3305.96 | 590 | 576 | 142.4 |
| D | 2 | 250 | 336779 | 2360.32 | 590 | 576 | 142.4 |
| D | 1 | 47 | 201031 | 1407.3 | 590 | 576 | 142.4 |
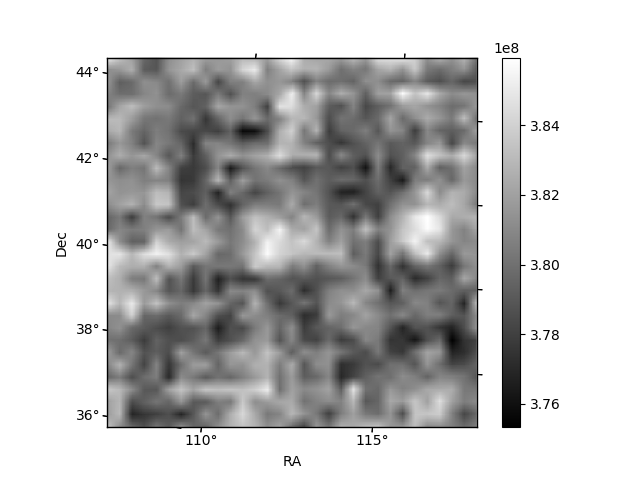
Histogram calculated using DETX and DETY for each event in the final _common_clean file
| Quadrant A | 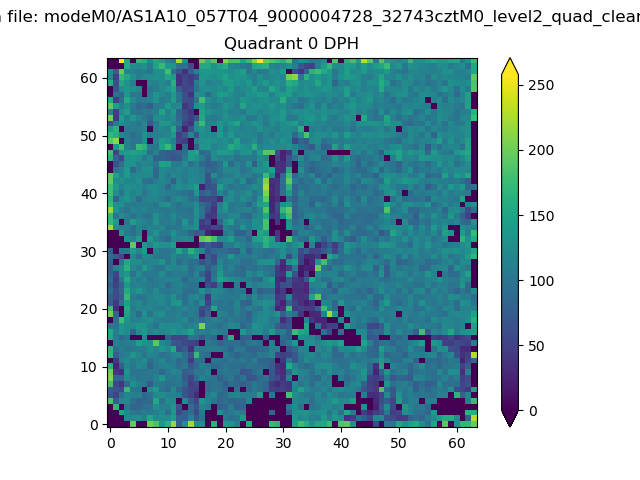 |
 |
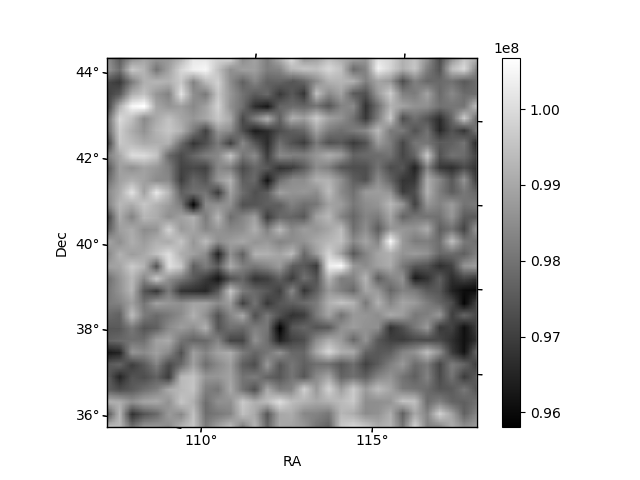
Quadrant B |
|---|---|---|---|
| Quadrant D | 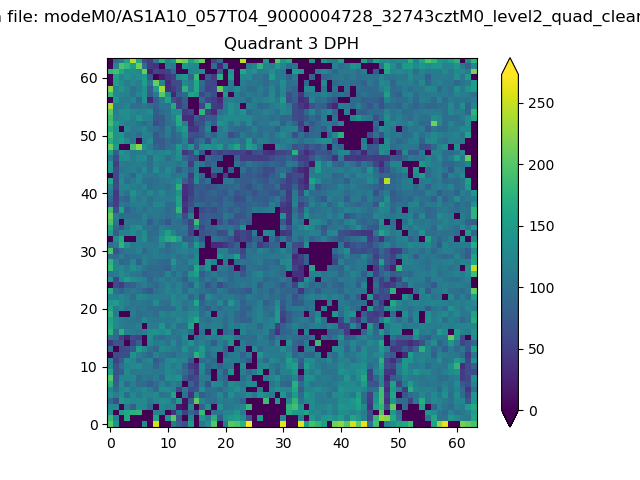 |
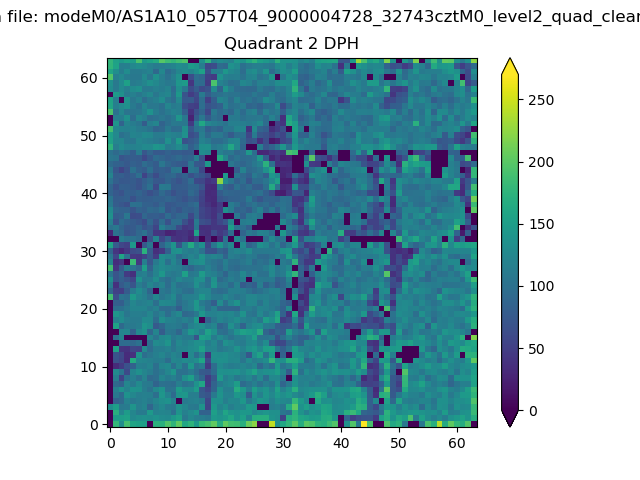 |
Quadrant C |
| Plot type | Count rate plots | Images |
|---|---|---|
| Comparison with Poisson distribution Blue bars denote a histogram of data divided into 1 sec bins. Red curve is a Poisson curve with rate = median count rate of data. |
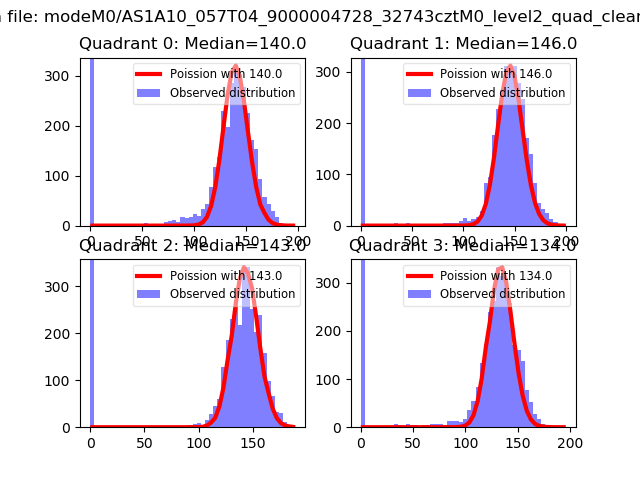 |
 |
| Quadrant-wise count rates Data is divided into 100 sec bins |
 |
|
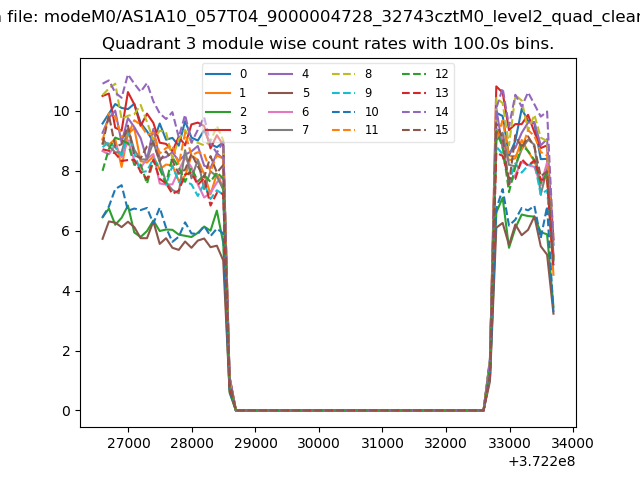
| Module-wise count rates for Quadrant A Data is divided into 100 sec bins |
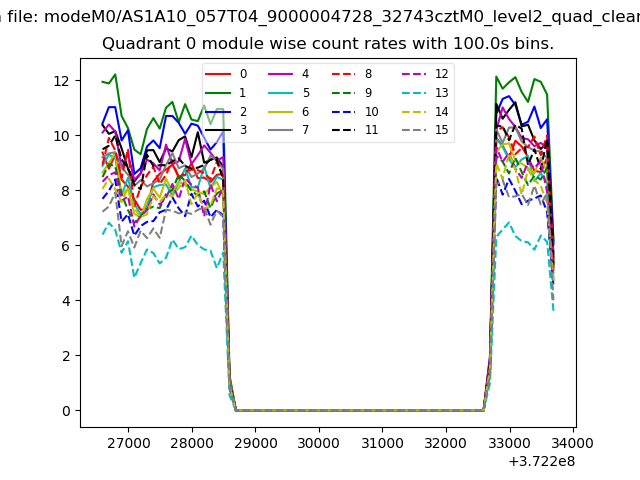 |
 |
| Module-wise count rates for Quadrant B Data is divided into 100 sec bins |
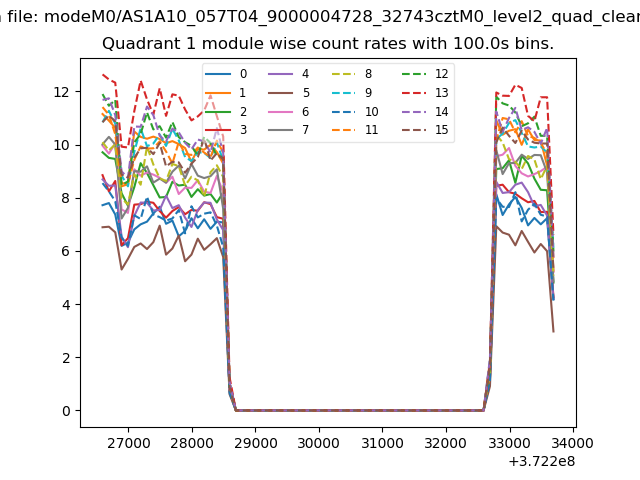 |
 |
| Module-wise count rates for Quadrant C Data is divided into 100 sec bins |
 |
 |
| Module-wise count rates for Quadrant D Data is divided into 100 sec bins |
 |
 |
| Parameter | Plot |
|---|---|
| CZT HV Monitor | 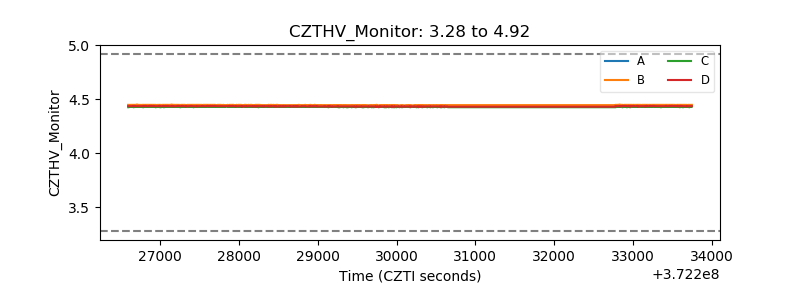 |
| D_VDD | 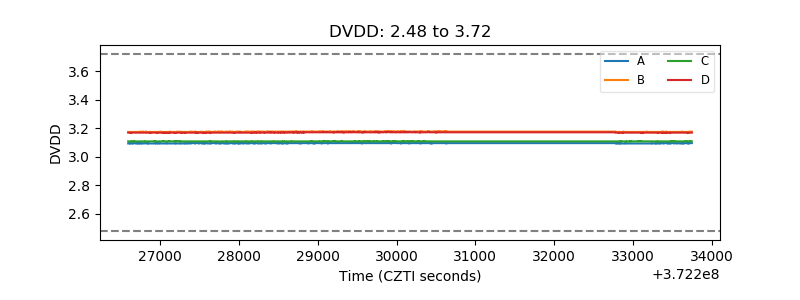 |
| Temperature 1 | 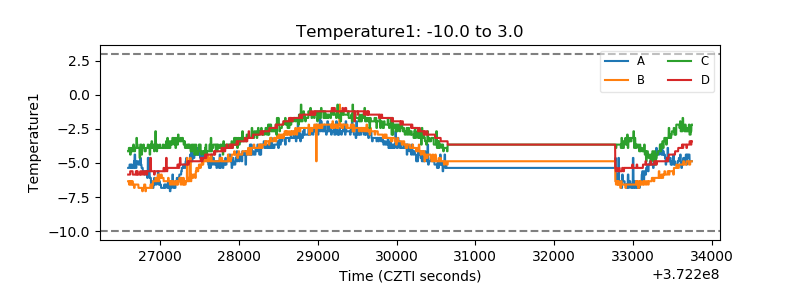 |
| Veto HV Monitor | 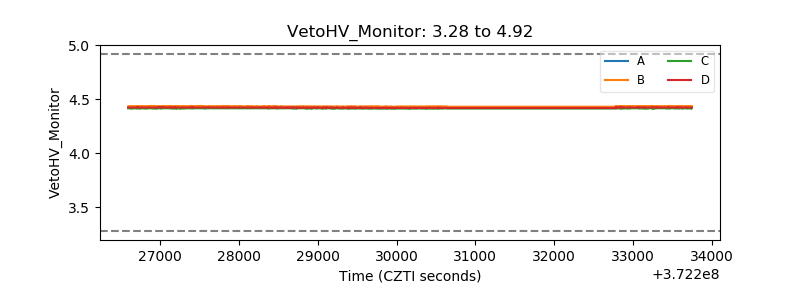 |
| Veto LLD | 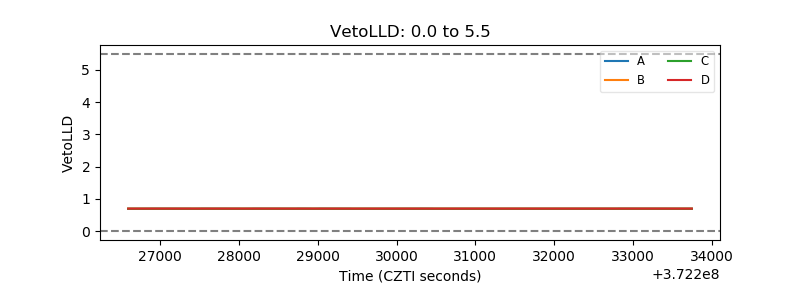 |
| Alpha Counter | 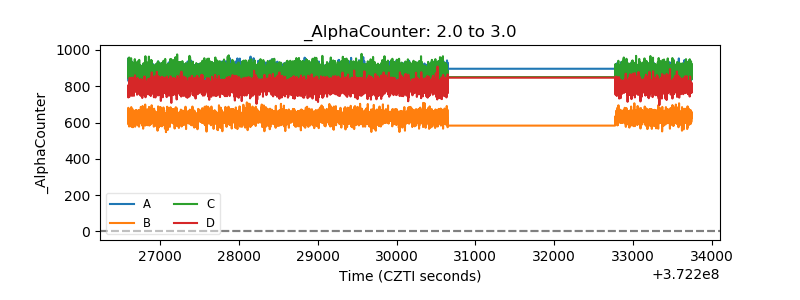 |
| _CPM_Rate | 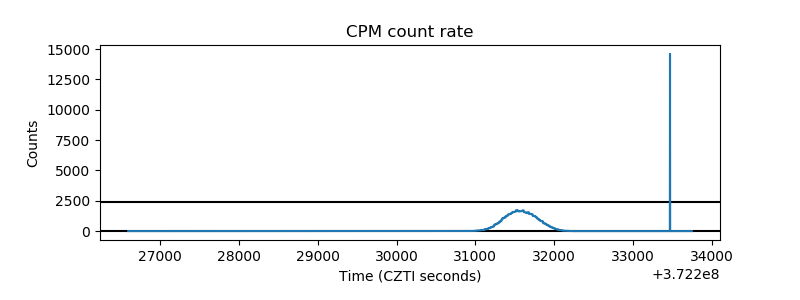 |
| CZT Counter |  |
| +2.5 Volts monitor |  |
| +5 Volts monitor |  |
| _ROLL_ROT | 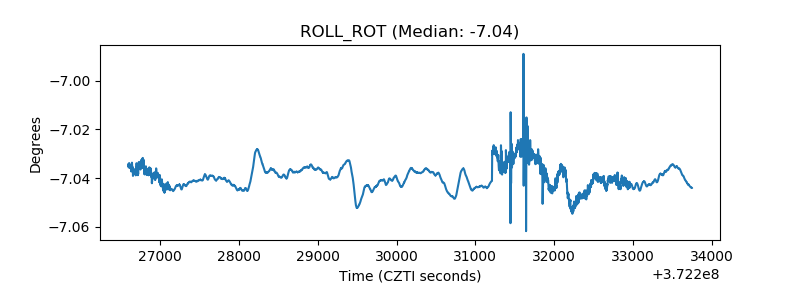 |
| _Roll_DEC | 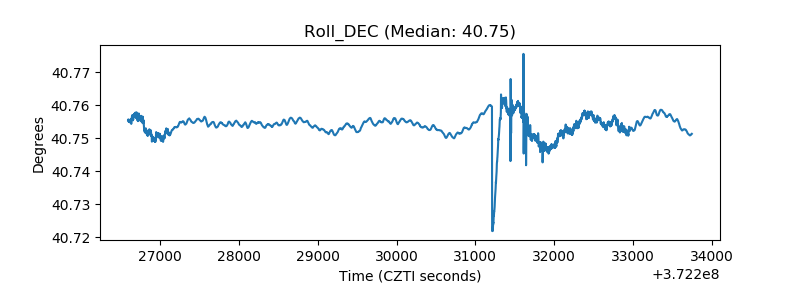 |
| _Roll_RA | 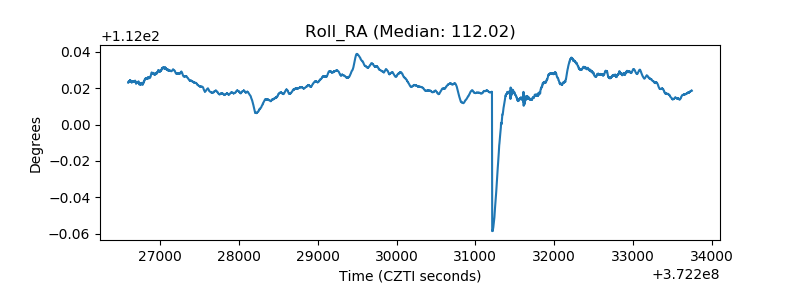 |
| Veto Counter | 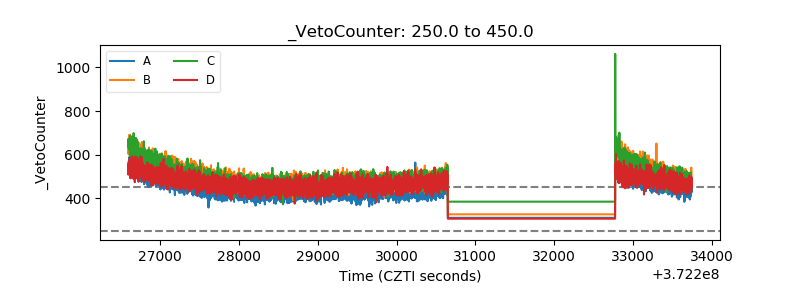 |