| Param | Original file | Final file |
|---|---|---|
| Filename | modeM0/AS1A10_057T04_9000004728_32746cztM0_level2.evt | modeM0/AS1A10_057T04_9000004728_32746cztM0_level2_quad_clean.evt |
| Size (bytes) | 426,844,800 | 59,472,000 |
| Size | 407.1 MB | 56.7 MB |
| Events in quadrant A | 2,485,324 | 363,808 |
| Events in quadrant B | 2,939,798 | 365,692 |
| Events in quadrant C | 2,519,169 | 362,405 |
| Events in quadrant D | 4,622,043 | 336,613 |
| Mode M0 | |||
|---|---|---|---|
| Quadrant | BADHDUFLAG | Total packets | Discarded packets |
| A | 0 | 10794 | 3 |
| B | 0 | 11939 | 2 |
| C | 0 | 10993 | 2 |
| D | 0 | 17567 | 2 |
| Mode M9 | |||
|---|---|---|---|
| Quadrant | BADHDUFLAG | Total packets | Discarded packets |
| A | 0 | 19 | 0 |
| B | 0 | 19 | 0 |
| C | 0 | 19 | 0 |
| D | 0 | 20 | 0 |
| Mode SS | |||
|---|---|---|---|
| Quadrant | BADHDUFLAG | Total packets | Discarded packets |
| A | 0 | 108 | 0 |
| B | 0 | 108 | 0 |
| C | 0 | 108 | 0 |
| D | 0 | 108 | 0 |
| Quadrant | Total seconds | Saturated seconds | Saturation percentage |
|---|---|---|---|
| A | 5312 | 26 | 0.489458% |
| B | 5312 | 43 | 0.809488% |
| C | 5312 | 15 | 0.282380% |
| D | 5312 | 297 | 5.591114% |
Noise dominated data is calculated using 1-second bins in cleaned event files. If a bin has >2000 counts, and if more than 50% of those come from <1% of pixels, then it is considered to be noise-dominated and hence unusable.
| Quadrant | # 1 sec bins | Bins with >0 counts | Bins with >2000 counts | High rate bins dominated by noise | Noise dominated (total time) | Noise dominated (detector-on time) | Marked lightcurve |
|---|---|---|---|---|---|---|---|
| A | 7075 | 5313 | 6 | 6 | 0.08% | 0.11% | 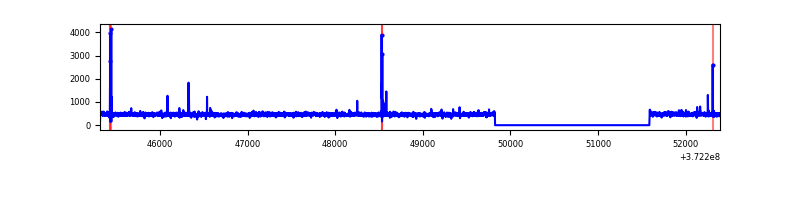 |
| B | 7075 | 5313 | 17 | 17 | 0.24% | 0.32% | 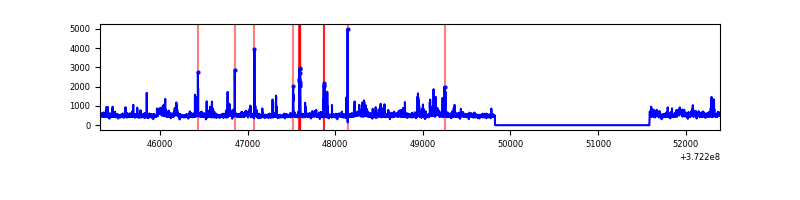 |
| C | 7075 | 5313 | 13 | 13 | 0.18% | 0.24% | 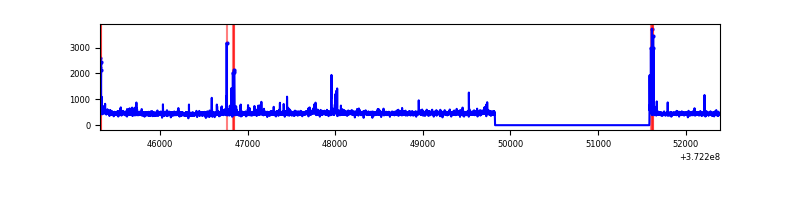 |
| D | 7075 | 5313 | 259 | 259 | 3.66% | 4.87% | 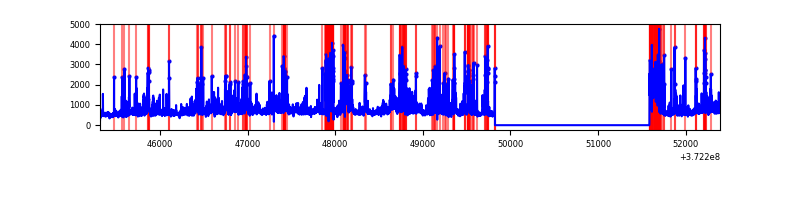 |
Top three noisy pixels from each quadrant. If the there are fewer than three noisy pixels in the level2.evt file, extra rows are filled as -1
| Pixel properties | Quadrant properties | ||||||
|---|---|---|---|---|---|---|---|
| Quadrant | DetID | PixID | Counts | Sigma | Mean | Median | Sigma |
| A | 15 | 249 | 27525 | 214.07 | 625 | 613 | 125.7 |
| A | 15 | 237 | 27345 | 212.64 | 625 | 613 | 125.7 |
| A | 13 | 254 | 9423 | 70.08 | 625 | 613 | 125.7 |
| B | 0 | 219 | 79527 | 658.5 | 626 | 612 | 119.8 |
| B | 3 | 26 | 73876 | 611.34 | 626 | 612 | 119.8 |
| B | 5 | 172 | 69128 | 571.72 | 626 | 612 | 119.8 |
| C | 0 | 10 | 52623 | 371.6 | 603 | 608 | 140.0 |
| C | 15 | 159 | 34450 | 241.77 | 603 | 608 | 140.0 |
| C | 8 | 229 | 26475 | 184.8 | 603 | 608 | 140.0 |
| D | 7 | 80 | 723310 | 4993.21 | 591 | 580 | 144.7 |
| D | 8 | 195 | 512357 | 3535.78 | 591 | 580 | 144.7 |
| D | 2 | 250 | 277332 | 1912.03 | 591 | 580 | 144.7 |
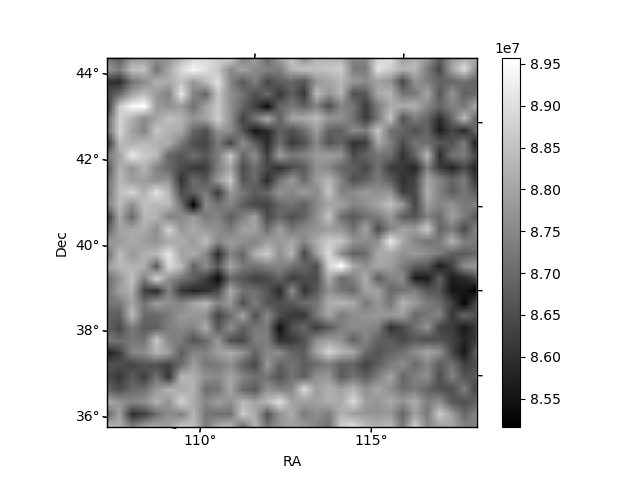
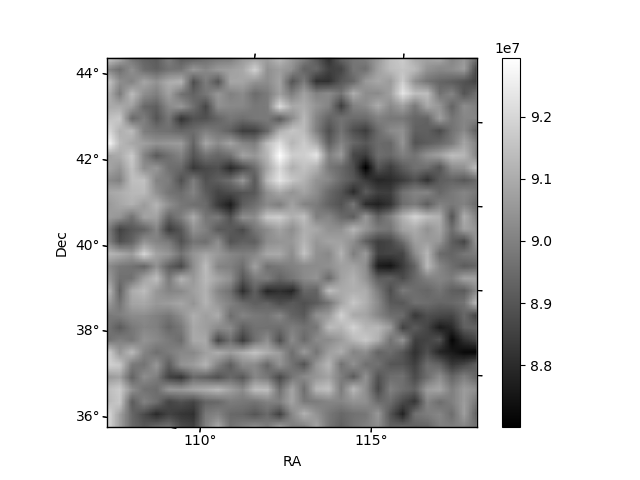
Histogram calculated using DETX and DETY for each event in the final _common_clean file
| Quadrant A |  |
 |
Quadrant B |
|---|---|---|---|
| Quadrant D | 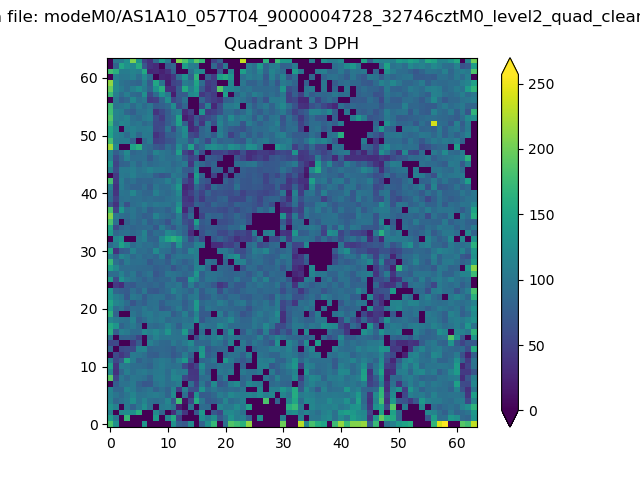 |
 |
Quadrant C |
| Plot type | Count rate plots | Images |
|---|---|---|
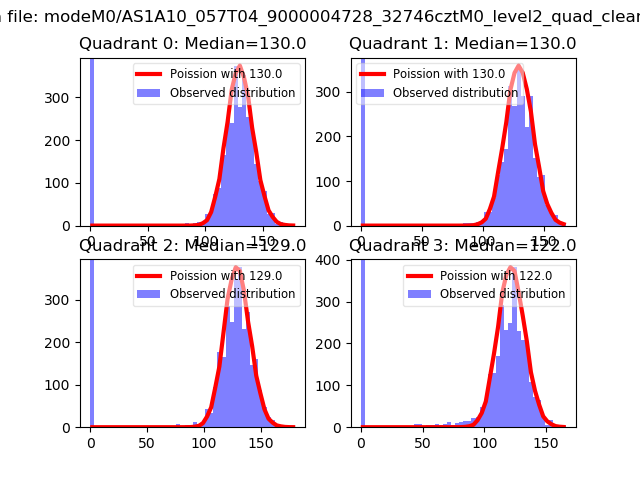
| Comparison with Poisson distribution Blue bars denote a histogram of data divided into 1 sec bins. Red curve is a Poisson curve with rate = median count rate of data. |
 |
 |
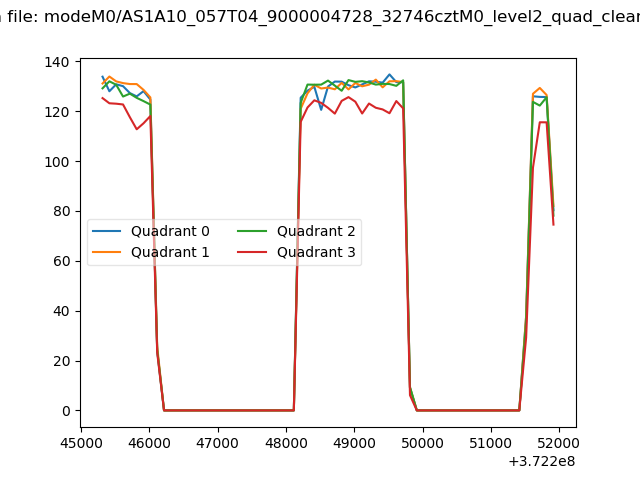
| Quadrant-wise count rates Data is divided into 100 sec bins |
 |
|
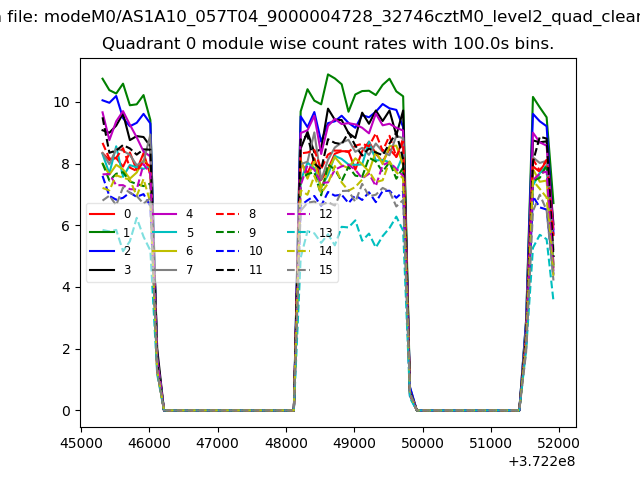
| Module-wise count rates for Quadrant A Data is divided into 100 sec bins |
 |
 |
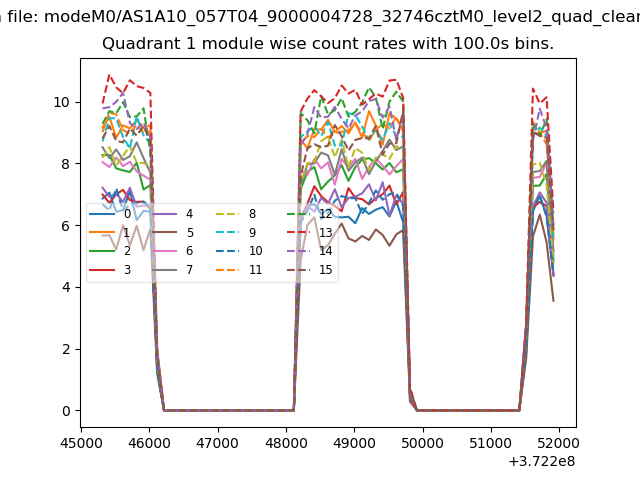
| Module-wise count rates for Quadrant B Data is divided into 100 sec bins |
 |
 |
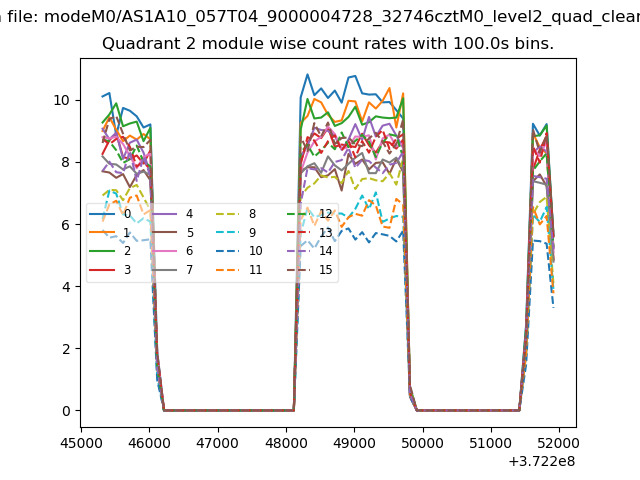
| Module-wise count rates for Quadrant C Data is divided into 100 sec bins |
 |
 |
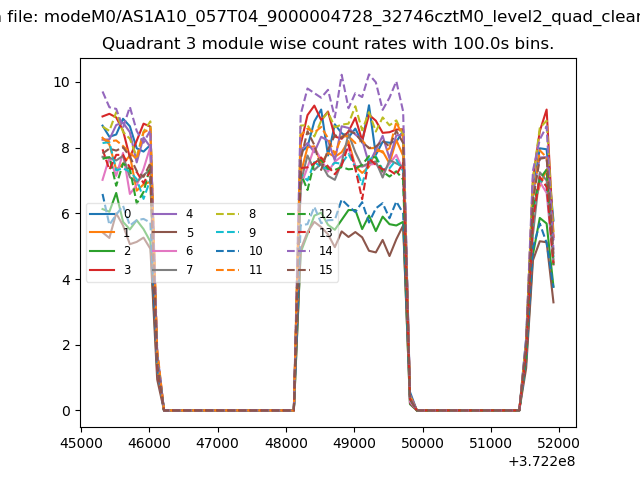
| Module-wise count rates for Quadrant D Data is divided into 100 sec bins |
 |
 |
| Parameter | Plot |
|---|---|
| CZT HV Monitor | 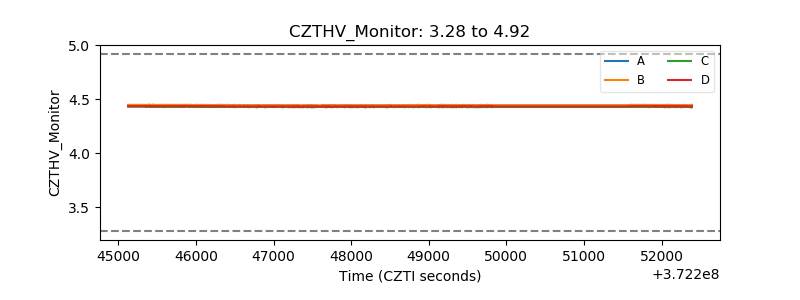 |
| D_VDD | 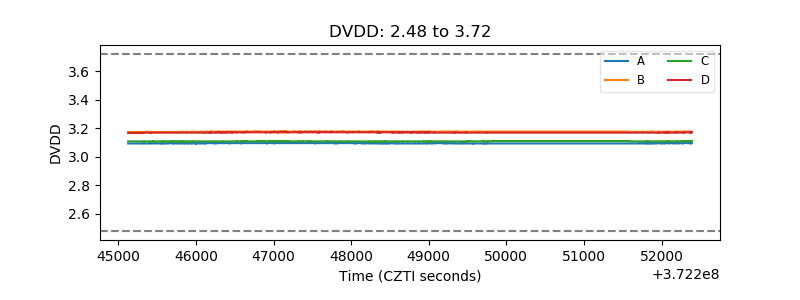 |
| Temperature 1 | 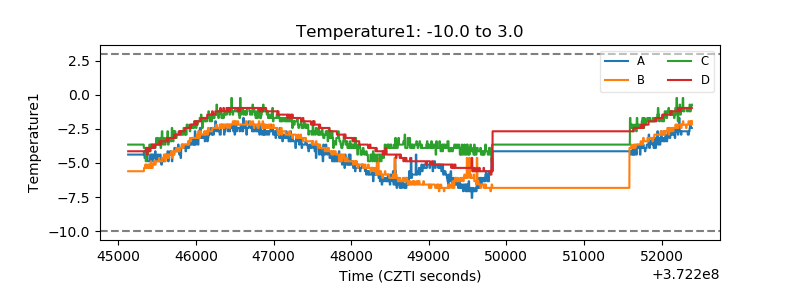 |
| Veto HV Monitor | 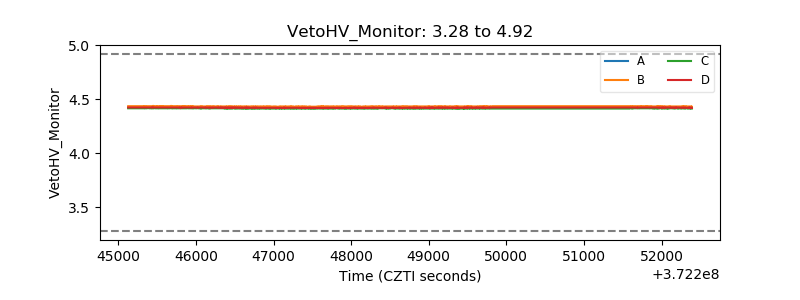 |
| Veto LLD | 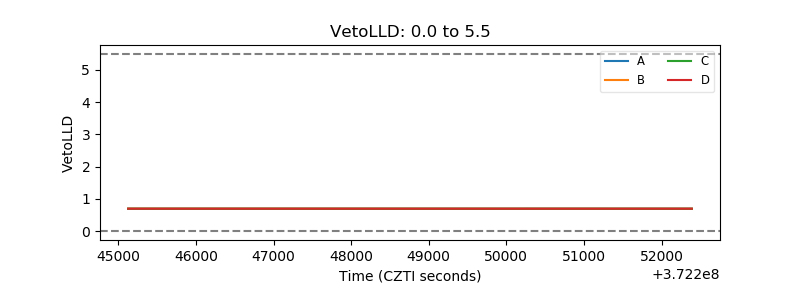 |
| Alpha Counter | 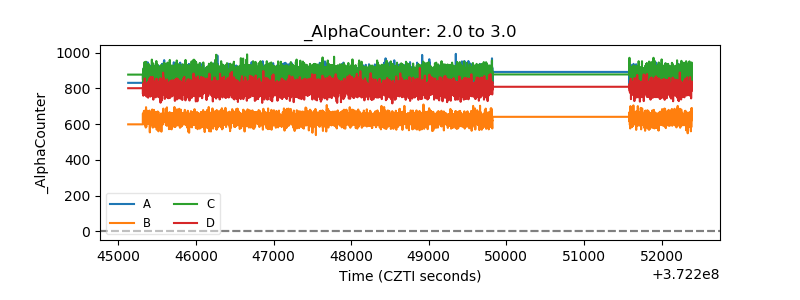 |
| _CPM_Rate | 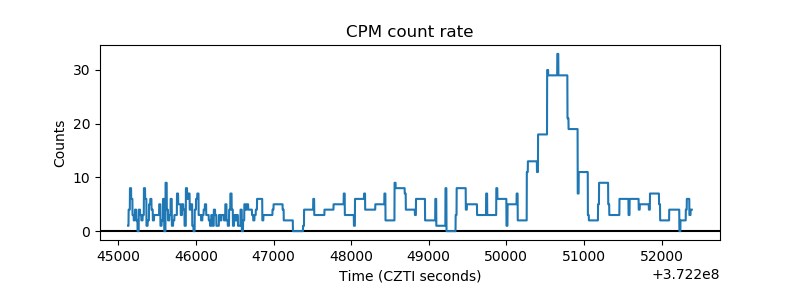 |
| CZT Counter | 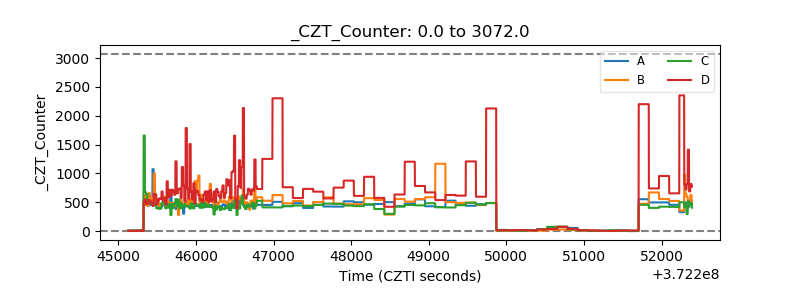 |
| +2.5 Volts monitor |  |
| +5 Volts monitor |  |
| _ROLL_ROT | 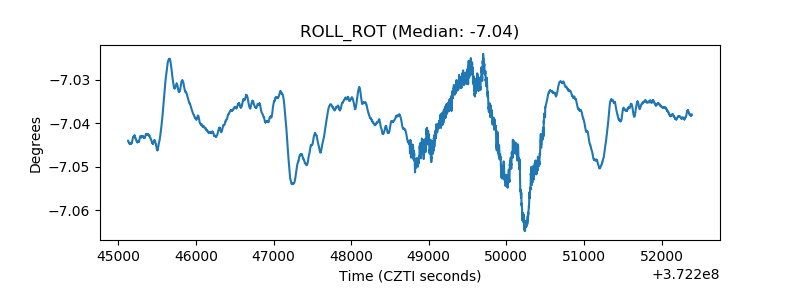 |
| _Roll_DEC | 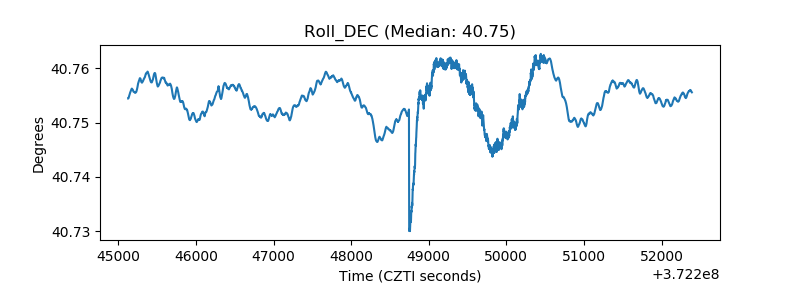 |
| _Roll_RA | 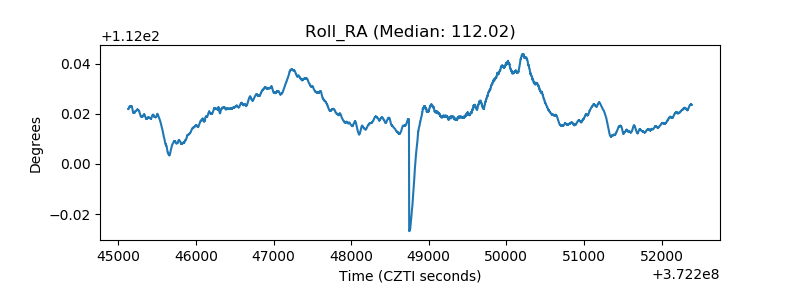 |
| Veto Counter | 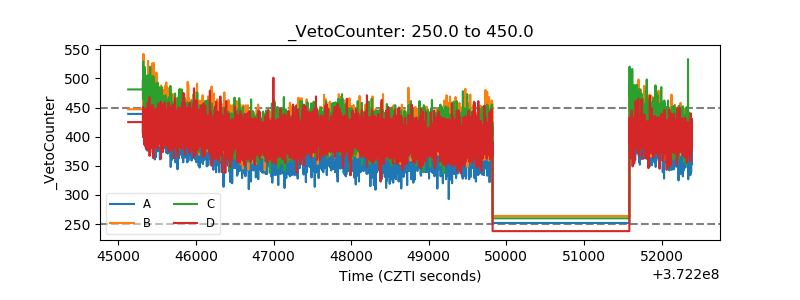 |