| Param | Original file | Final file |
|---|---|---|
| Filename | modeM0/AS1A10_057T04_9000004728_32747cztM0_level2.evt | modeM0/AS1A10_057T04_9000004728_32747cztM0_level2_quad_clean.evt |
| Size (bytes) | 495,048,960 | 58,536,000 |
| Size | 472.1 MB | 55.8 MB |
| Events in quadrant A | 3,043,099 | 347,964 |
| Events in quadrant B | 3,394,858 | 347,795 |
| Events in quadrant C | 2,778,341 | 349,443 |
| Events in quadrant D | 5,386,998 | 325,594 |
| Mode M0 | |||
|---|---|---|---|
| Quadrant | BADHDUFLAG | Total packets | Discarded packets |
| A | 0 | 12574 | 3 |
| B | 0 | 13668 | 2 |
| C | 0 | 12058 | 2 |
| D | 0 | 19919 | 2 |
| Mode M9 | |||
|---|---|---|---|
| Quadrant | BADHDUFLAG | Total packets | Discarded packets |
| A | 0 | 22 | 0 |
| B | 0 | 22 | 0 |
| C | 0 | 22 | 0 |
| D | 0 | 23 | 0 |
| Mode SS | |||
|---|---|---|---|
| Quadrant | BADHDUFLAG | Total packets | Discarded packets |
| A | 0 | 116 | 0 |
| B | 0 | 116 | 0 |
| C | 0 | 116 | 0 |
| D | 0 | 116 | 0 |
| Quadrant | Total seconds | Saturated seconds | Saturation percentage |
|---|---|---|---|
| A | 5742 | 75 | 1.306165% |
| B | 5742 | 82 | 1.428074% |
| C | 5742 | 38 | 0.661790% |
| D | 5742 | 523 | 9.108325% |
Noise dominated data is calculated using 1-second bins in cleaned event files. If a bin has >2000 counts, and if more than 50% of those come from <1% of pixels, then it is considered to be noise-dominated and hence unusable.
| Quadrant | # 1 sec bins | Bins with >0 counts | Bins with >2000 counts | High rate bins dominated by noise | Noise dominated (total time) | Noise dominated (detector-on time) | Marked lightcurve |
|---|---|---|---|---|---|---|---|
| A | 7175 | 5743 | 51 | 51 | 0.71% | 0.89% | 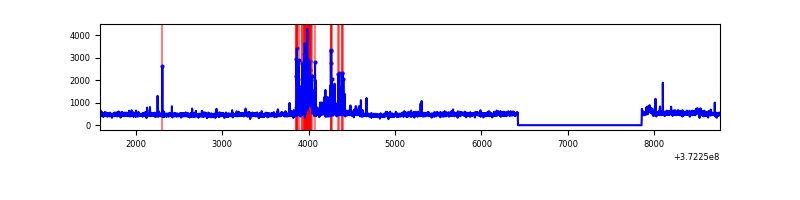 |
| B | 7175 | 5743 | 50 | 50 | 0.70% | 0.87% | 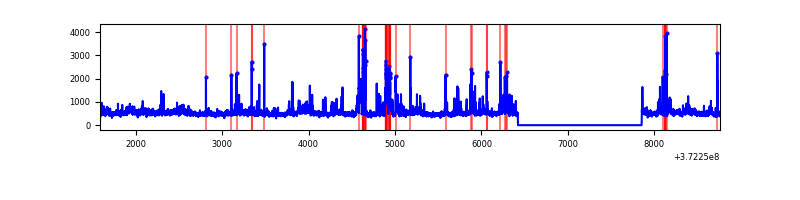 |
| C | 7175 | 5743 | 24 | 24 | 0.33% | 0.42% | 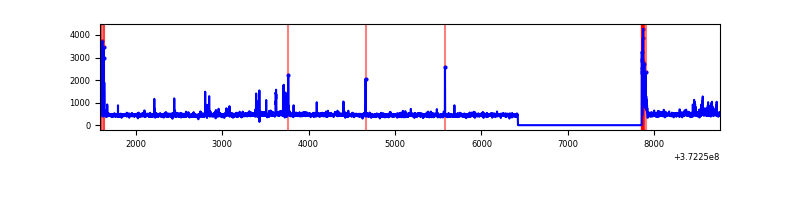 |
| D | 7175 | 5743 | 437 | 437 | 6.09% | 7.61% | 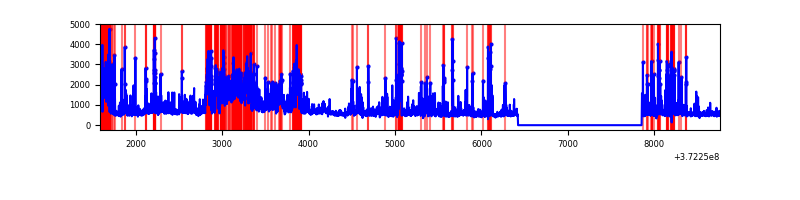 |
Top three noisy pixels from each quadrant. If the there are fewer than three noisy pixels in the level2.evt file, extra rows are filled as -1
| Pixel properties | Quadrant properties | ||||||
|---|---|---|---|---|---|---|---|
| Quadrant | DetID | PixID | Counts | Sigma | Mean | Median | Sigma |
| A | 15 | 249 | 424406 | 3155.83 | 667 | 653 | 134.3 |
| A | 15 | 237 | 12918 | 91.34 | 667 | 653 | 134.3 |
| A | 13 | 254 | 10465 | 73.07 | 667 | 653 | 134.3 |
| B | 12 | 1 | 272202 | 2117.93 | 668 | 653 | 128.2 |
| B | 3 | 26 | 113065 | 876.75 | 668 | 653 | 128.2 |
| B | 0 | 219 | 107430 | 832.8 | 668 | 653 | 128.2 |
| C | 0 | 10 | 101651 | 674.88 | 647 | 650 | 149.7 |
| C | 8 | 229 | 82779 | 548.78 | 647 | 650 | 149.7 |
| C | 8 | 79 | 24559 | 159.76 | 647 | 650 | 149.7 |
| D | 3 | 13 | 680910 | 4395.58 | 628 | 612 | 154.8 |
| D | 8 | 195 | 525381 | 3390.66 | 628 | 612 | 154.8 |
| D | 2 | 250 | 354541 | 2286.82 | 628 | 612 | 154.8 |
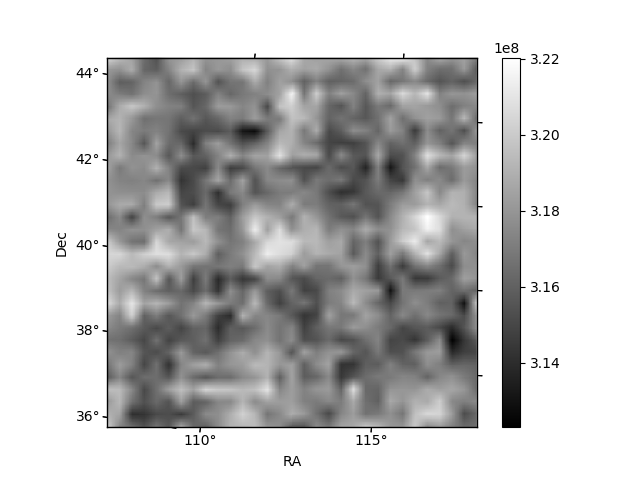
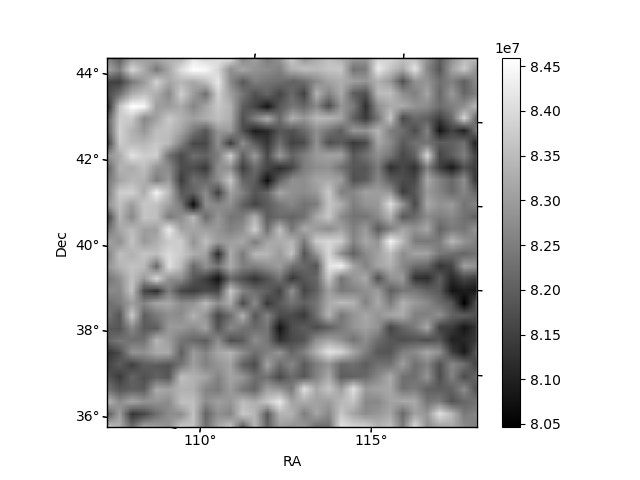
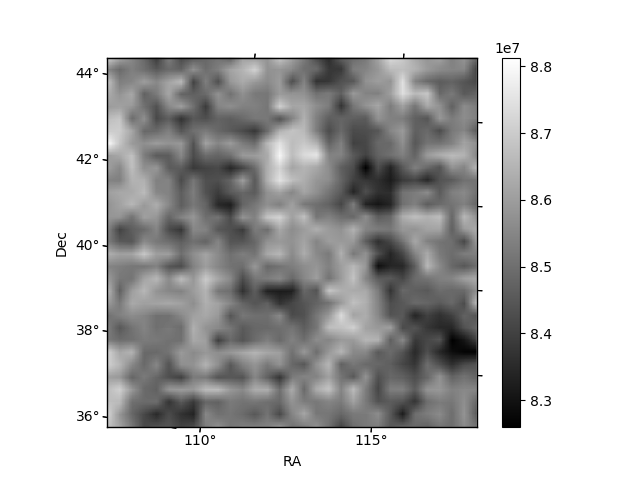
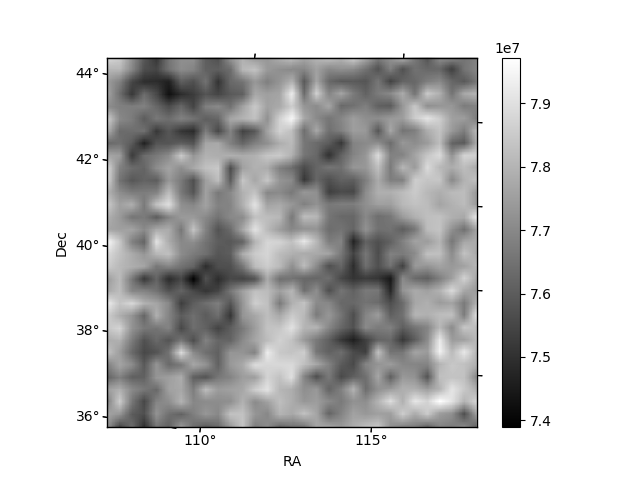
Histogram calculated using DETX and DETY for each event in the final _common_clean file
| Quadrant A | 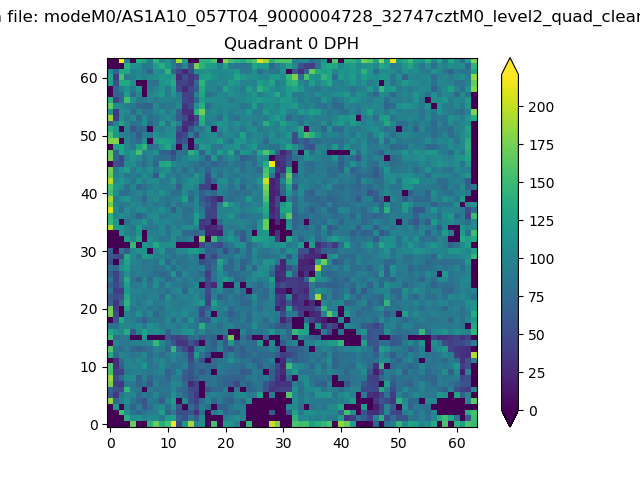 |
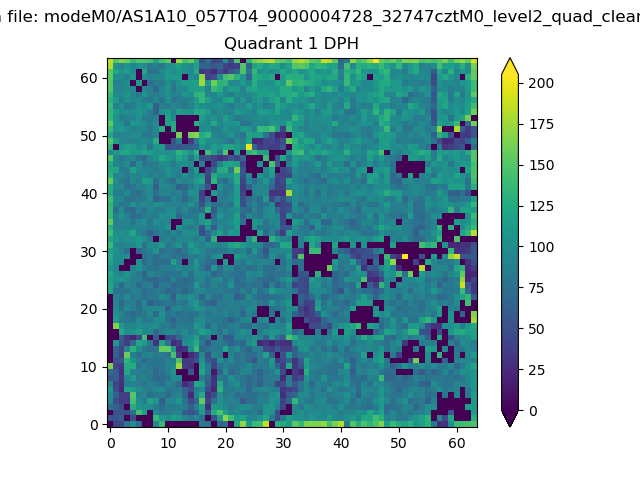 |
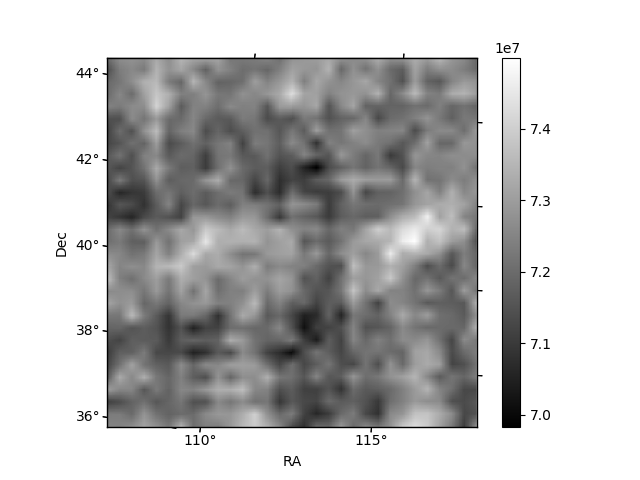
Quadrant B |
|---|---|---|---|
| Quadrant D |  |
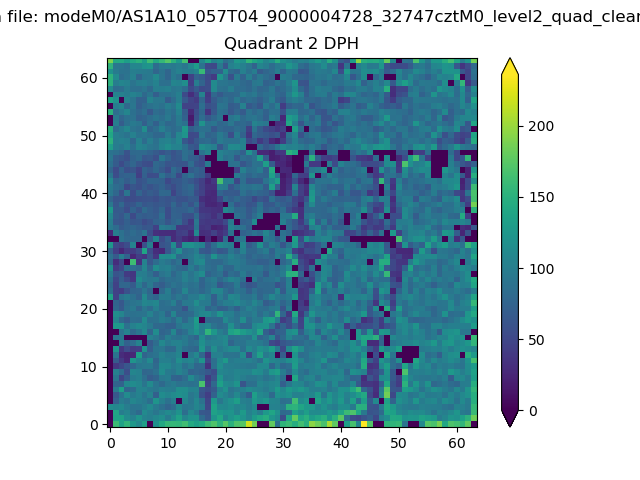 |
Quadrant C |
| Plot type | Count rate plots | Images |
|---|---|---|
| Comparison with Poisson distribution Blue bars denote a histogram of data divided into 1 sec bins. Red curve is a Poisson curve with rate = median count rate of data. |
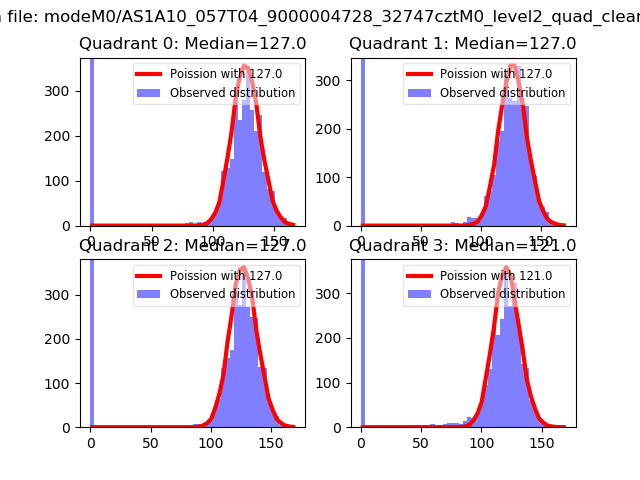 |
 |
| Quadrant-wise count rates Data is divided into 100 sec bins |
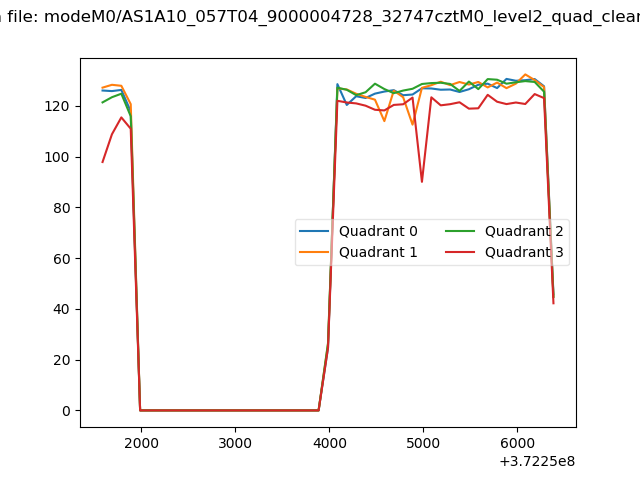 |
|
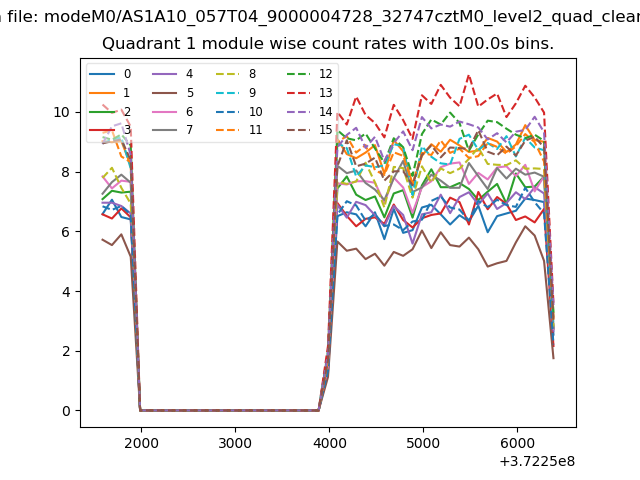
| Module-wise count rates for Quadrant A Data is divided into 100 sec bins |
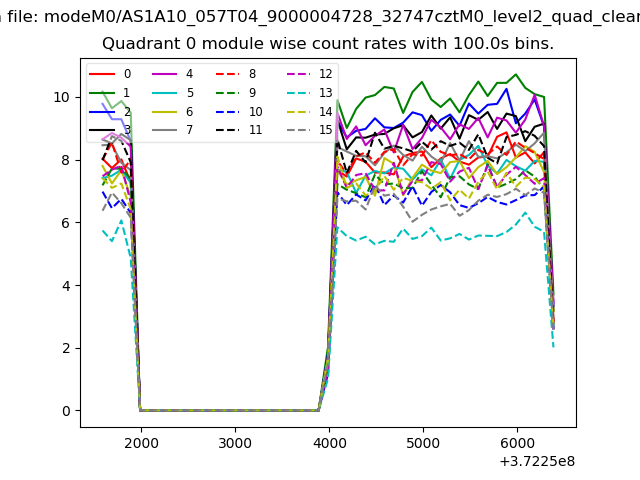 |
 |
| Module-wise count rates for Quadrant B Data is divided into 100 sec bins |
 |
 |
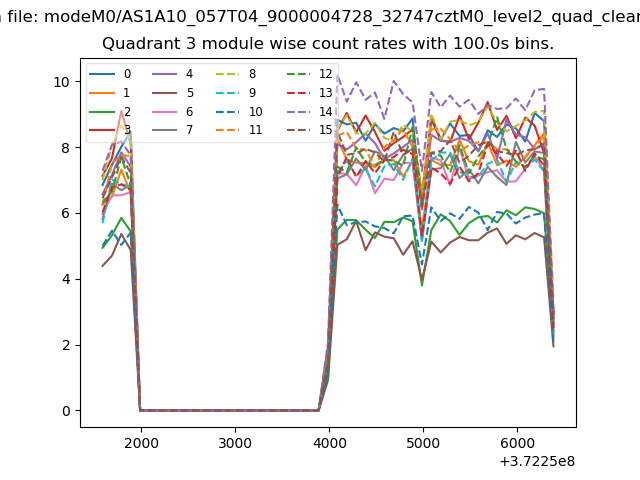
| Module-wise count rates for Quadrant C Data is divided into 100 sec bins |
 |
 |
| Module-wise count rates for Quadrant D Data is divided into 100 sec bins |
 |
 |
| Parameter | Plot |
|---|---|
| CZT HV Monitor |  |
| D_VDD | 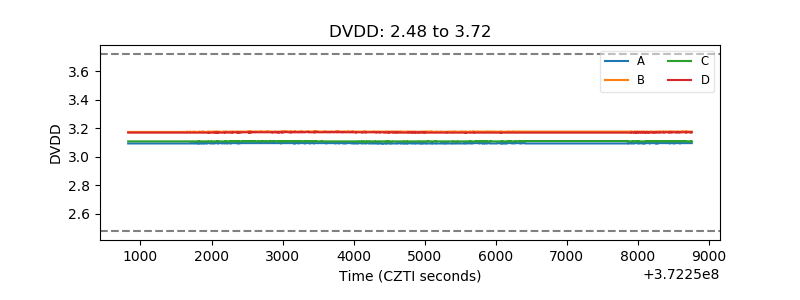 |
| Temperature 1 | 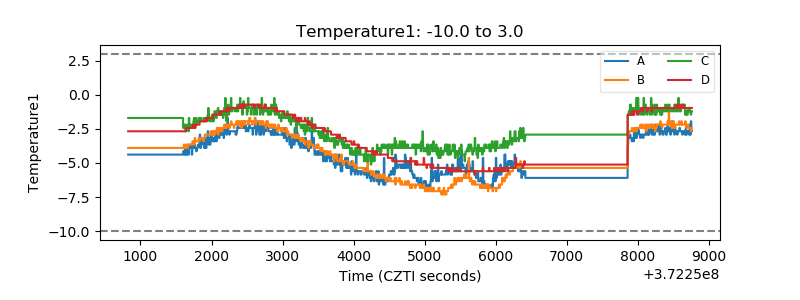 |
| Veto HV Monitor | 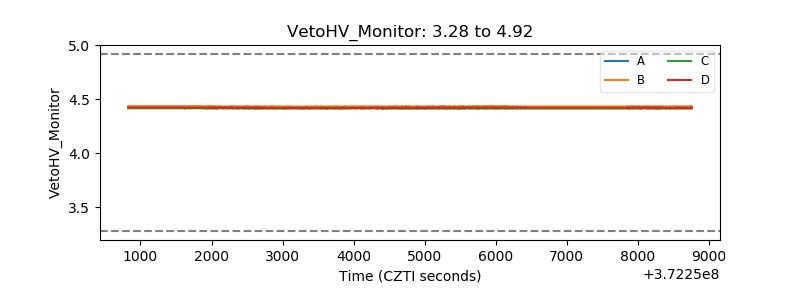 |
| Veto LLD | 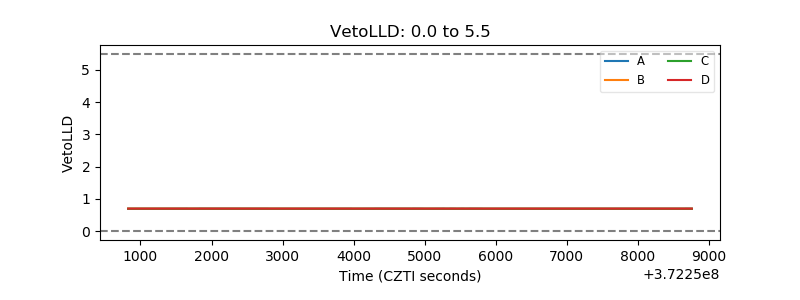 |
| Alpha Counter | 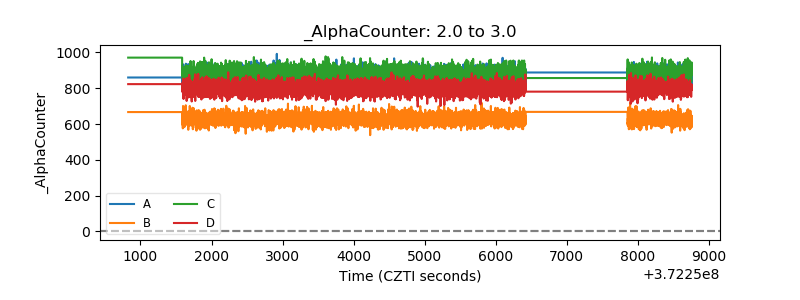 |
| _CPM_Rate | 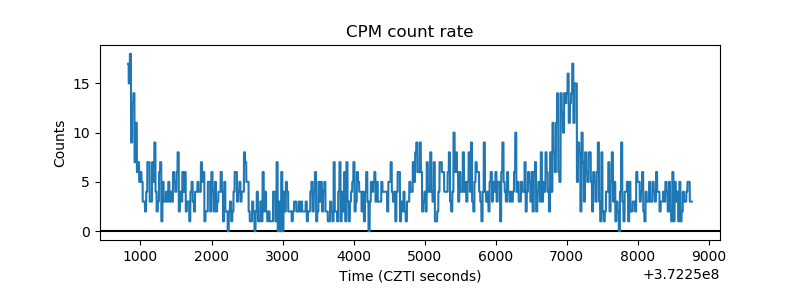 |
| CZT Counter | 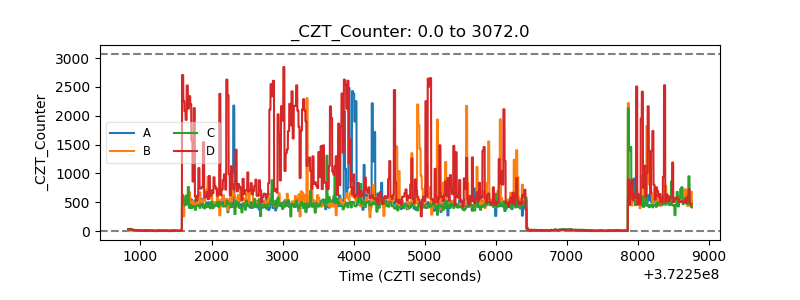 |
| +2.5 Volts monitor |  |
| +5 Volts monitor |  |
| _ROLL_ROT | 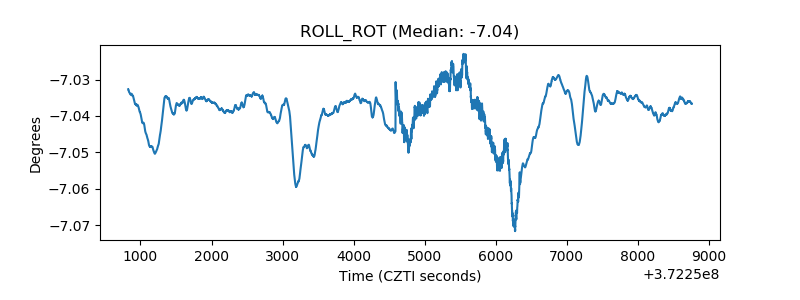 |
| _Roll_DEC | 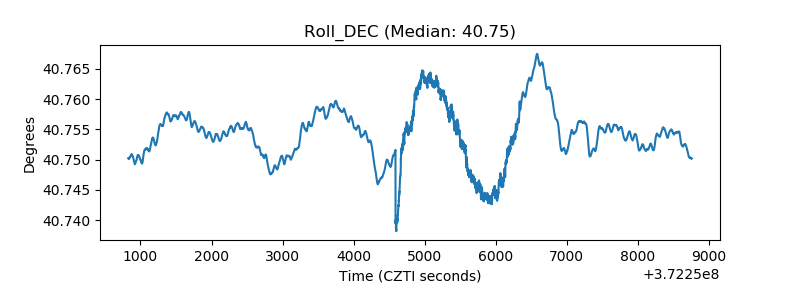 |
| _Roll_RA | 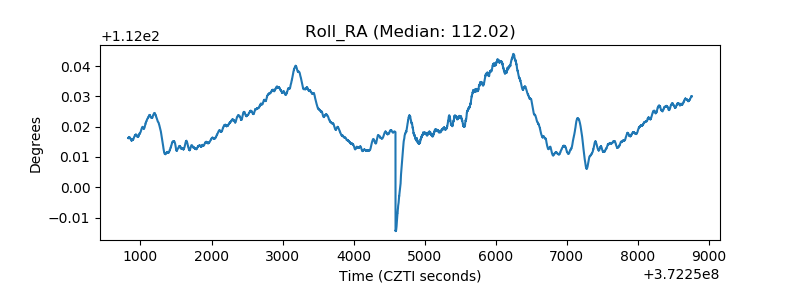 |
| Veto Counter |  |