| Param | Original file | Final file |
|---|---|---|
| Filename | modeM0/AS1A10_057T04_9000004728_32752cztM0_level2.evt | modeM0/AS1A10_057T04_9000004728_32752cztM0_level2_quad_clean.evt |
| Size (bytes) | 422,519,040 | 87,157,440 |
| Size | 402.9 MB | 83.1 MB |
| Events in quadrant A | 2,548,580 | 572,079 |
| Events in quadrant B | 3,339,039 | 568,609 |
| Events in quadrant C | 2,652,778 | 576,432 |
| Events in quadrant D | 3,883,260 | 538,787 |
| Mode M0 | |||
|---|---|---|---|
| Quadrant | BADHDUFLAG | Total packets | Discarded packets |
| A | 0 | 11180 | 3 |
| B | 0 | 13669 | 2 |
| C | 0 | 11561 | 2 |
| D | 0 | 15256 | 2 |
| Mode M9 | |||
|---|---|---|---|
| Quadrant | BADHDUFLAG | Total packets | Discarded packets |
| A | 0 | 24 | 0 |
| B | 0 | 24 | 0 |
| C | 0 | 24 | 0 |
| D | 0 | 25 | 0 |
| Mode SS | |||
|---|---|---|---|
| Quadrant | BADHDUFLAG | Total packets | Discarded packets |
| A | 0 | 112 | 0 |
| B | 0 | 112 | 0 |
| C | 0 | 112 | 0 |
| D | 0 | 112 | 0 |
| Quadrant | Total seconds | Saturated seconds | Saturation percentage |
|---|---|---|---|
| A | 5478 | 7 | 0.127784% |
| B | 5478 | 119 | 2.172326% |
| C | 5478 | 54 | 0.985761% |
| D | 5478 | 214 | 3.906535% |
Noise dominated data is calculated using 1-second bins in cleaned event files. If a bin has >2000 counts, and if more than 50% of those come from <1% of pixels, then it is considered to be noise-dominated and hence unusable.
| Quadrant | # 1 sec bins | Bins with >0 counts | Bins with >2000 counts | High rate bins dominated by noise | Noise dominated (total time) | Noise dominated (detector-on time) | Marked lightcurve |
|---|---|---|---|---|---|---|---|
| A | 7091 | 5479 | 1 | 1 | 0.01% | 0.02% | 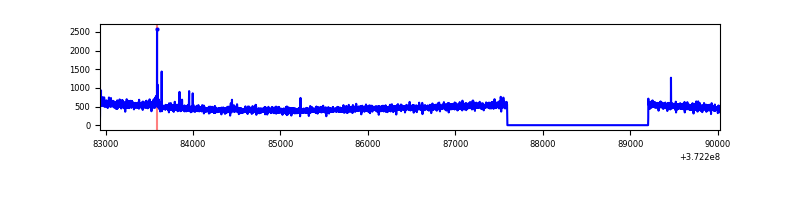 |
| B | 7091 | 5479 | 84 | 84 | 1.18% | 1.53% | 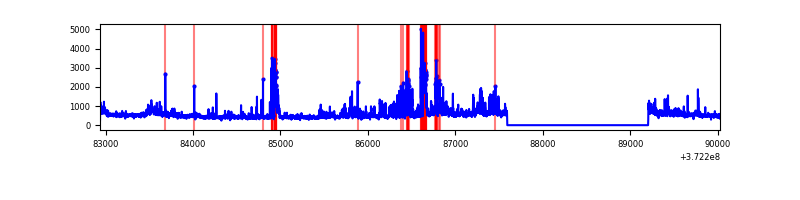 |
| C | 7091 | 5479 | 32 | 32 | 0.45% | 0.58% | 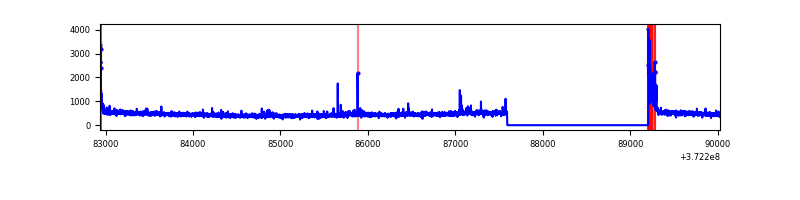 |
| D | 7091 | 5479 | 169 | 169 | 2.38% | 3.08% | 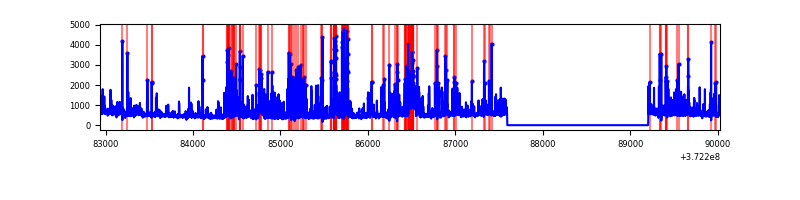 |
Top three noisy pixels from each quadrant. If the there are fewer than three noisy pixels in the level2.evt file, extra rows are filled as -1
| Pixel properties | Quadrant properties | ||||||
|---|---|---|---|---|---|---|---|
| Quadrant | DetID | PixID | Counts | Sigma | Mean | Median | Sigma |
| A | 15 | 249 | 64272 | 495.16 | 636 | 623 | 128.5 |
| A | 13 | 254 | 10021 | 73.11 | 636 | 623 | 128.5 |
| A | 13 | 6 | 9423 | 68.46 | 636 | 623 | 128.5 |
| B | 12 | 1 | 221495 | 1817.48 | 635 | 621 | 121.5 |
| B | 4 | 251 | 204569 | 1678.2 | 635 | 621 | 121.5 |
| B | 3 | 26 | 191806 | 1573.18 | 635 | 621 | 121.5 |
| C | 0 | 10 | 143621 | 989.78 | 620 | 625 | 144.5 |
| C | 8 | 229 | 38239 | 260.35 | 620 | 625 | 144.5 |
| C | 15 | 159 | 13333 | 87.96 | 620 | 625 | 144.5 |
| D | 7 | 80 | 457220 | 2924.19 | 605 | 591 | 156.2 |
| D | 2 | 250 | 418215 | 2674.41 | 605 | 591 | 156.2 |
| D | 12 | 6 | 243728 | 1557.02 | 605 | 591 | 156.2 |
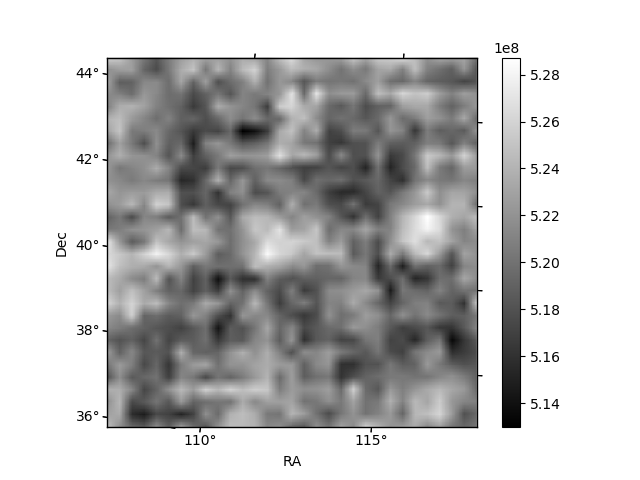
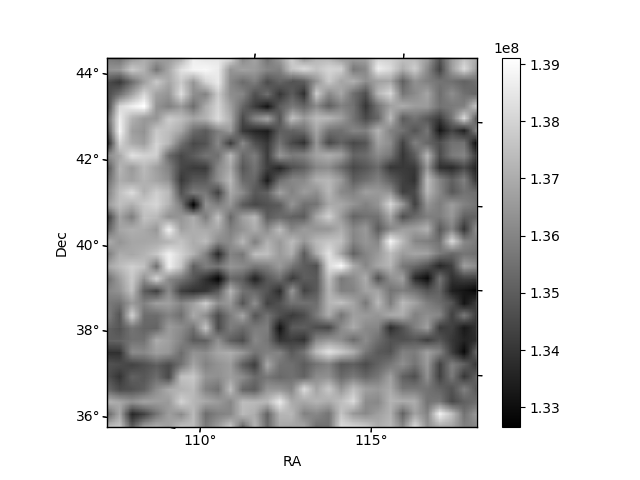
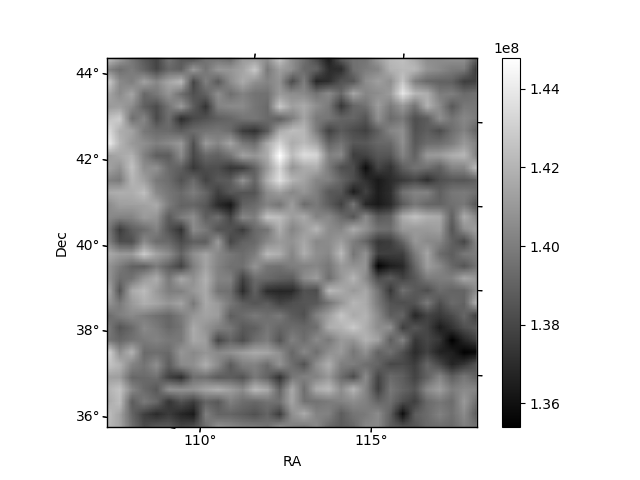
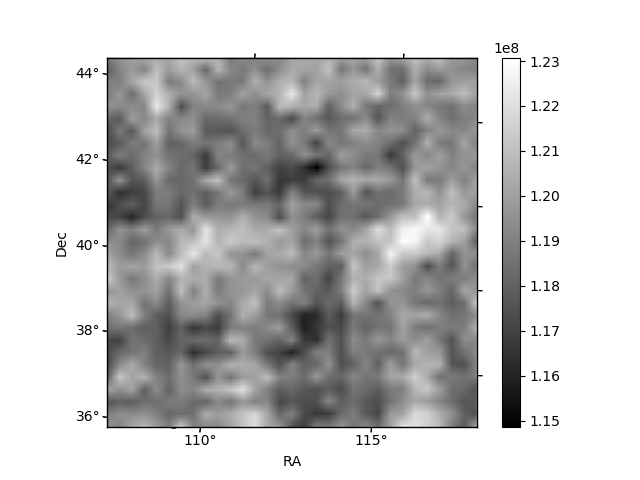
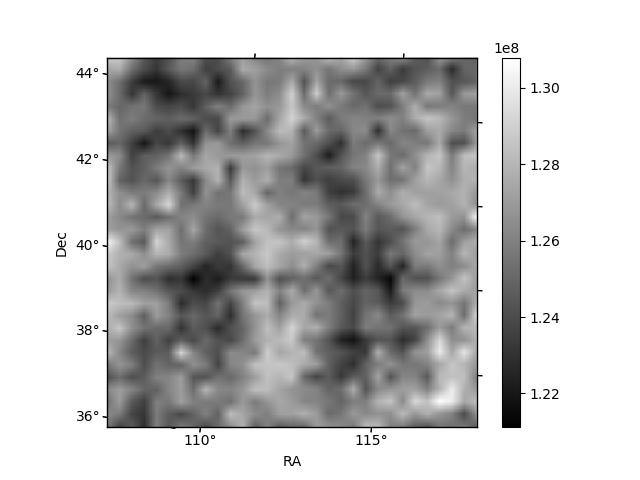
Histogram calculated using DETX and DETY for each event in the final _common_clean file
| Quadrant A | 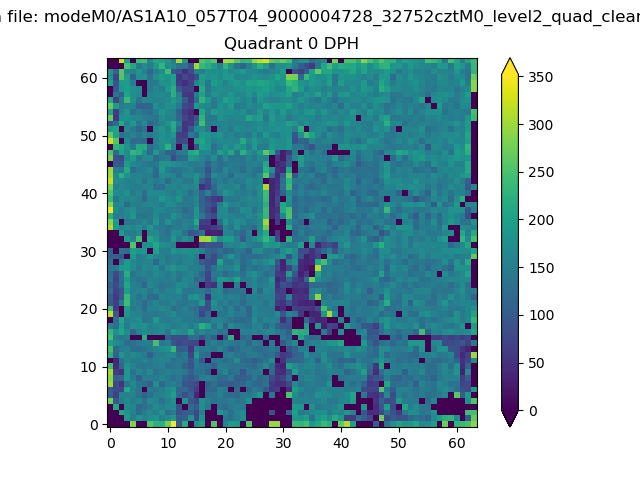 |
 |
Quadrant B |
|---|---|---|---|
| Quadrant D | 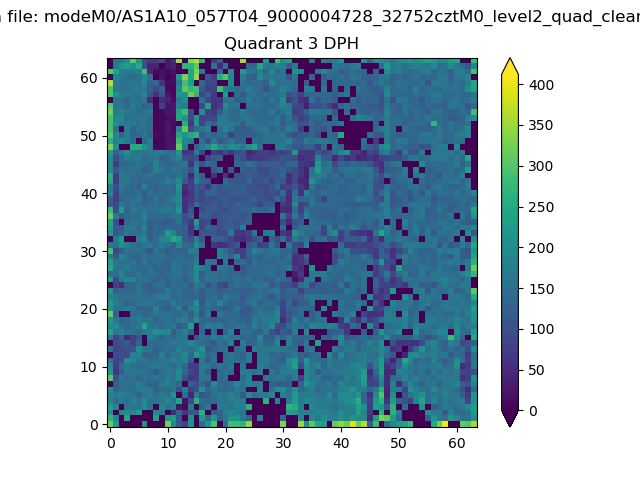 |
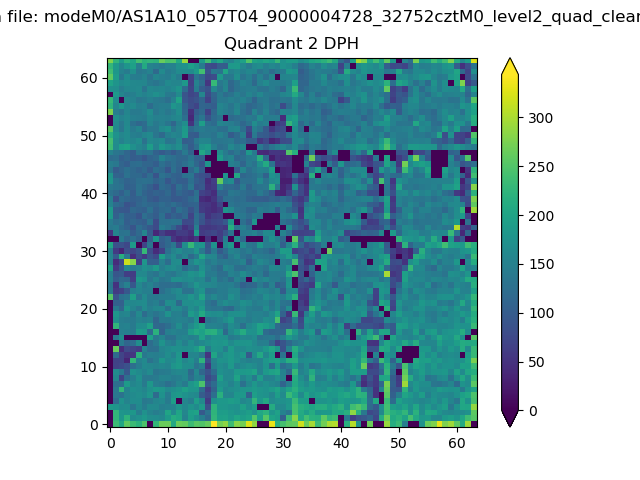 |
Quadrant C |
| Plot type | Count rate plots | Images |
|---|---|---|
| Comparison with Poisson distribution Blue bars denote a histogram of data divided into 1 sec bins. Red curve is a Poisson curve with rate = median count rate of data. |
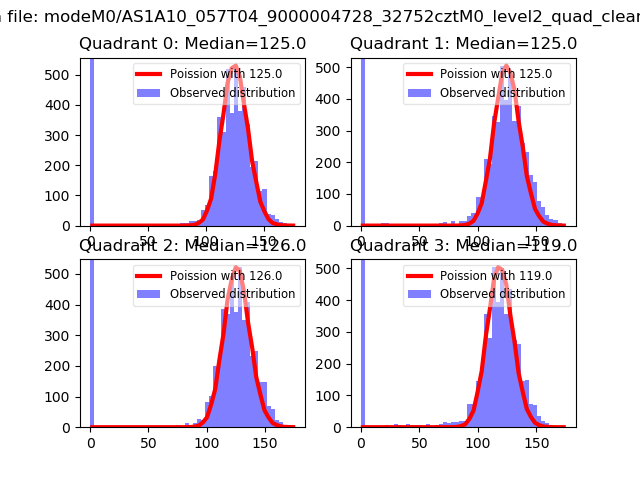 |
 |
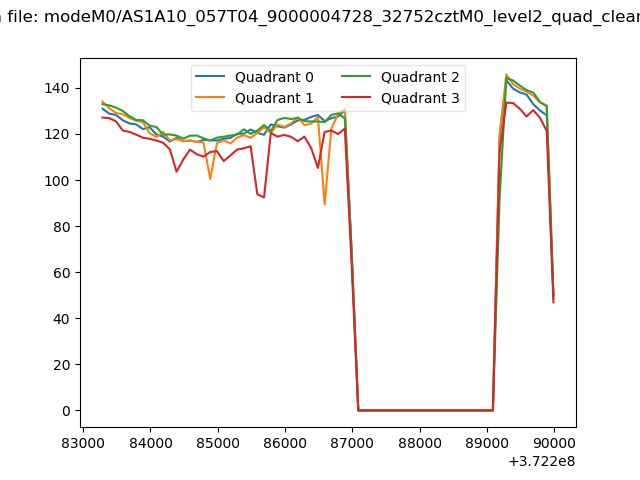
| Quadrant-wise count rates Data is divided into 100 sec bins |
 |
|
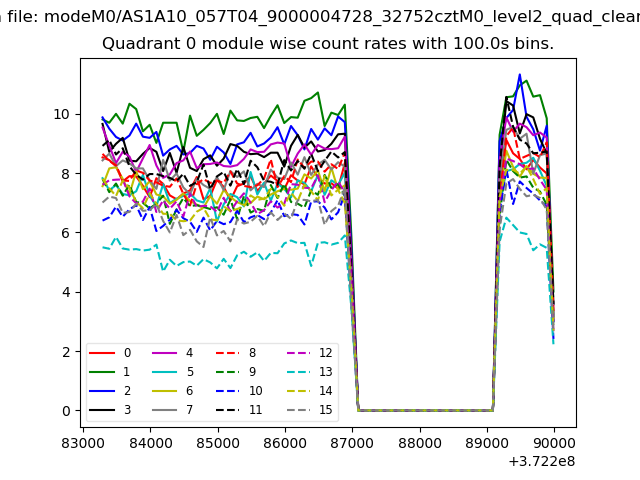
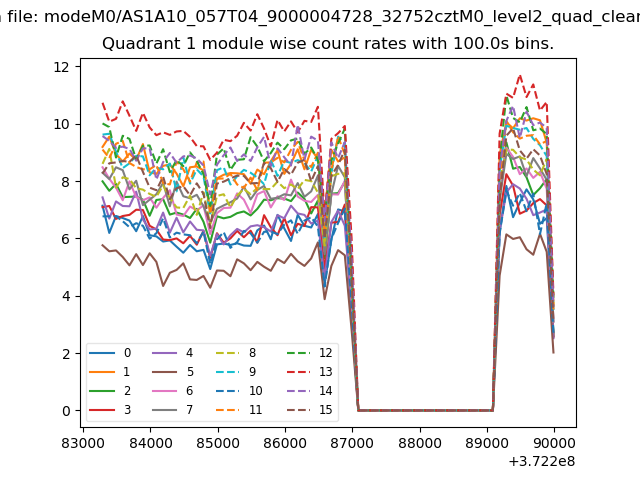
| Module-wise count rates for Quadrant A Data is divided into 100 sec bins |
 |
 |
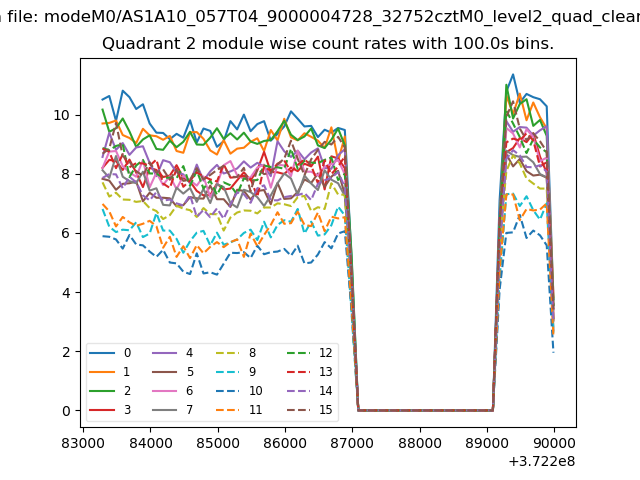
| Module-wise count rates for Quadrant B Data is divided into 100 sec bins |
 |
 |
| Module-wise count rates for Quadrant C Data is divided into 100 sec bins |
 |
 |
| Module-wise count rates for Quadrant D Data is divided into 100 sec bins |
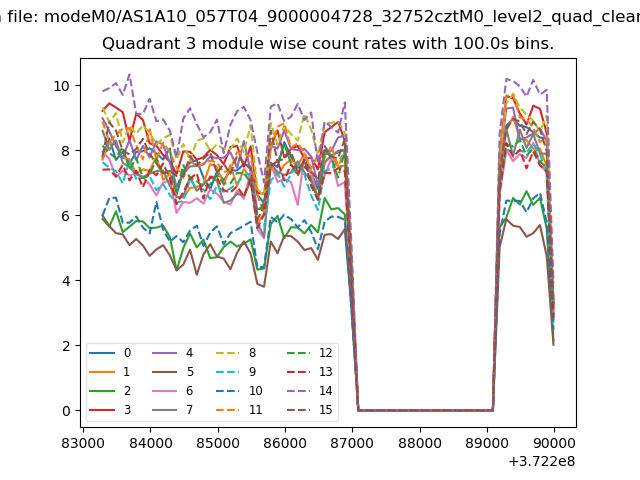 |
 |
| Parameter | Plot |
|---|---|
| CZT HV Monitor | 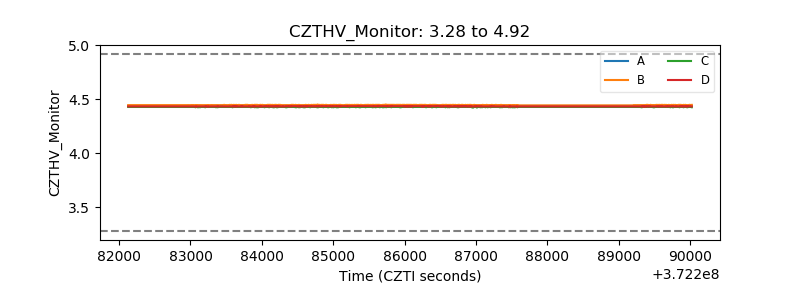 |
| D_VDD | 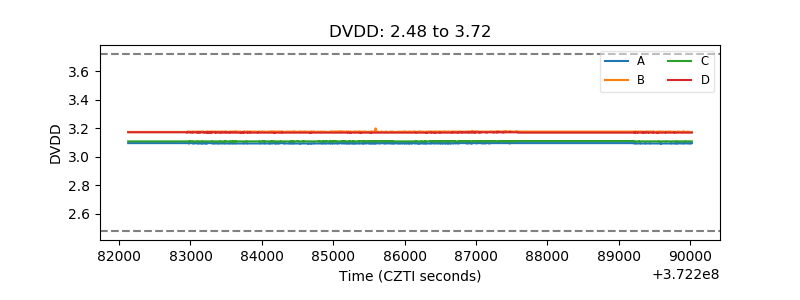 |
| Temperature 1 | 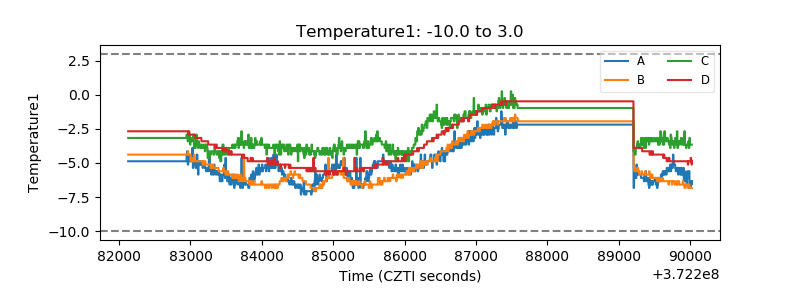 |
| Veto HV Monitor | 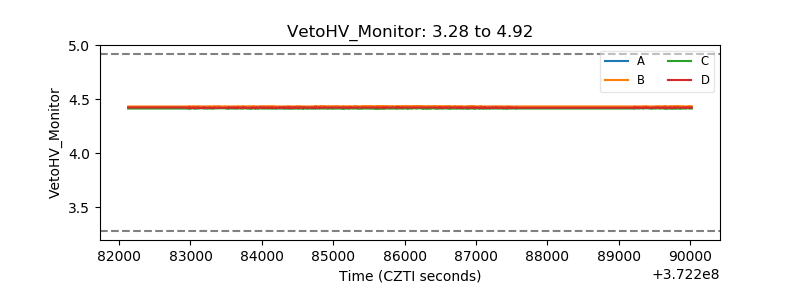 |
| Veto LLD | 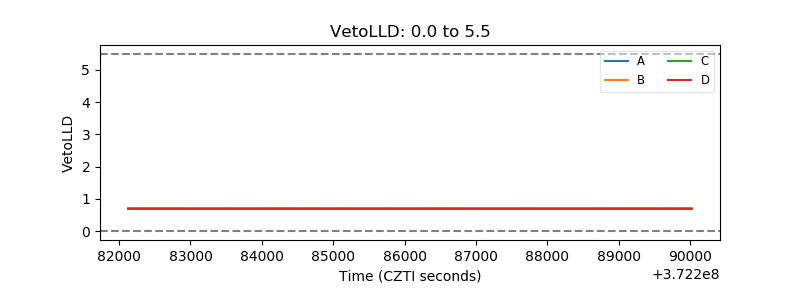 |
| Alpha Counter | 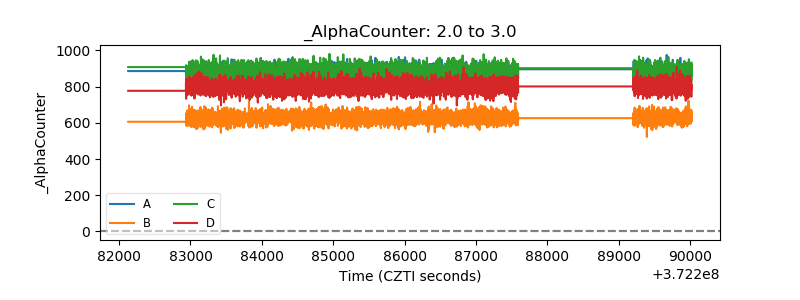 |
| _CPM_Rate | 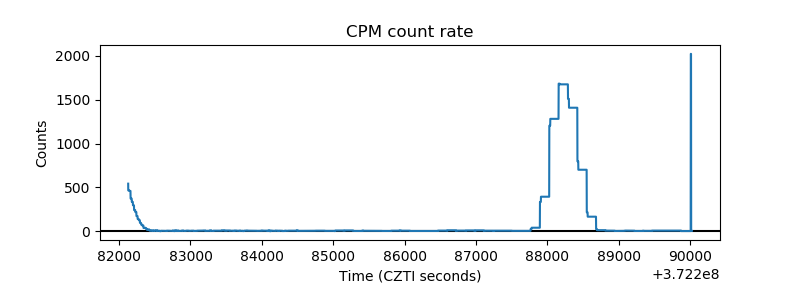 |
| CZT Counter | 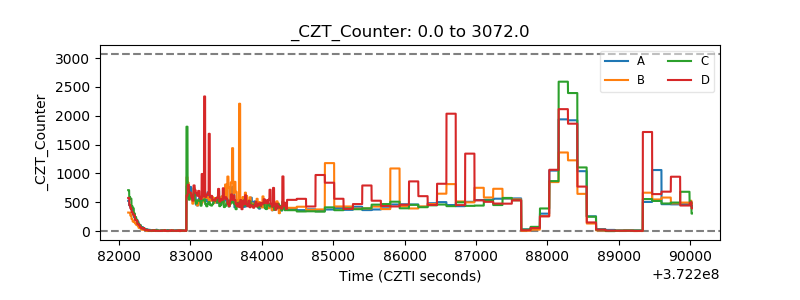 |
| +2.5 Volts monitor |  |
| +5 Volts monitor |  |
| _ROLL_ROT | 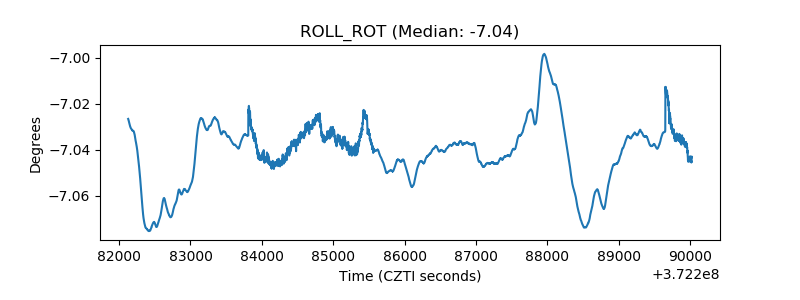 |
| _Roll_DEC | 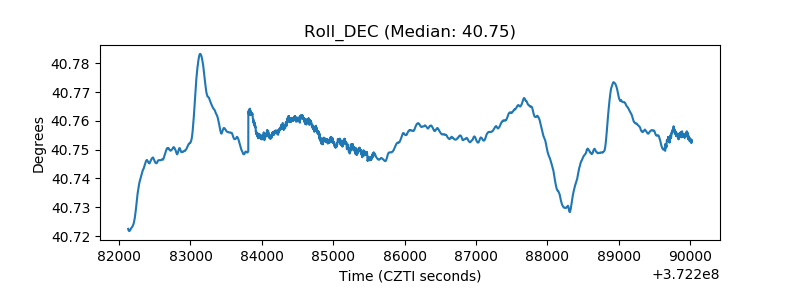 |
| _Roll_RA | 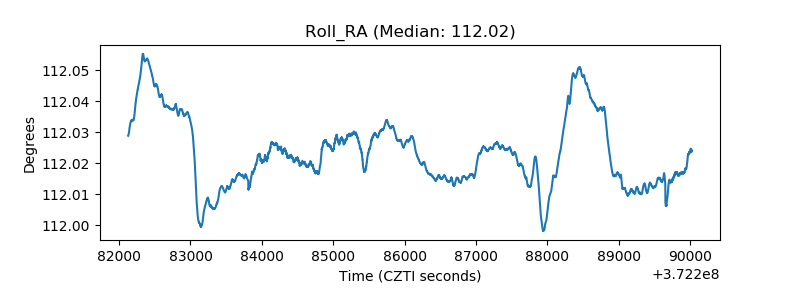 |
| Veto Counter | 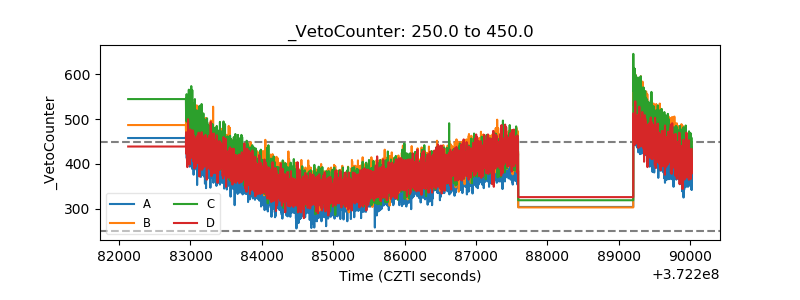 |