| Param | Original file | Final file |
|---|---|---|
| Filename | modeM0/AS1A10_057T04_9000004728_32754cztM0_level2.evt | modeM0/AS1A10_057T04_9000004728_32754cztM0_level2_quad_clean.evt |
| Size (bytes) | 395,055,360 | 87,186,240 |
| Size | 376.8 MB | 83.1 MB |
| Events in quadrant A | 2,415,980 | 575,551 |
| Events in quadrant B | 2,874,740 | 580,645 |
| Events in quadrant C | 2,581,269 | 576,090 |
| Events in quadrant D | 3,734,309 | 539,273 |
| Mode M0 | |||
|---|---|---|---|
| Quadrant | BADHDUFLAG | Total packets | Discarded packets |
| A | 0 | 10609 | 3 |
| B | 0 | 12027 | 2 |
| C | 0 | 11269 | 2 |
| D | 0 | 14767 | 2 |
| Mode M9 | |||
|---|---|---|---|
| Quadrant | BADHDUFLAG | Total packets | Discarded packets |
| A | 0 | 23 | 0 |
| B | 0 | 23 | 0 |
| C | 0 | 23 | 0 |
| D | 0 | 24 | 0 |
| Mode SS | |||
|---|---|---|---|
| Quadrant | BADHDUFLAG | Total packets | Discarded packets |
| A | 0 | 108 | 0 |
| B | 0 | 108 | 0 |
| C | 0 | 108 | 0 |
| D | 0 | 108 | 0 |
| Quadrant | Total seconds | Saturated seconds | Saturation percentage |
|---|---|---|---|
| A | 5261 | 6 | 0.114047% |
| B | 5261 | 27 | 0.513210% |
| C | 5261 | 65 | 1.235507% |
| D | 5261 | 218 | 4.143699% |
Noise dominated data is calculated using 1-second bins in cleaned event files. If a bin has >2000 counts, and if more than 50% of those come from <1% of pixels, then it is considered to be noise-dominated and hence unusable.
| Quadrant | # 1 sec bins | Bins with >0 counts | Bins with >2000 counts | High rate bins dominated by noise | Noise dominated (total time) | Noise dominated (detector-on time) | Marked lightcurve |
|---|---|---|---|---|---|---|---|
| A | 7024 | 5262 | 0 | 0 | 0.00% | 0.00% | 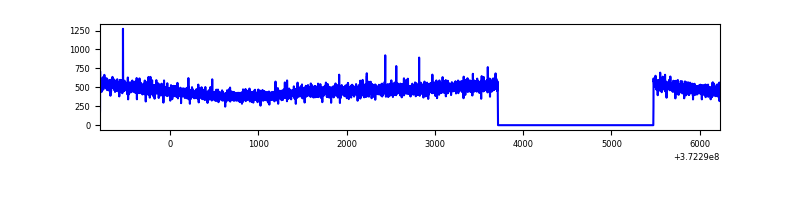 |
| B | 7024 | 5262 | 19 | 19 | 0.27% | 0.36% | 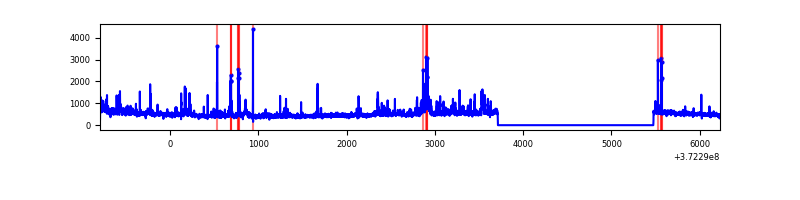 |
| C | 7024 | 5262 | 47 | 47 | 0.67% | 0.89% | 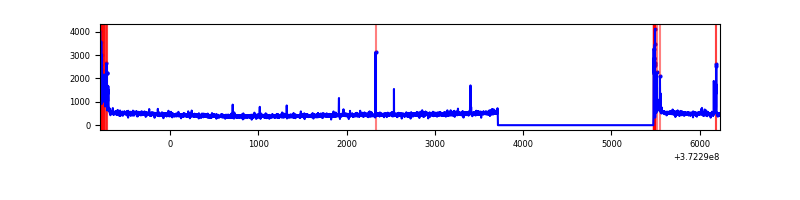 |
| D | 7024 | 5262 | 172 | 172 | 2.45% | 3.27% | 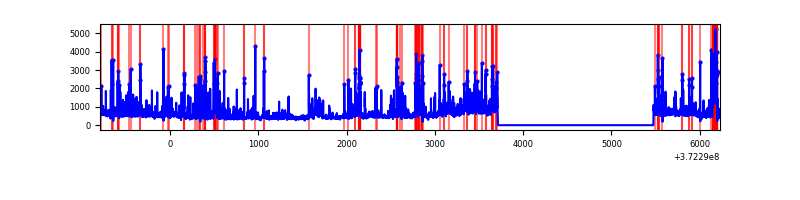 |
Top three noisy pixels from each quadrant. If the there are fewer than three noisy pixels in the level2.evt file, extra rows are filled as -1
| Pixel properties | Quadrant properties | ||||||
|---|---|---|---|---|---|---|---|
| Quadrant | DetID | PixID | Counts | Sigma | Mean | Median | Sigma |
| A | 13 | 6 | 26720 | 212.57 | 616 | 605 | 122.9 |
| A | 13 | 254 | 9615 | 73.34 | 616 | 605 | 122.9 |
| A | 3 | 137 | 5402 | 39.05 | 616 | 605 | 122.9 |
| B | 12 | 1 | 129343 | 1077.57 | 621 | 607 | 119.5 |
| B | 4 | 251 | 68395 | 567.41 | 621 | 607 | 119.5 |
| B | 0 | 219 | 66421 | 550.89 | 621 | 607 | 119.5 |
| C | 0 | 10 | 184551 | 1329.79 | 597 | 603 | 138.3 |
| C | 9 | 187 | 32480 | 230.44 | 597 | 603 | 138.3 |
| C | 3 | 233 | 11247 | 76.95 | 597 | 603 | 138.3 |
| D | 2 | 250 | 512645 | 3470.03 | 579 | 568 | 147.6 |
| D | 7 | 80 | 419978 | 2842.09 | 579 | 568 | 147.6 |
| D | 8 | 195 | 236782 | 1600.68 | 579 | 568 | 147.6 |
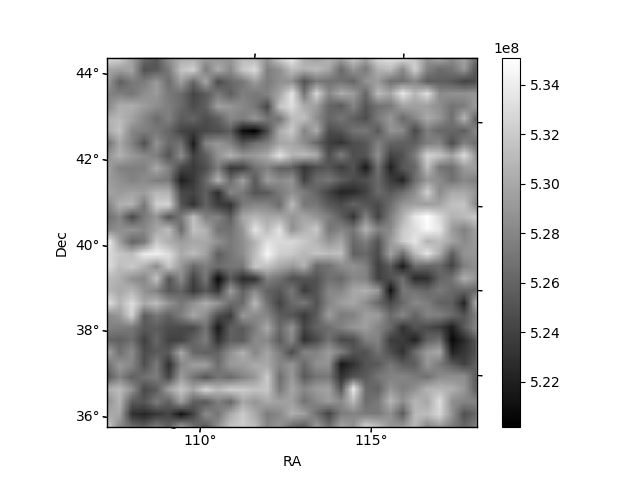
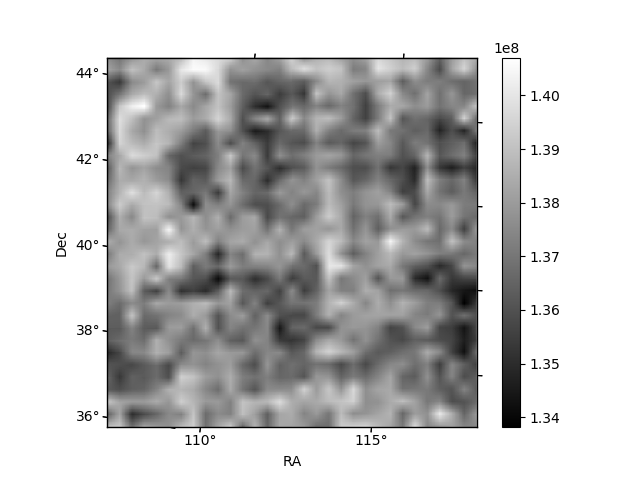
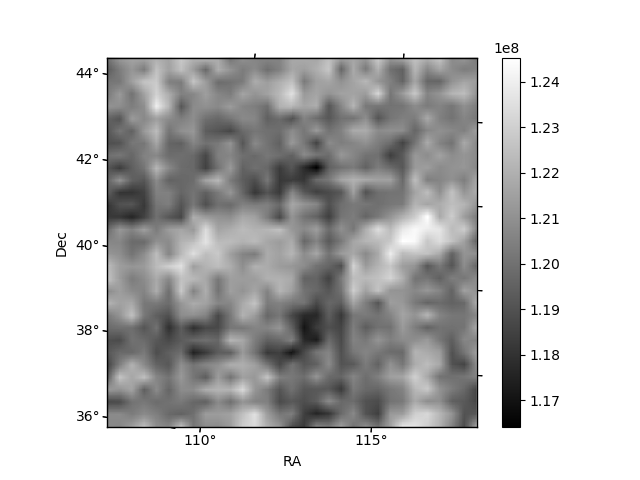
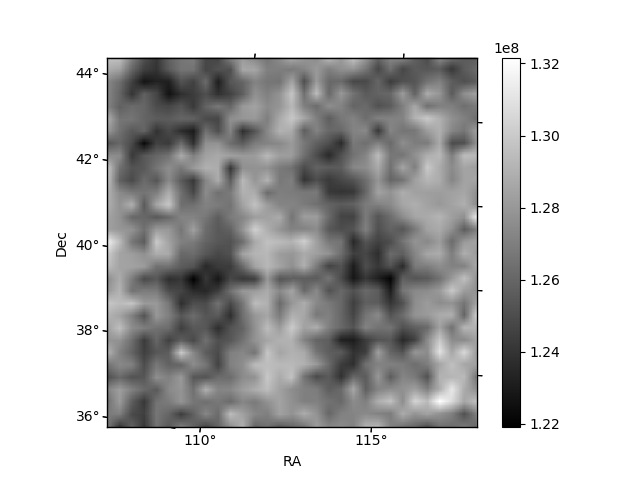
Histogram calculated using DETX and DETY for each event in the final _common_clean file
| Quadrant A |  |
 |
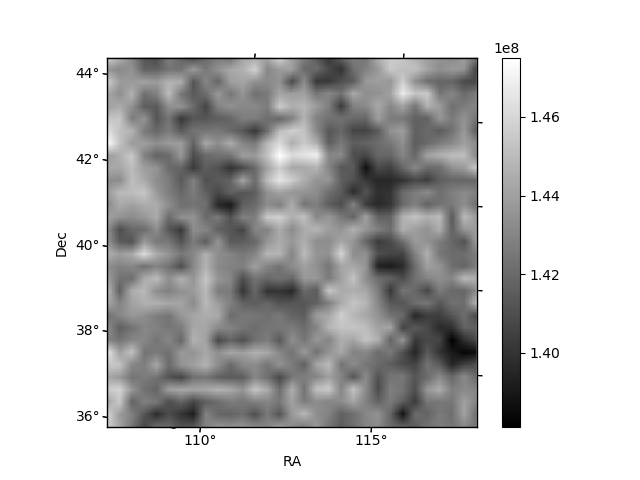
Quadrant B |
|---|---|---|---|
| Quadrant D |  |
 |
Quadrant C |
| Plot type | Count rate plots | Images |
|---|---|---|
| Comparison with Poisson distribution Blue bars denote a histogram of data divided into 1 sec bins. Red curve is a Poisson curve with rate = median count rate of data. |
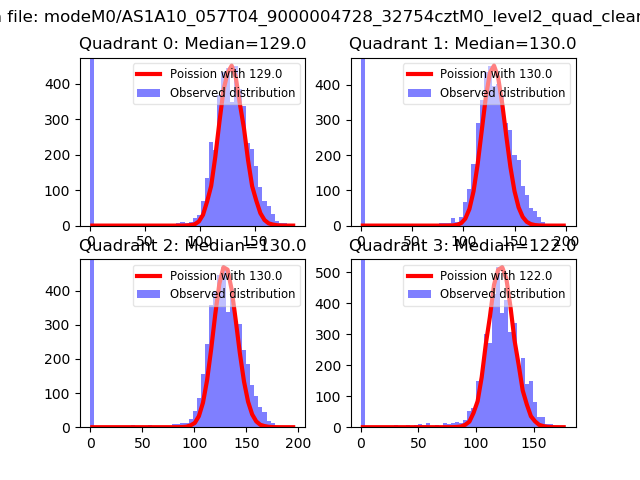 |
 |
| Quadrant-wise count rates Data is divided into 100 sec bins |
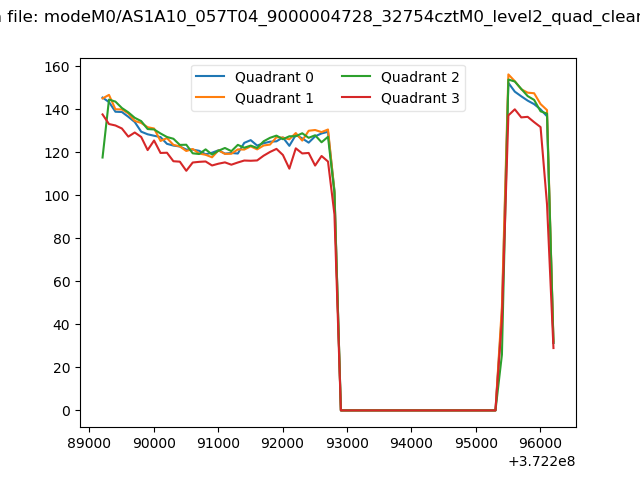 |
|
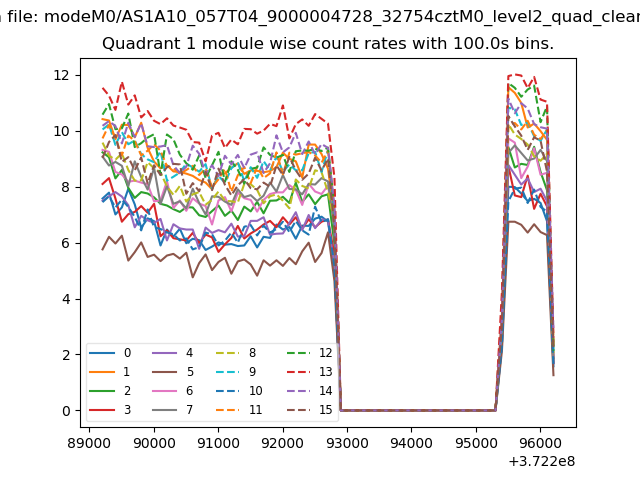
| Module-wise count rates for Quadrant A Data is divided into 100 sec bins |
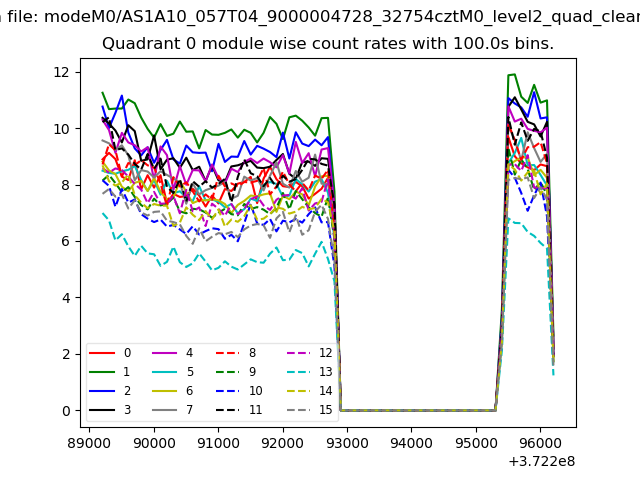 |
 |
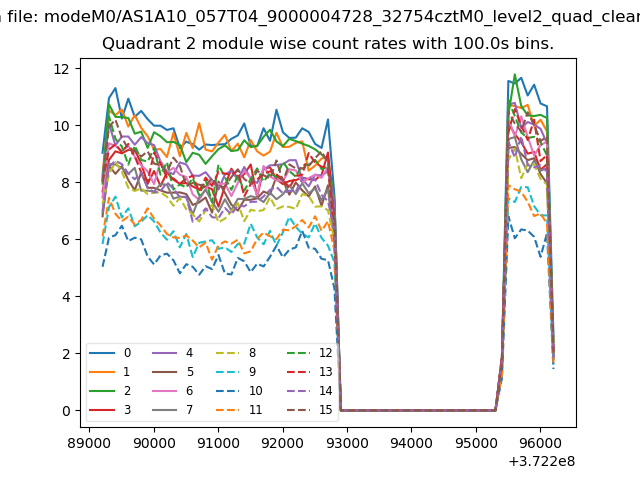
| Module-wise count rates for Quadrant B Data is divided into 100 sec bins |
 |
 |
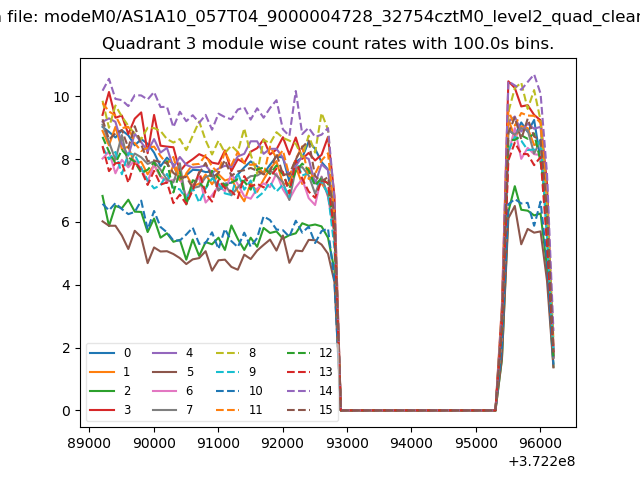
| Module-wise count rates for Quadrant C Data is divided into 100 sec bins |
 |
 |
| Module-wise count rates for Quadrant D Data is divided into 100 sec bins |
 |
 |
| Parameter | Plot |
|---|---|
| CZT HV Monitor | 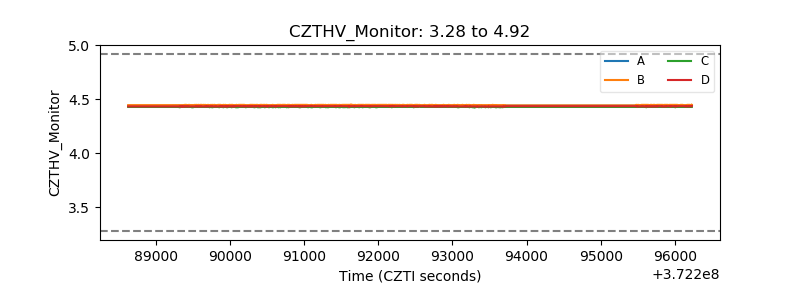 |
| D_VDD | 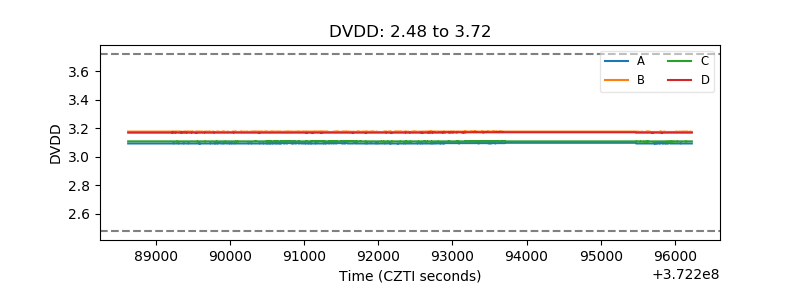 |
| Temperature 1 | 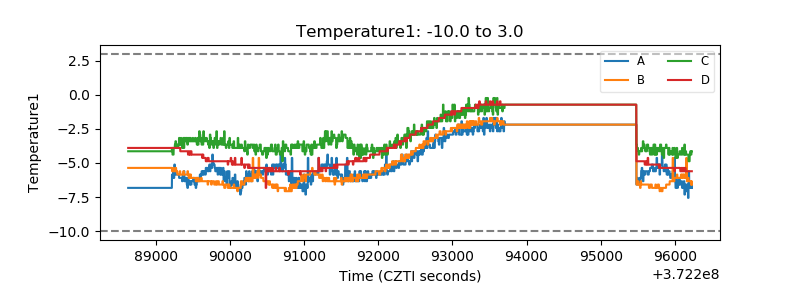 |
| Veto HV Monitor | 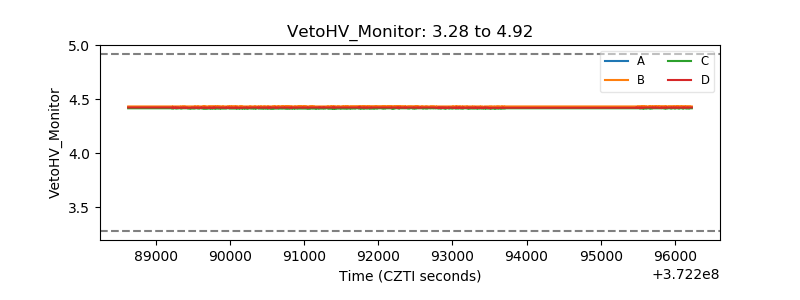 |
| Veto LLD | 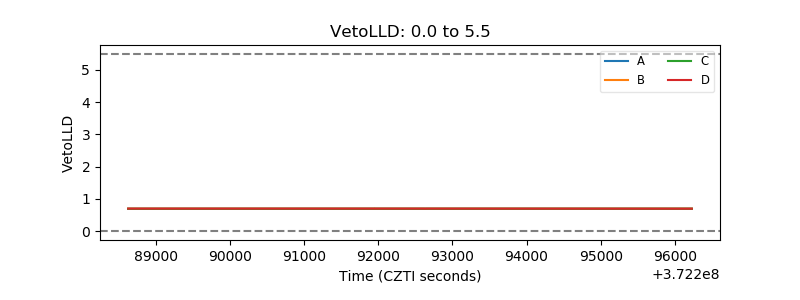 |
| Alpha Counter | 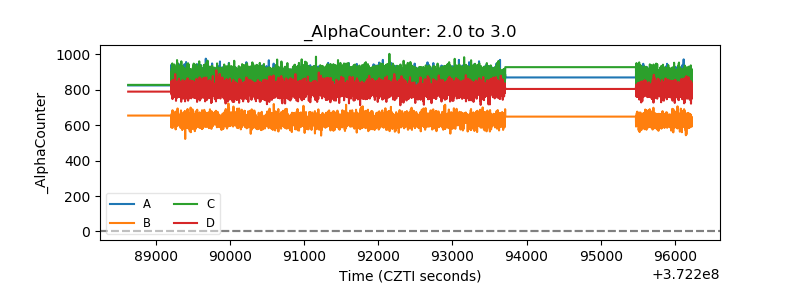 |
| _CPM_Rate | 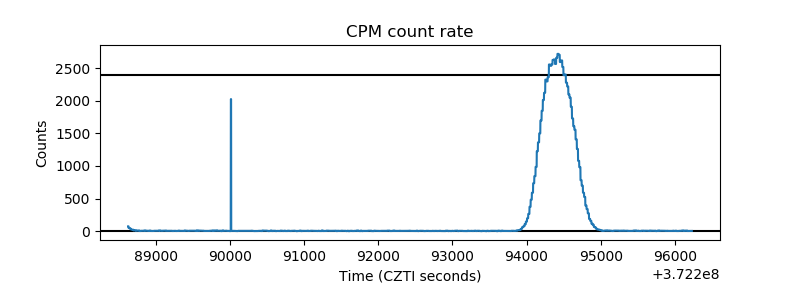 |
| CZT Counter | 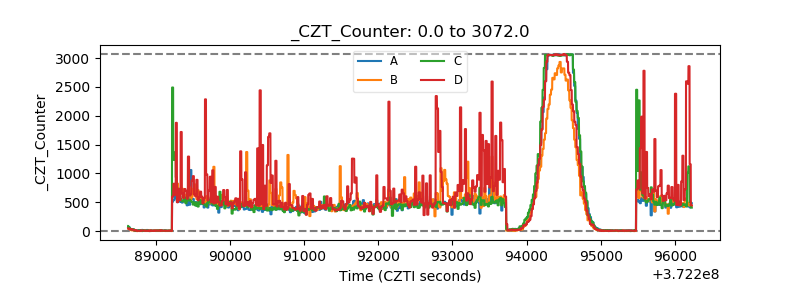 |
| +2.5 Volts monitor |  |
| +5 Volts monitor |  |
| _ROLL_ROT | 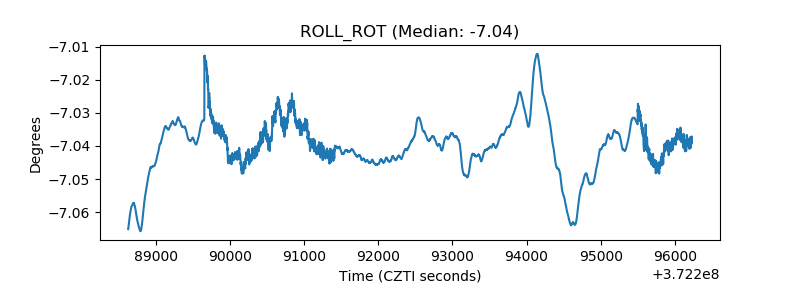 |
| _Roll_DEC | 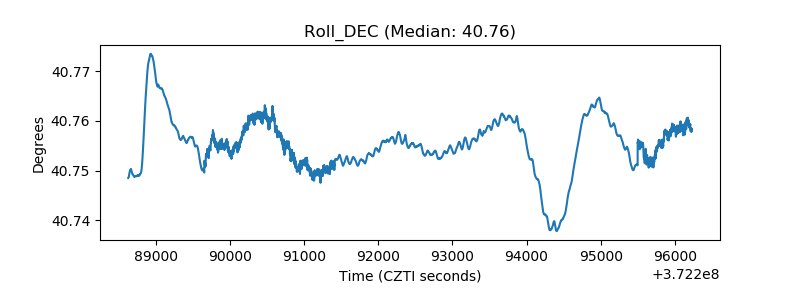 |
| _Roll_RA | 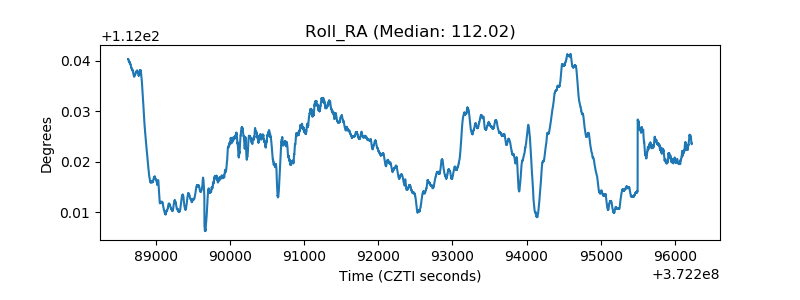 |
| Veto Counter | 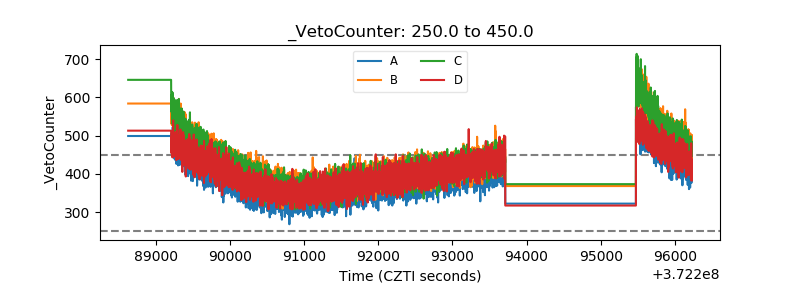 |