| Param | Original file | Final file |
|---|---|---|
| Filename | modeM0/AS1A10_057T04_9000004728_32756cztM0_level2.evt | modeM0/AS1A10_057T04_9000004728_32756cztM0_level2_quad_clean.evt |
| Size (bytes) | 421,649,280 | 83,828,160 |
| Size | 402.1 MB | 79.9 MB |
| Events in quadrant A | 2,576,073 | 547,512 |
| Events in quadrant B | 2,770,535 | 565,147 |
| Events in quadrant C | 2,660,850 | 551,467 |
| Events in quadrant D | 4,402,849 | 504,033 |
| Mode M0 | |||
|---|---|---|---|
| Quadrant | BADHDUFLAG | Total packets | Discarded packets |
| A | 0 | 10894 | 3 |
| B | 0 | 11450 | 2 |
| C | 0 | 11207 | 2 |
| D | 0 | 16701 | 2 |
| Mode M9 | |||
|---|---|---|---|
| Quadrant | BADHDUFLAG | Total packets | Discarded packets |
| A | 0 | 31 | 0 |
| B | 0 | 31 | 0 |
| C | 0 | 31 | 0 |
| D | 0 | 32 | 0 |
| Mode SS | |||
|---|---|---|---|
| Quadrant | BADHDUFLAG | Total packets | Discarded packets |
| A | 0 | 108 | 0 |
| B | 0 | 108 | 0 |
| C | 0 | 108 | 0 |
| D | 0 | 108 | 0 |
| Quadrant | Total seconds | Saturated seconds | Saturation percentage |
|---|---|---|---|
| A | 5288 | 14 | 0.264750% |
| B | 5288 | 24 | 0.453858% |
| C | 5288 | 22 | 0.416036% |
| D | 5288 | 374 | 7.072617% |
Noise dominated data is calculated using 1-second bins in cleaned event files. If a bin has >2000 counts, and if more than 50% of those come from <1% of pixels, then it is considered to be noise-dominated and hence unusable.
| Quadrant | # 1 sec bins | Bins with >0 counts | Bins with >2000 counts | High rate bins dominated by noise | Noise dominated (total time) | Noise dominated (detector-on time) | Marked lightcurve |
|---|---|---|---|---|---|---|---|
| A | 7291 | 5289 | 8 | 8 | 0.11% | 0.15% | 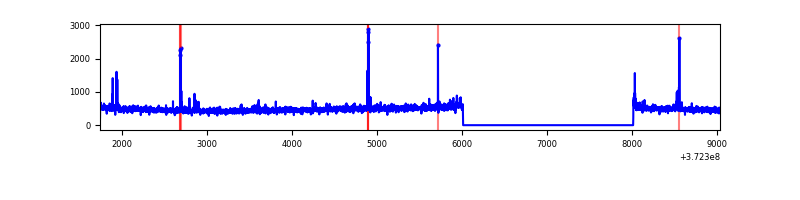 |
| B | 7291 | 5289 | 10 | 10 | 0.14% | 0.19% | 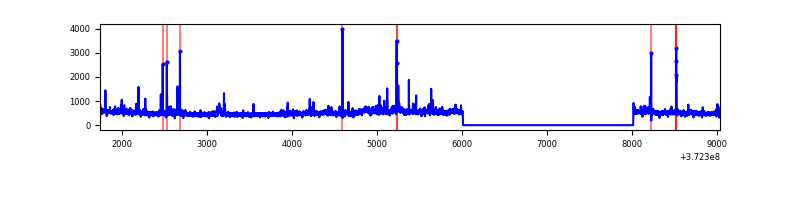 |
| C | 7291 | 5289 | 16 | 16 | 0.22% | 0.30% | 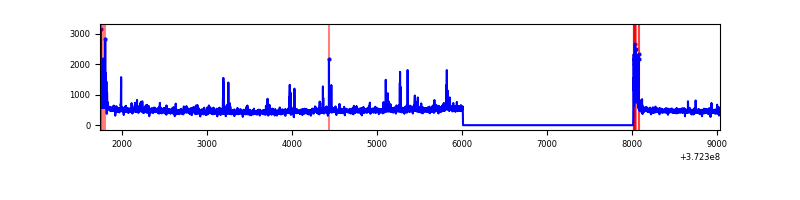 |
| D | 7291 | 5289 | 322 | 322 | 4.42% | 6.09% | 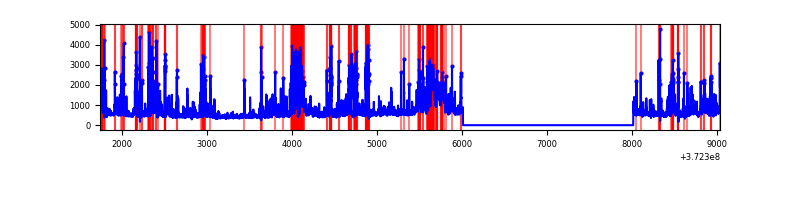 |
Top three noisy pixels from each quadrant. If the there are fewer than three noisy pixels in the level2.evt file, extra rows are filled as -1
| Pixel properties | Quadrant properties | ||||||
|---|---|---|---|---|---|---|---|
| Quadrant | DetID | PixID | Counts | Sigma | Mean | Median | Sigma |
| A | 15 | 237 | 28458 | 216.8 | 645 | 634 | 128.3 |
| A | 0 | 254 | 27261 | 207.48 | 645 | 634 | 128.3 |
| A | 12 | 16 | 16891 | 126.67 | 645 | 634 | 128.3 |
| B | 5 | 172 | 47350 | 383.47 | 650 | 637 | 121.8 |
| B | 0 | 197 | 43033 | 348.03 | 650 | 637 | 121.8 |
| B | 0 | 219 | 42369 | 342.58 | 650 | 637 | 121.8 |
| C | 0 | 10 | 109495 | 764.4 | 623 | 629 | 142.4 |
| C | 4 | 254 | 35616 | 245.66 | 623 | 629 | 142.4 |
| C | 8 | 35 | 33189 | 228.62 | 623 | 629 | 142.4 |
| D | 7 | 80 | 693240 | 4574.31 | 594 | 581 | 151.4 |
| D | 2 | 250 | 536487 | 3539.11 | 594 | 581 | 151.4 |
| D | 8 | 195 | 356093 | 2347.79 | 594 | 581 | 151.4 |
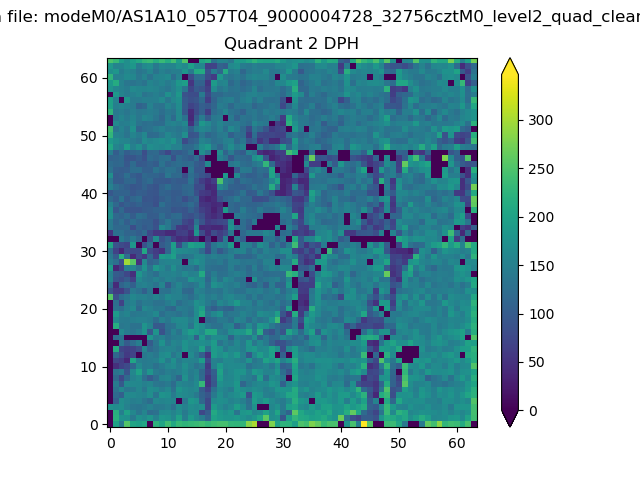
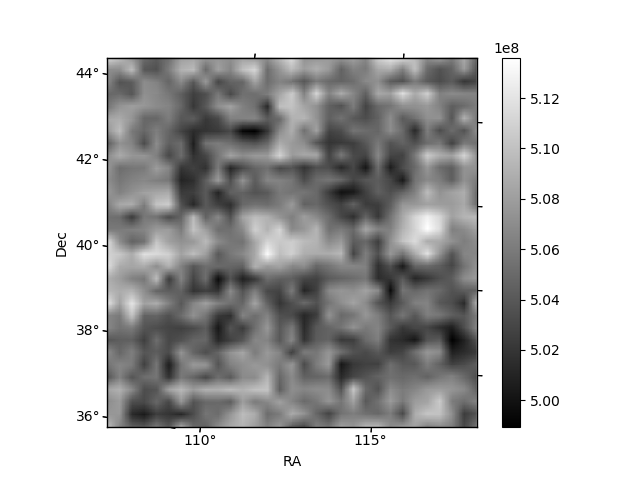
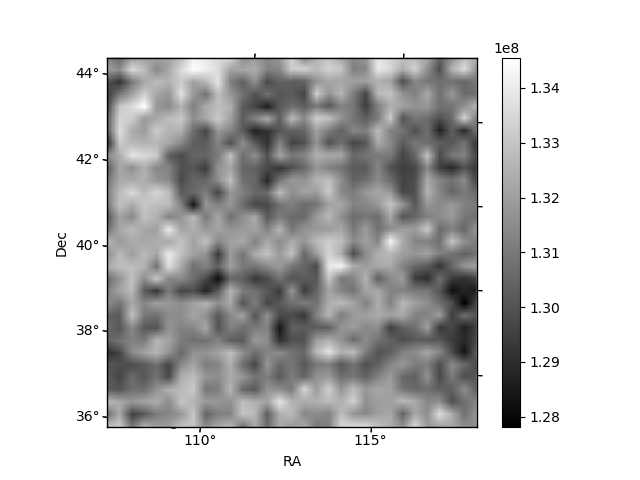
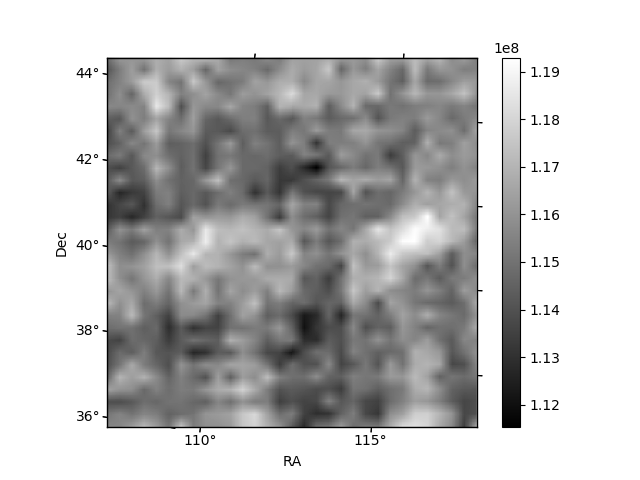
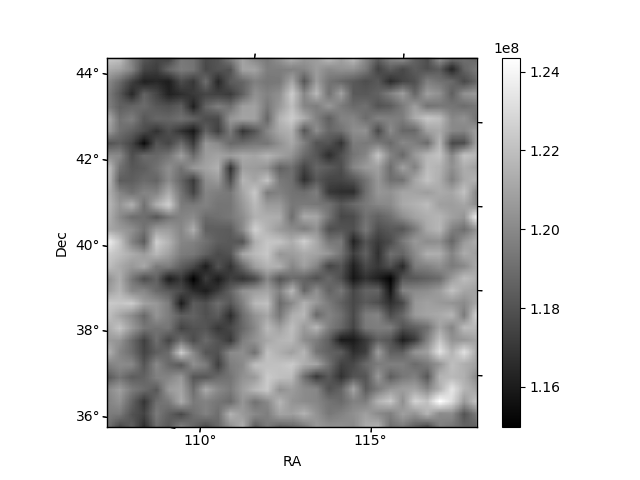
Histogram calculated using DETX and DETY for each event in the final _common_clean file
| Quadrant A | 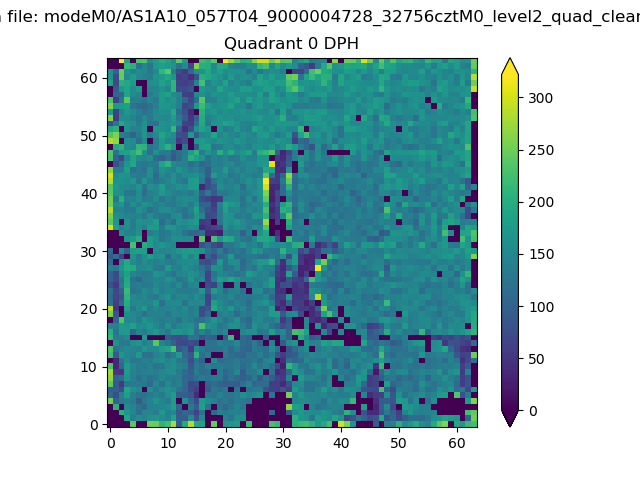 |
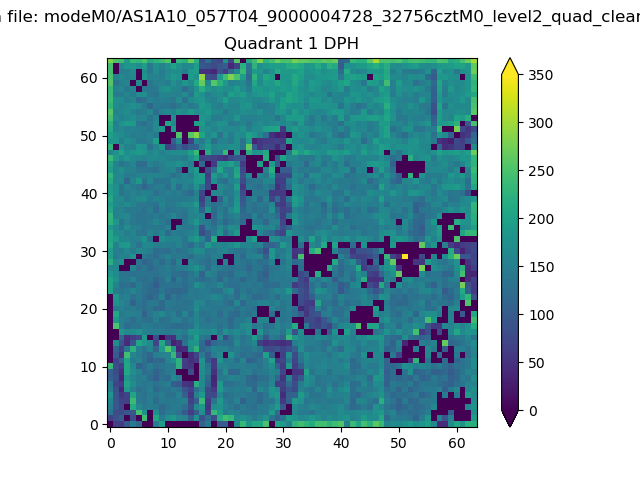 |
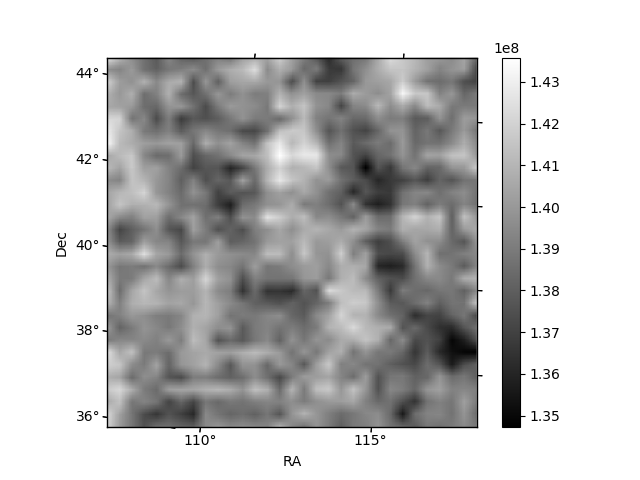
Quadrant B |
|---|---|---|---|
| Quadrant D | 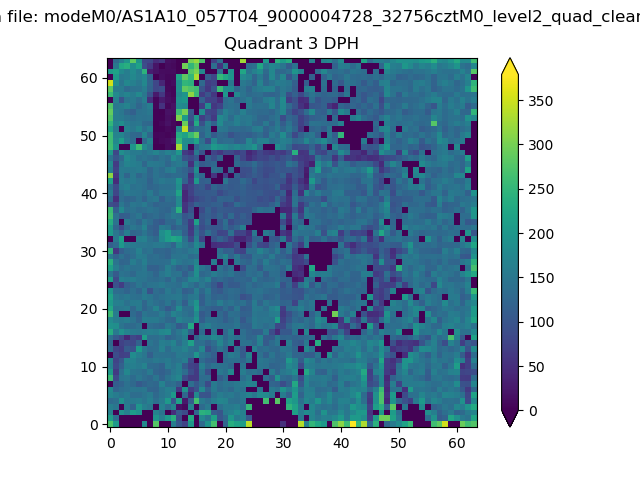 |
 |
Quadrant C |
| Plot type | Count rate plots | Images |
|---|---|---|
| Comparison with Poisson distribution Blue bars denote a histogram of data divided into 1 sec bins. Red curve is a Poisson curve with rate = median count rate of data. |
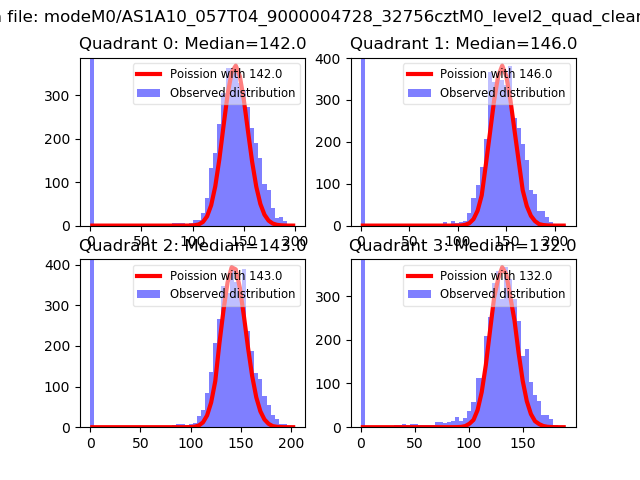 |
 |
| Quadrant-wise count rates Data is divided into 100 sec bins |
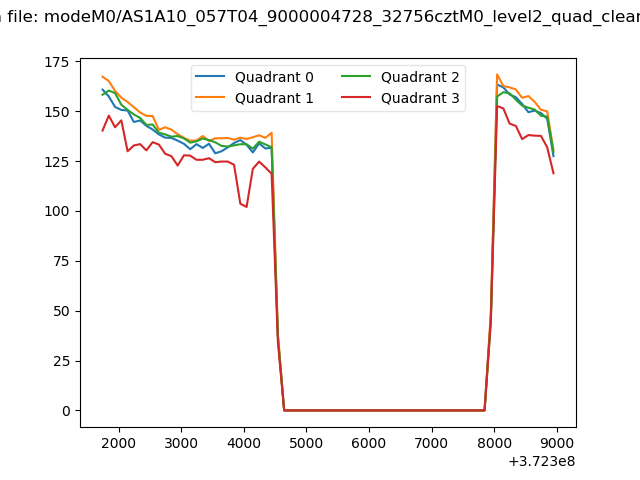 |
|
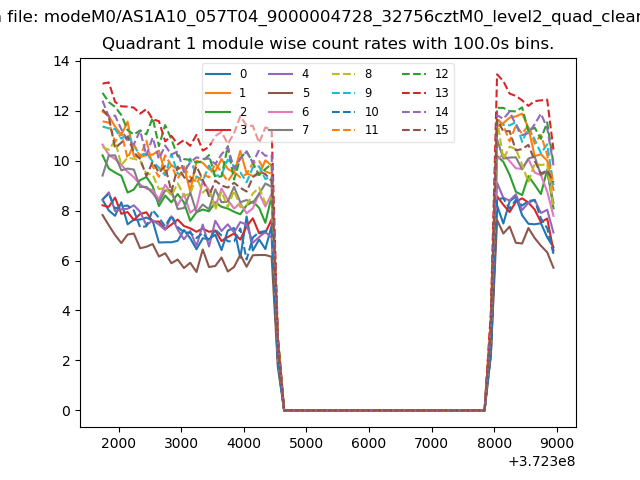
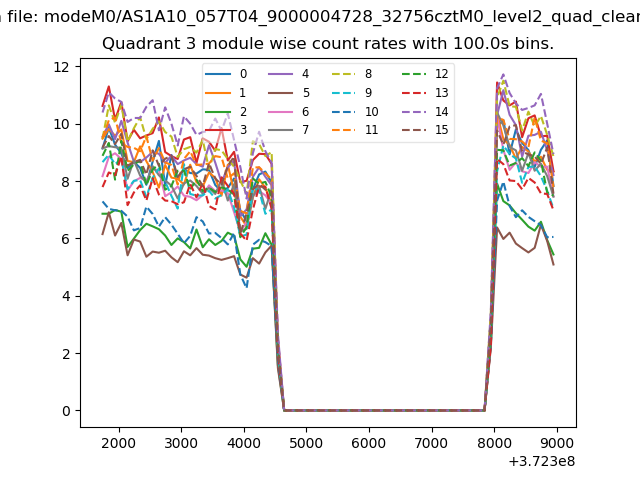
| Module-wise count rates for Quadrant A Data is divided into 100 sec bins |
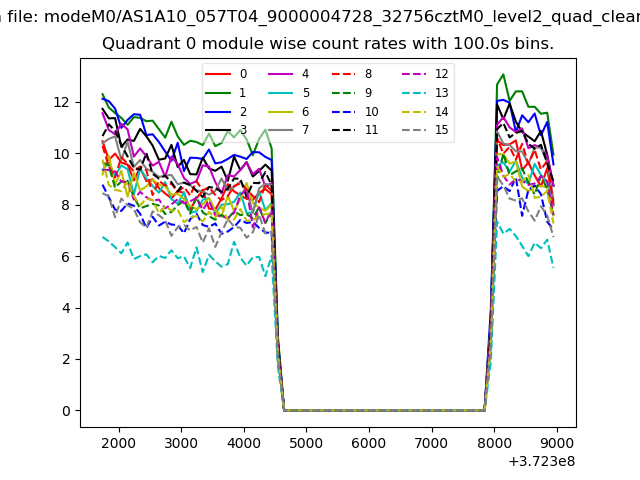 |
 |
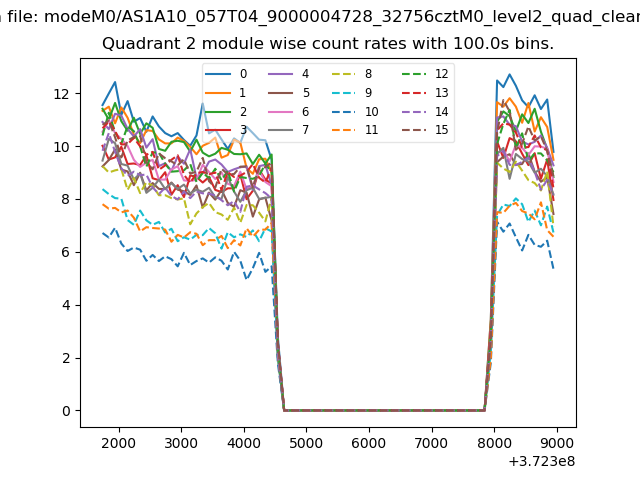
| Module-wise count rates for Quadrant B Data is divided into 100 sec bins |
 |
 |
| Module-wise count rates for Quadrant C Data is divided into 100 sec bins |
 |
 |
| Module-wise count rates for Quadrant D Data is divided into 100 sec bins |
 |
 |
| Parameter | Plot |
|---|---|
| CZT HV Monitor | 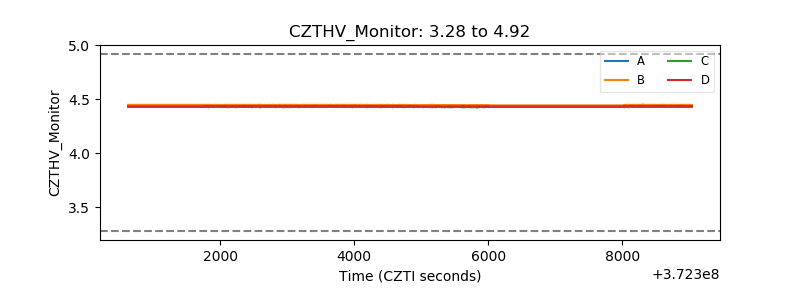 |
| D_VDD | 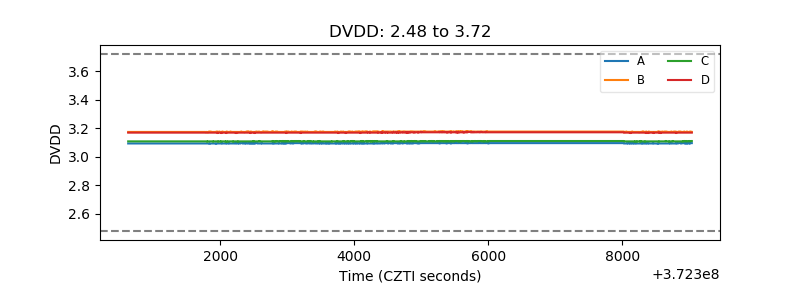 |
| Temperature 1 | 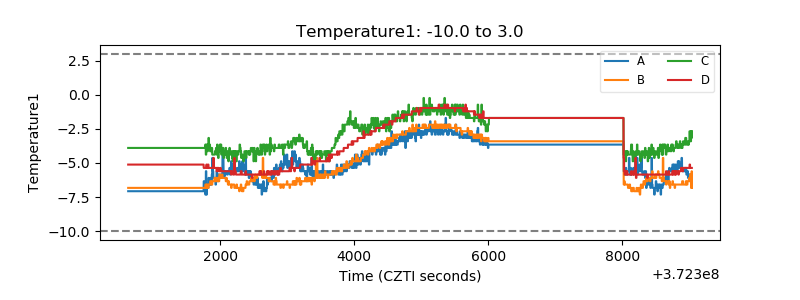 |
| Veto HV Monitor | 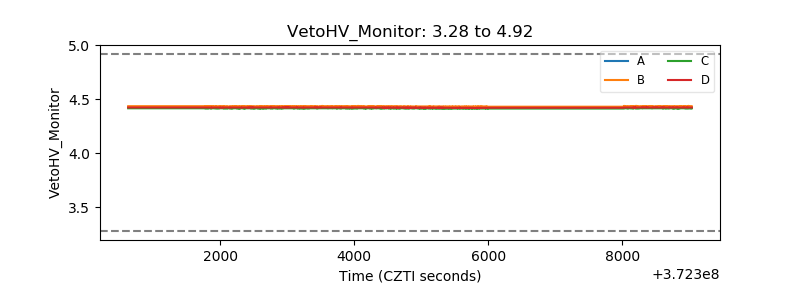 |
| Veto LLD | 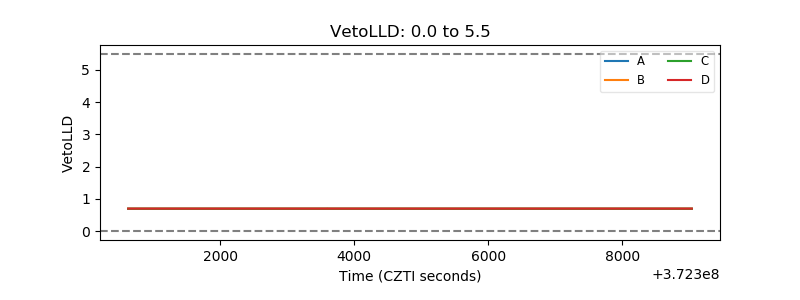 |
| Alpha Counter | 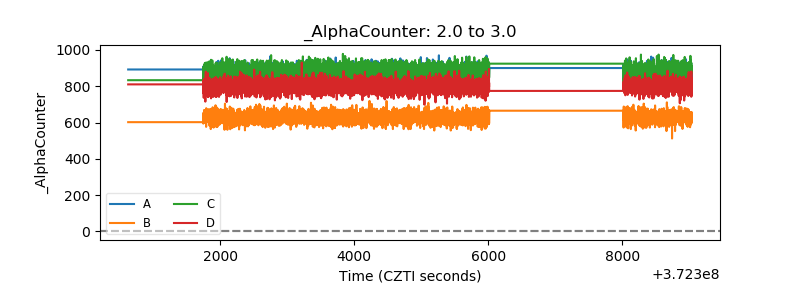 |
| _CPM_Rate | 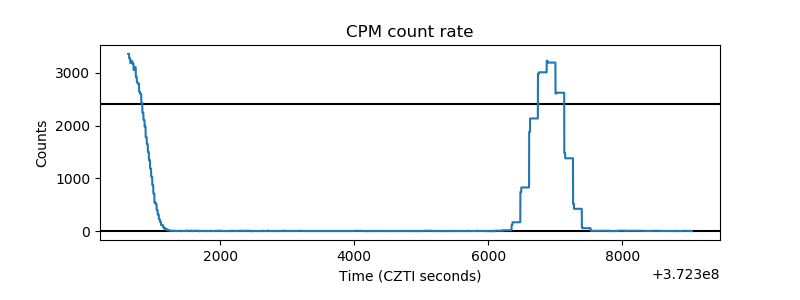 |
| CZT Counter | 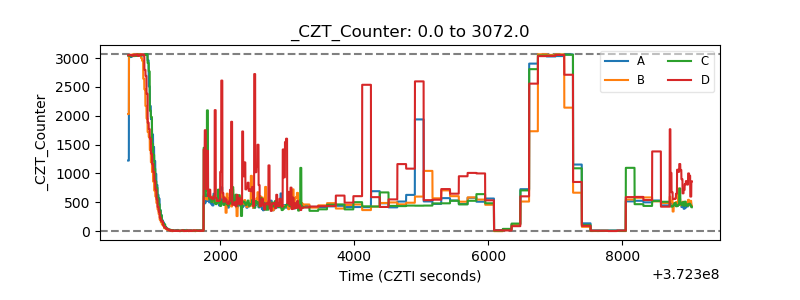 |
| +2.5 Volts monitor |  |
| +5 Volts monitor |  |
| _ROLL_ROT | 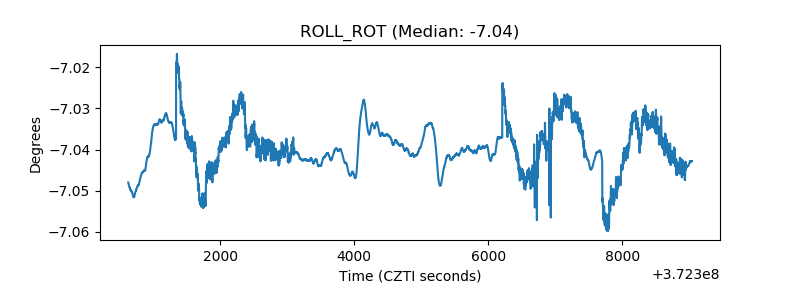 |
| _Roll_DEC | 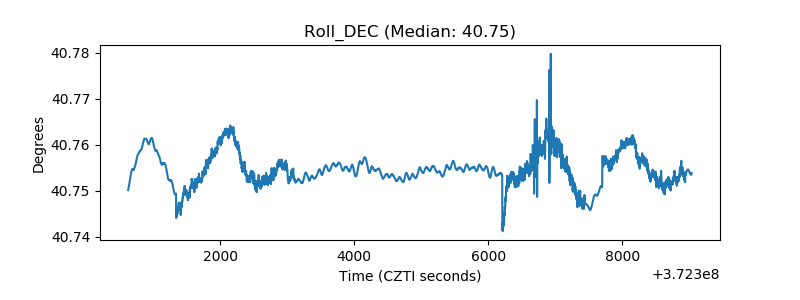 |
| _Roll_RA | 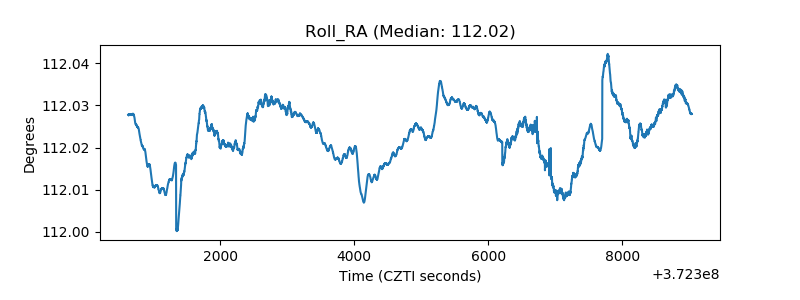 |
| Veto Counter | 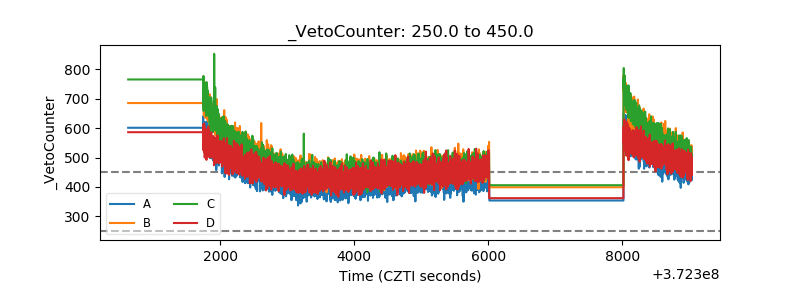 |