| Param | Original file | Final file |
|---|---|---|
| Filename | modeM0/AS1A10_057T04_9000004728_32758cztM0_level2.evt | modeM0/AS1A10_057T04_9000004728_32758cztM0_level2_quad_clean.evt |
| Size (bytes) | 436,763,520 | 63,178,560 |
| Size | 416.5 MB | 60.3 MB |
| Events in quadrant A | 2,368,463 | 401,013 |
| Events in quadrant B | 2,748,807 | 403,842 |
| Events in quadrant C | 2,381,449 | 397,727 |
| Events in quadrant D | 5,396,374 | 366,648 |
| Mode M0 | |||
|---|---|---|---|
| Quadrant | BADHDUFLAG | Total packets | Discarded packets |
| A | 0 | 9908 | 2 |
| B | 0 | 11105 | 1 |
| C | 0 | 10128 | 1 |
| D | 0 | 19517 | 1 |
| Mode M9 | |||
|---|---|---|---|
| Quadrant | BADHDUFLAG | Total packets | Discarded packets |
| A | 0 | 22 | 0 |
| B | 0 | 22 | 0 |
| C | 0 | 22 | 0 |
| D | 0 | 22 | 0 |
| Mode SS | |||
|---|---|---|---|
| Quadrant | BADHDUFLAG | Total packets | Discarded packets |
| A | 0 | 98 | 0 |
| B | 0 | 98 | 0 |
| C | 0 | 98 | 0 |
| D | 0 | 98 | 0 |
| Quadrant | Total seconds | Saturated seconds | Saturation percentage |
|---|---|---|---|
| A | 4905 | 3 | 0.061162% |
| B | 4905 | 62 | 1.264016% |
| C | 4905 | 22 | 0.448522% |
| D | 4905 | 326 | 6.646279% |
Noise dominated data is calculated using 1-second bins in cleaned event files. If a bin has >2000 counts, and if more than 50% of those come from <1% of pixels, then it is considered to be noise-dominated and hence unusable.
| Quadrant | # 1 sec bins | Bins with >0 counts | Bins with >2000 counts | High rate bins dominated by noise | Noise dominated (total time) | Noise dominated (detector-on time) | Marked lightcurve |
|---|---|---|---|---|---|---|---|
| A | 7057 | 4906 | 0 | 0 | 0.00% | 0.00% | 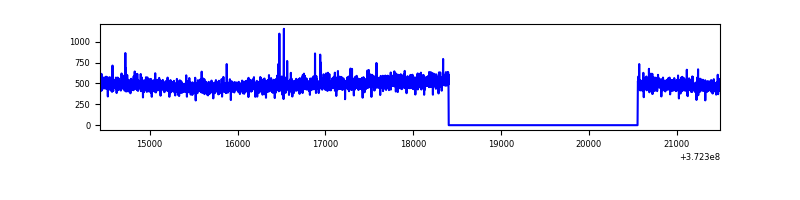 |
| B | 7057 | 4906 | 45 | 45 | 0.64% | 0.92% | 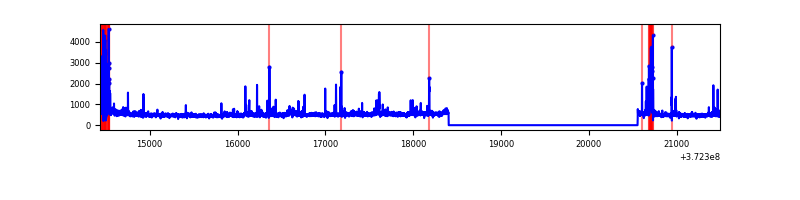 |
| C | 7057 | 4906 | 14 | 14 | 0.20% | 0.29% | 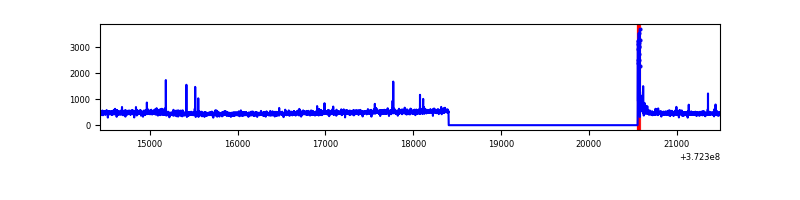 |
| D | 7057 | 4906 | 262 | 262 | 3.71% | 5.34% | 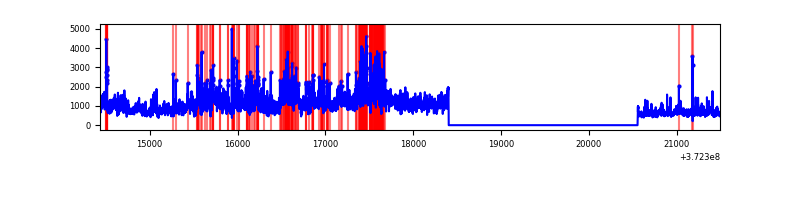 |
Top three noisy pixels from each quadrant. If the there are fewer than three noisy pixels in the level2.evt file, extra rows are filled as -1
| Pixel properties | Quadrant properties | ||||||
|---|---|---|---|---|---|---|---|
| Quadrant | DetID | PixID | Counts | Sigma | Mean | Median | Sigma |
| A | 13 | 254 | 8551 | 65.68 | 608 | 598 | 121.1 |
| A | 0 | 226 | 5155 | 37.64 | 608 | 598 | 121.1 |
| A | 3 | 137 | 4907 | 35.59 | 608 | 598 | 121.1 |
| B | 12 | 1 | 177585 | 1561.67 | 603 | 591 | 113.3 |
| B | 3 | 32 | 63696 | 556.79 | 603 | 591 | 113.3 |
| B | 5 | 172 | 32232 | 279.18 | 603 | 591 | 113.3 |
| C | 0 | 10 | 66248 | 495.94 | 579 | 585 | 132.4 |
| C | 4 | 254 | 16009 | 116.5 | 579 | 585 | 132.4 |
| C | 8 | 35 | 10887 | 77.81 | 579 | 585 | 132.4 |
| D | 8 | 195 | 2296458 | 16176.45 | 563 | 551 | 141.9 |
| D | 7 | 80 | 343476 | 2416.17 | 563 | 551 | 141.9 |
| D | 2 | 250 | 236631 | 1663.37 | 563 | 551 | 141.9 |
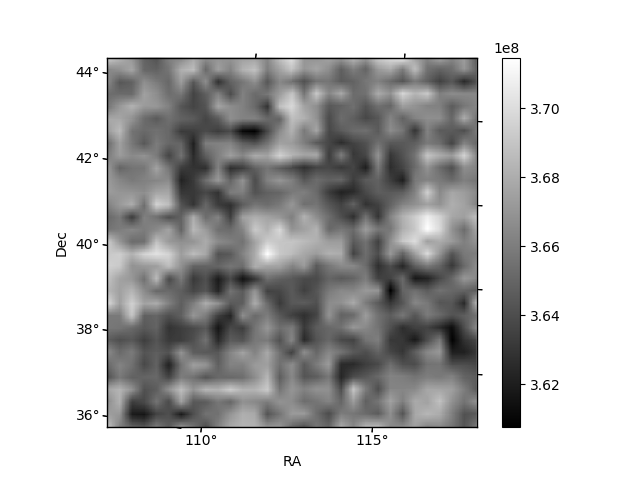
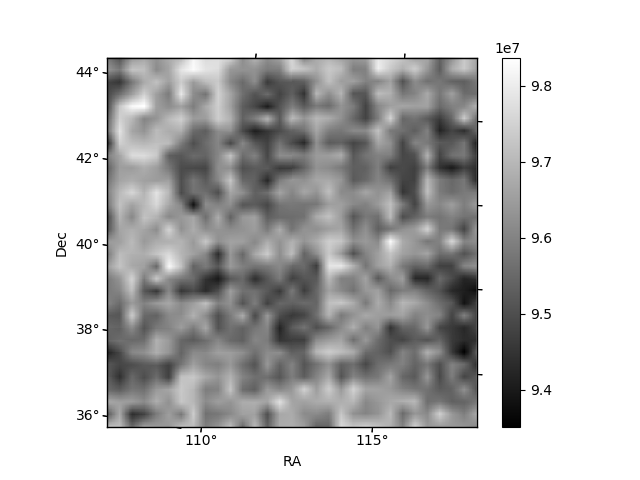
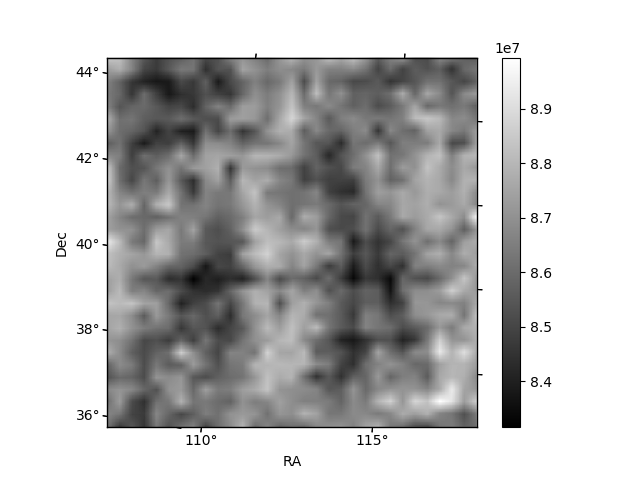
Histogram calculated using DETX and DETY for each event in the final _common_clean file
| Quadrant A | 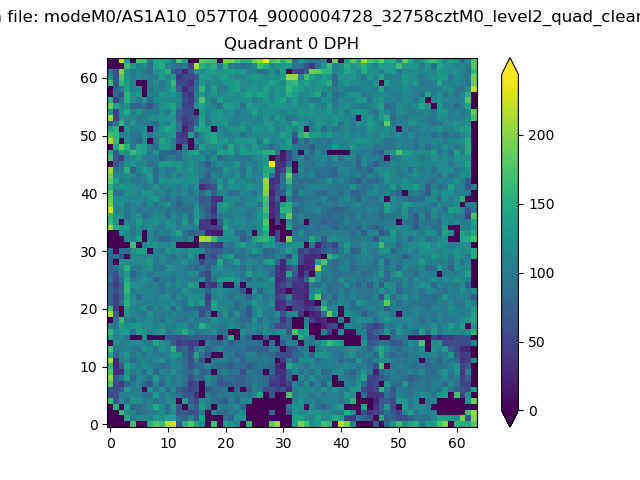 |
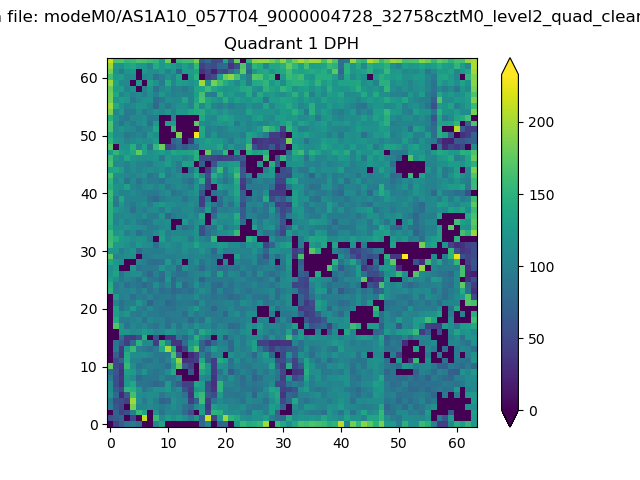 |
Quadrant B |
|---|---|---|---|
| Quadrant D | 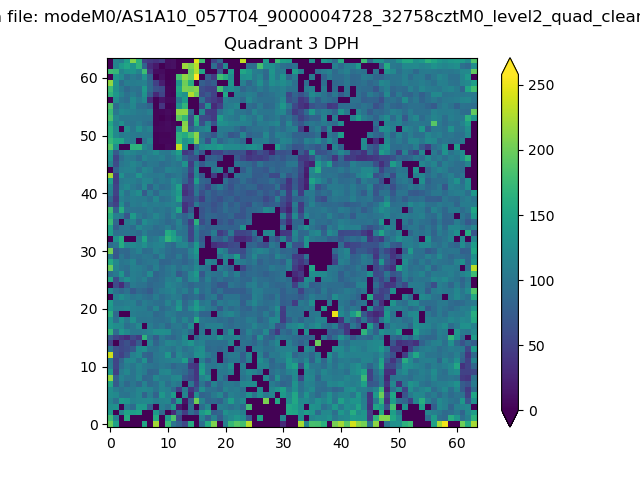 |
 |
Quadrant C |
| Plot type | Count rate plots | Images |
|---|---|---|
| Comparison with Poisson distribution Blue bars denote a histogram of data divided into 1 sec bins. Red curve is a Poisson curve with rate = median count rate of data. |
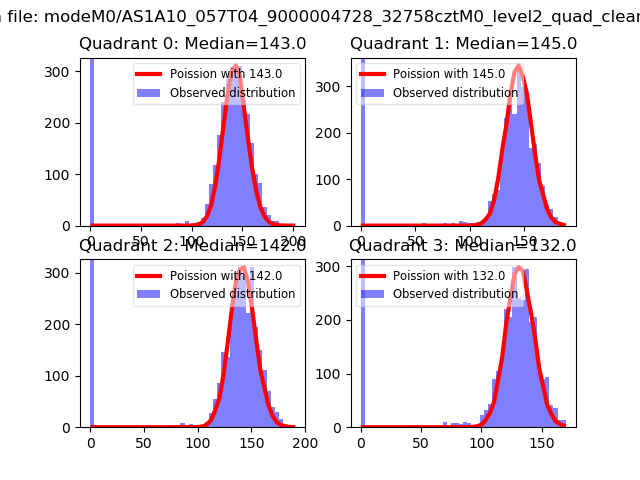 |
 |
| Quadrant-wise count rates Data is divided into 100 sec bins |
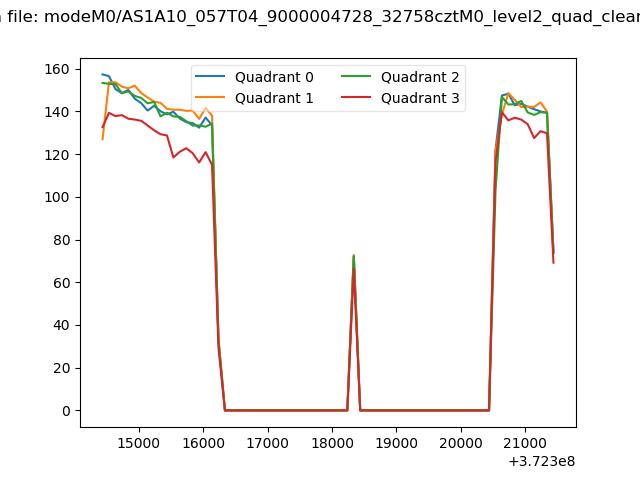 |
|
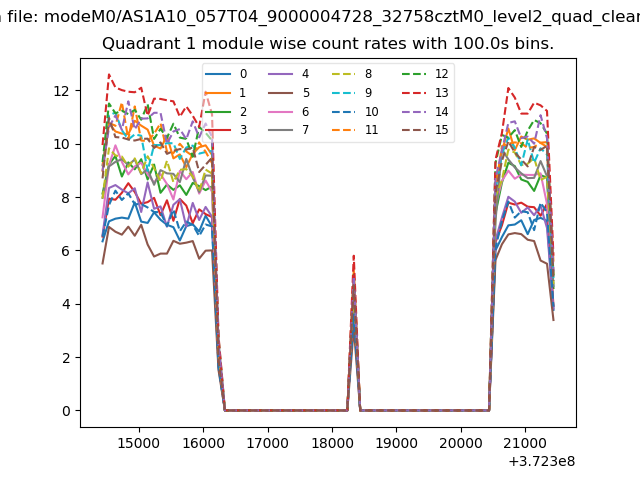
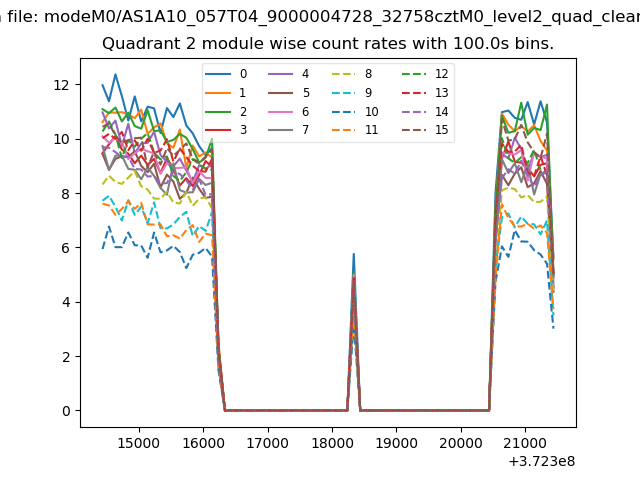
| Module-wise count rates for Quadrant A Data is divided into 100 sec bins |
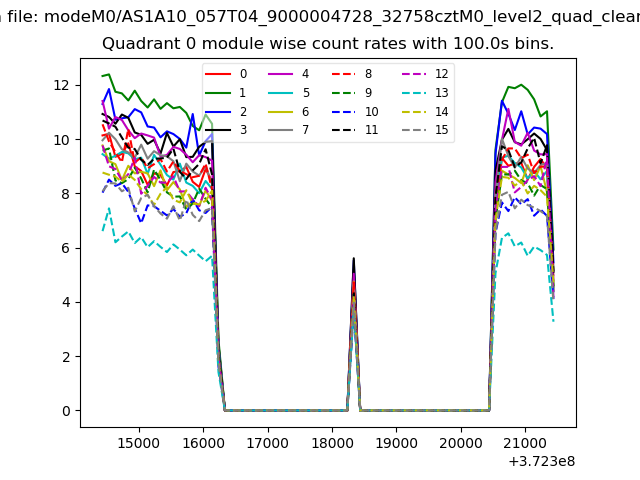 |
 |
| Module-wise count rates for Quadrant B Data is divided into 100 sec bins |
 |
 |
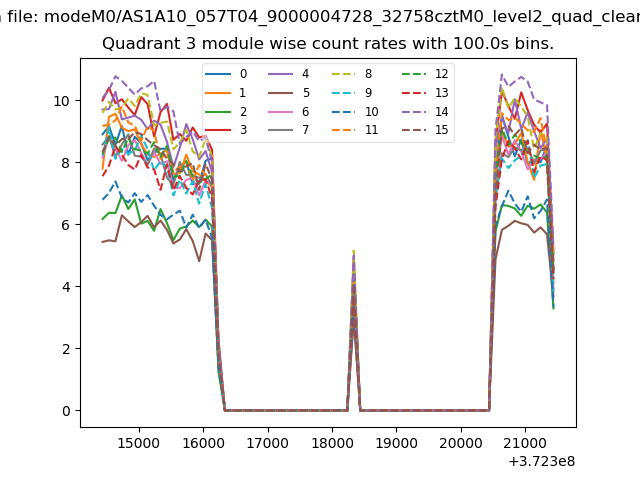
| Module-wise count rates for Quadrant C Data is divided into 100 sec bins |
 |
 |
| Module-wise count rates for Quadrant D Data is divided into 100 sec bins |
 |
 |
| Parameter | Plot |
|---|---|
| CZT HV Monitor |  |
| D_VDD | 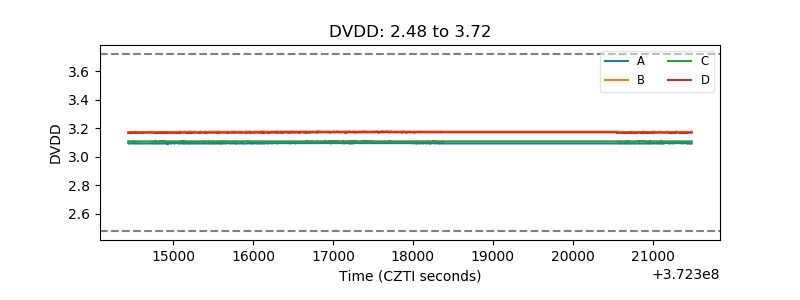 |
| Temperature 1 | 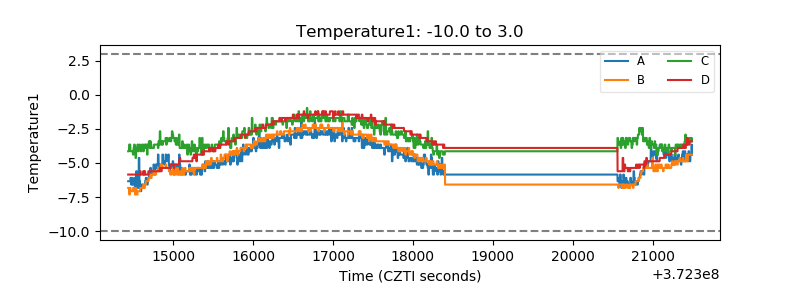 |
| Veto HV Monitor | 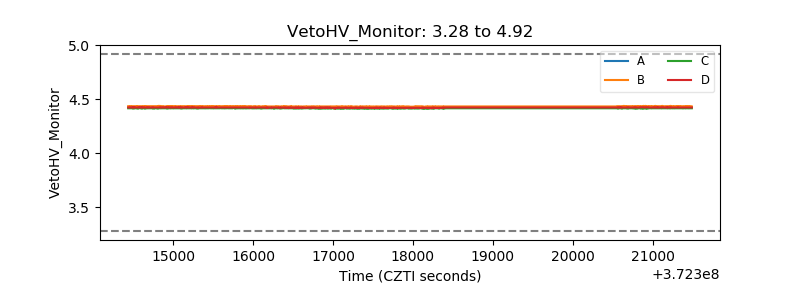 |
| Veto LLD | 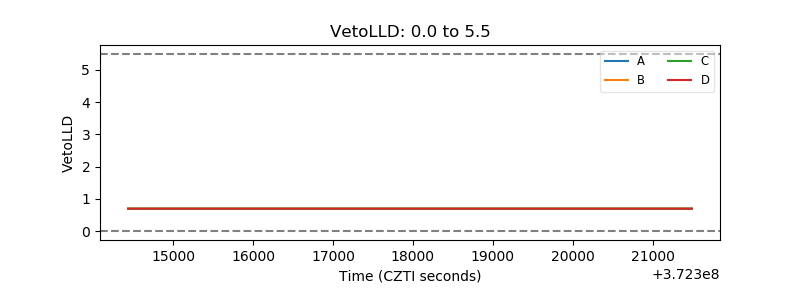 |
| Alpha Counter | 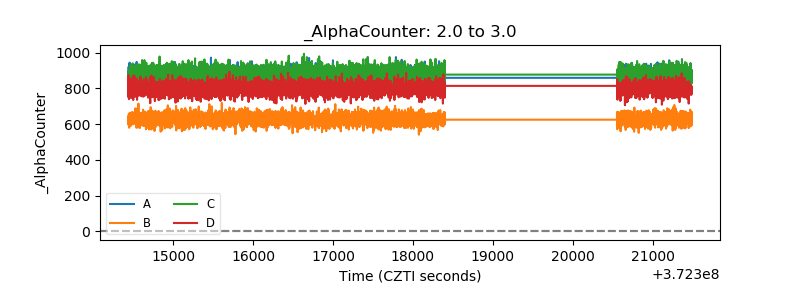 |
| _CPM_Rate | 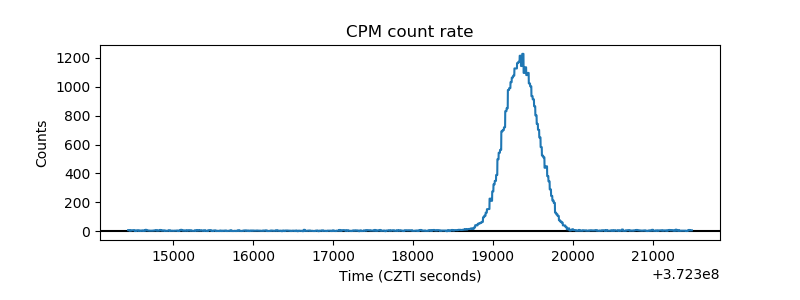 |
| CZT Counter | 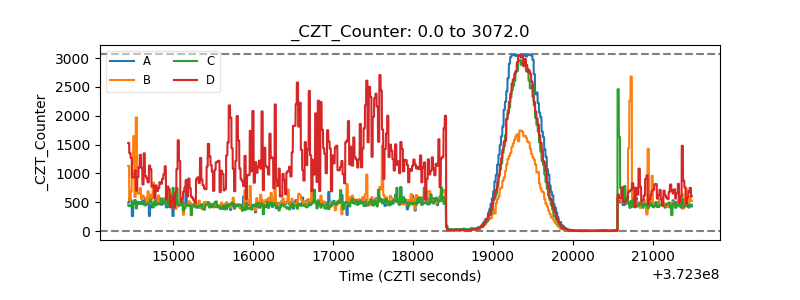 |
| +2.5 Volts monitor |  |
| +5 Volts monitor |  |
| _ROLL_ROT | 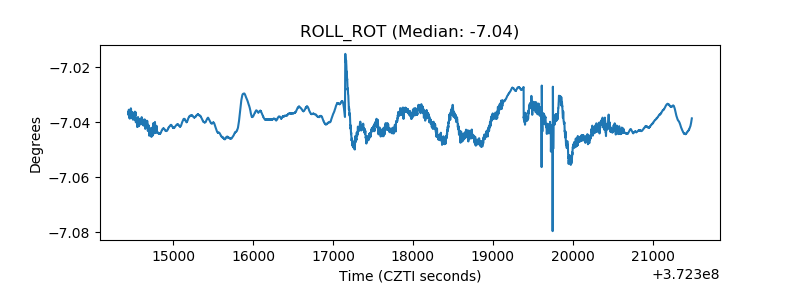 |
| _Roll_DEC | 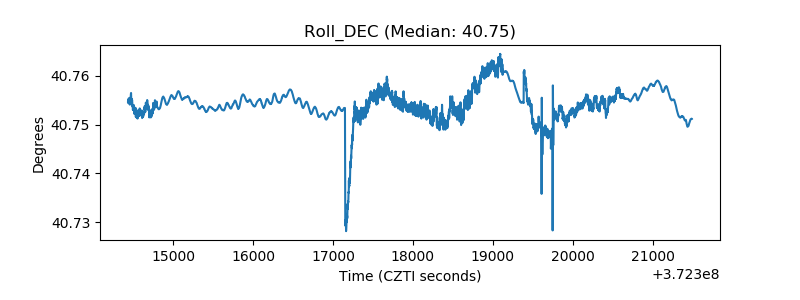 |
| _Roll_RA | 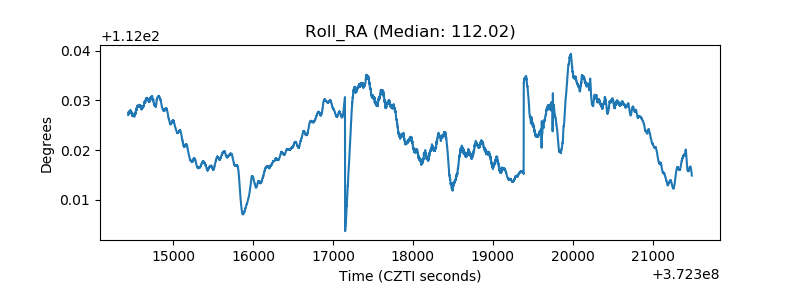 |
| Veto Counter | 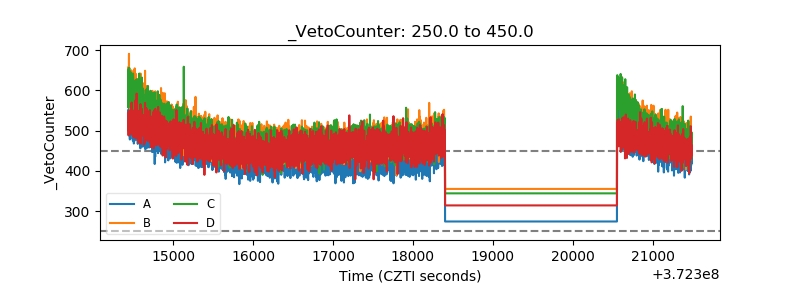 |