| Param | Original file | Final file |
|---|---|---|
| Filename | modeM0/AS1A10_057T04_9000004728_32759cztM0_level2.evt | modeM0/AS1A10_057T04_9000004728_32759cztM0_level2_quad_clean.evt |
| Size (bytes) | 456,814,080 | 60,281,280 |
| Size | 435.7 MB | 57.5 MB |
| Events in quadrant A | 2,572,902 | 379,136 |
| Events in quadrant B | 2,627,895 | 380,496 |
| Events in quadrant C | 2,310,381 | 376,365 |
| Events in quadrant D | 5,994,734 | 348,958 |
| Mode M0 | |||
|---|---|---|---|
| Quadrant | BADHDUFLAG | Total packets | Discarded packets |
| A | 0 | 10551 | 1 |
| B | 0 | 10687 | 0 |
| C | 0 | 9970 | 0 |
| D | 0 | 21268 | 0 |
| Mode M9 | |||
|---|---|---|---|
| Quadrant | BADHDUFLAG | Total packets | Discarded packets |
| A | 0 | 22 | 0 |
| B | 0 | 22 | 0 |
| C | 0 | 22 | 0 |
| D | 0 | 22 | 0 |
| Mode SS | |||
|---|---|---|---|
| Quadrant | BADHDUFLAG | Total packets | Discarded packets |
| A | 0 | 96 | 0 |
| B | 0 | 96 | 0 |
| C | 0 | 96 | 0 |
| D | 0 | 96 | 0 |
| Quadrant | Total seconds | Saturated seconds | Saturation percentage |
|---|---|---|---|
| A | 4857 | 7 | 0.144122% |
| B | 4857 | 53 | 1.091209% |
| C | 4857 | 12 | 0.247066% |
| D | 4857 | 564 | 11.612106% |
Noise dominated data is calculated using 1-second bins in cleaned event files. If a bin has >2000 counts, and if more than 50% of those come from <1% of pixels, then it is considered to be noise-dominated and hence unusable.
| Quadrant | # 1 sec bins | Bins with >0 counts | Bins with >2000 counts | High rate bins dominated by noise | Noise dominated (total time) | Noise dominated (detector-on time) | Marked lightcurve |
|---|---|---|---|---|---|---|---|
| A | 6980 | 4858 | 0 | 0 | 0.00% | 0.00% | 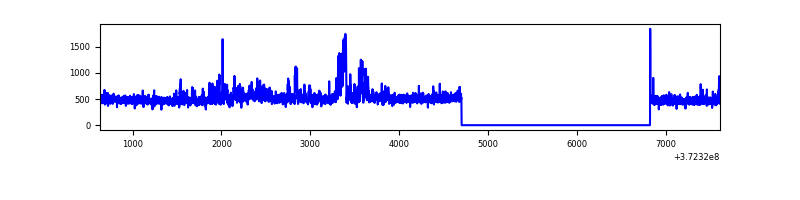 |
| B | 6980 | 4858 | 37 | 37 | 0.53% | 0.76% | 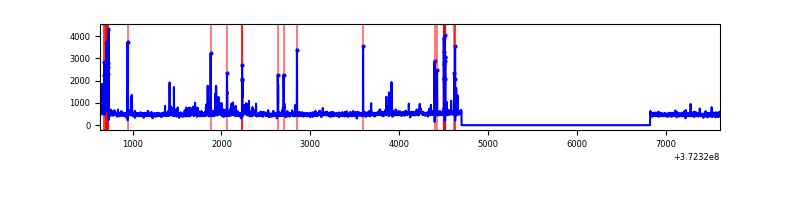 |
| C | 6980 | 4858 | 8 | 8 | 0.11% | 0.16% | 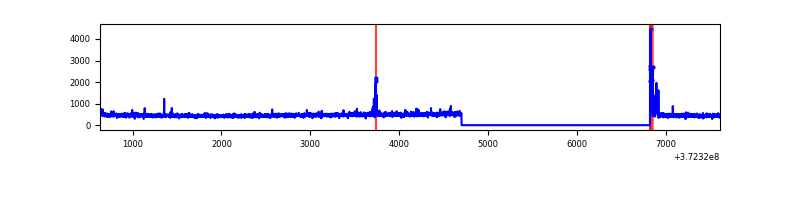 |
| D | 6980 | 4858 | 510 | 510 | 7.31% | 10.50% | 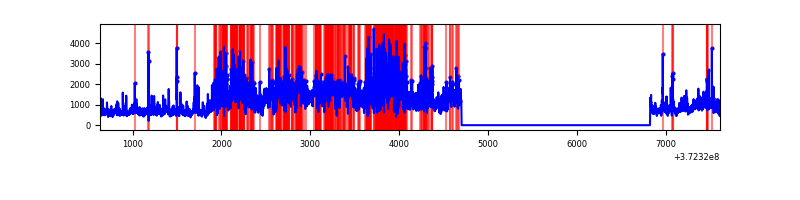 |
Top three noisy pixels from each quadrant. If the there are fewer than three noisy pixels in the level2.evt file, extra rows are filled as -1
| Pixel properties | Quadrant properties | ||||||
|---|---|---|---|---|---|---|---|
| Quadrant | DetID | PixID | Counts | Sigma | Mean | Median | Sigma |
| A | 12 | 16 | 218465 | 1824.18 | 593 | 584 | 119.4 |
| A | 12 | 194 | 38393 | 316.55 | 593 | 584 | 119.4 |
| A | 13 | 6 | 9082 | 71.15 | 593 | 584 | 119.4 |
| B | 12 | 1 | 139918 | 1255.25 | 588 | 577 | 111.0 |
| B | 3 | 32 | 62204 | 555.16 | 588 | 577 | 111.0 |
| B | 0 | 197 | 33291 | 294.7 | 588 | 577 | 111.0 |
| C | 0 | 10 | 54554 | 411.98 | 567 | 572 | 131.0 |
| C | 15 | 127 | 17399 | 128.42 | 567 | 572 | 131.0 |
| C | 14 | 67 | 7545 | 53.22 | 567 | 572 | 131.0 |
| D | 8 | 195 | 2706161 | 19836.53 | 545 | 534 | 136.4 |
| D | 2 | 250 | 684664 | 5015.76 | 545 | 534 | 136.4 |
| D | 12 | 17 | 219480 | 1605.22 | 545 | 534 | 136.4 |
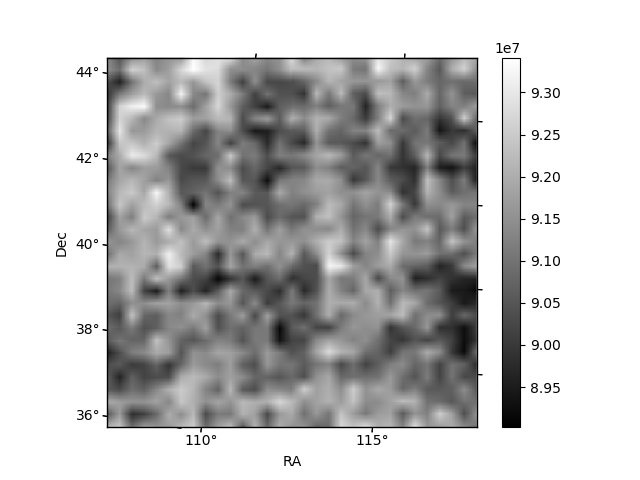
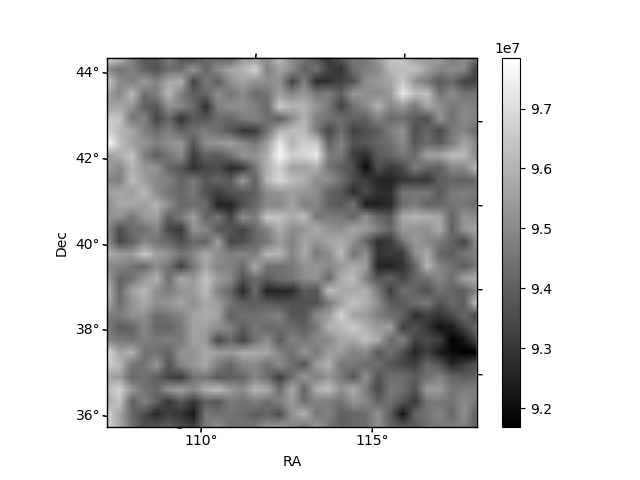
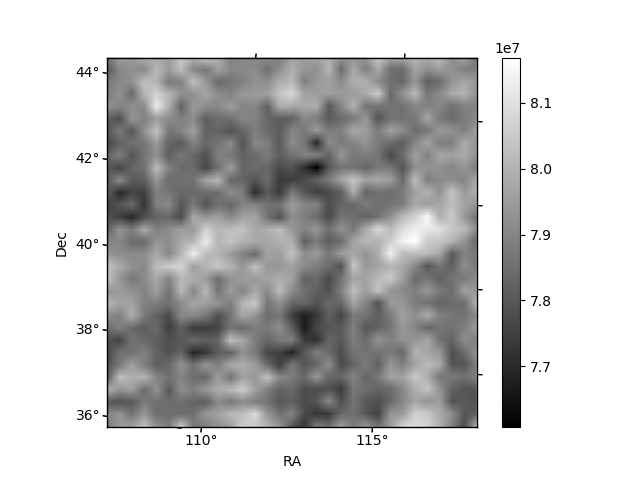
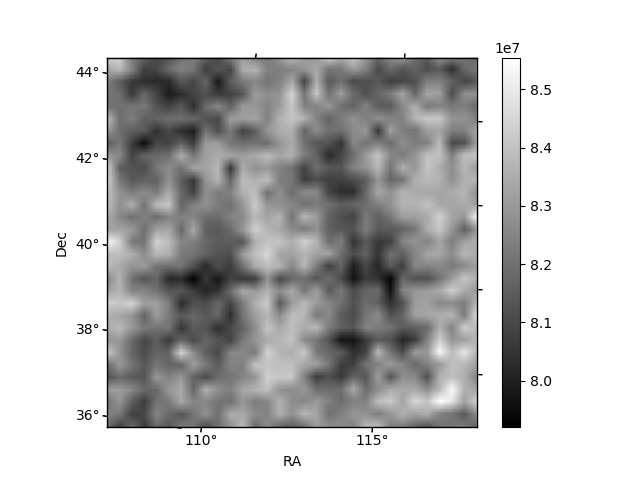
Histogram calculated using DETX and DETY for each event in the final _common_clean file
| Quadrant A | 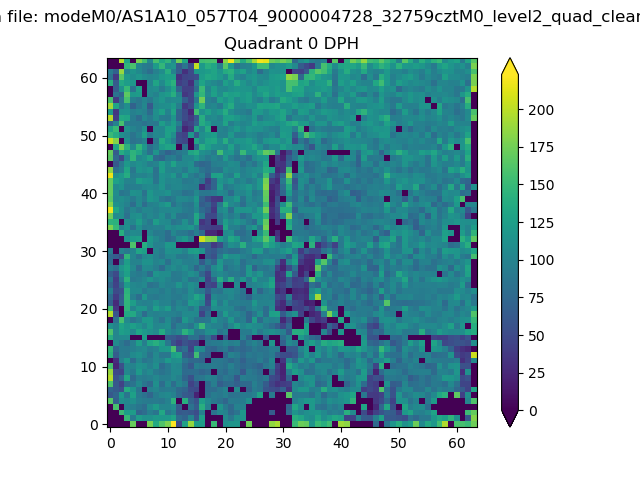 |
 |
Quadrant B |
|---|---|---|---|
| Quadrant D |  |
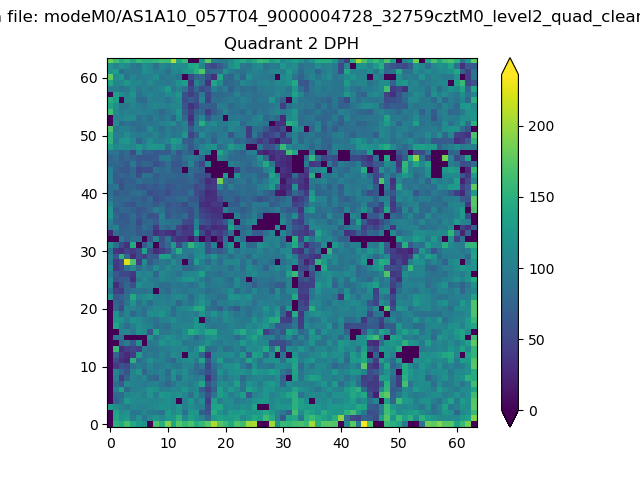 |
Quadrant C |
| Plot type | Count rate plots | Images |
|---|---|---|
| Comparison with Poisson distribution Blue bars denote a histogram of data divided into 1 sec bins. Red curve is a Poisson curve with rate = median count rate of data. |
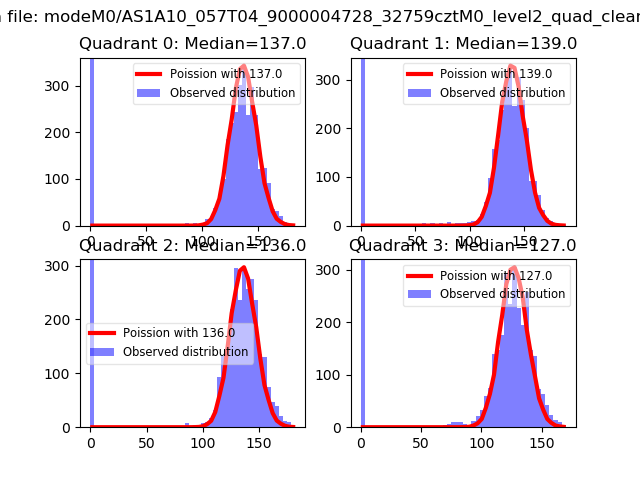 |
 |
| Quadrant-wise count rates Data is divided into 100 sec bins |
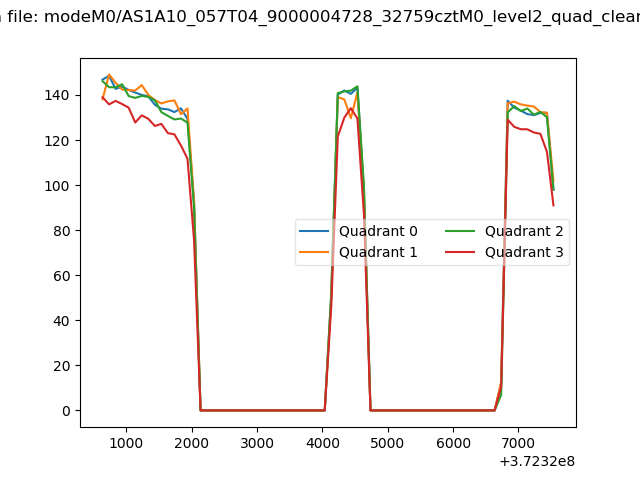 |
|
| Module-wise count rates for Quadrant A Data is divided into 100 sec bins |
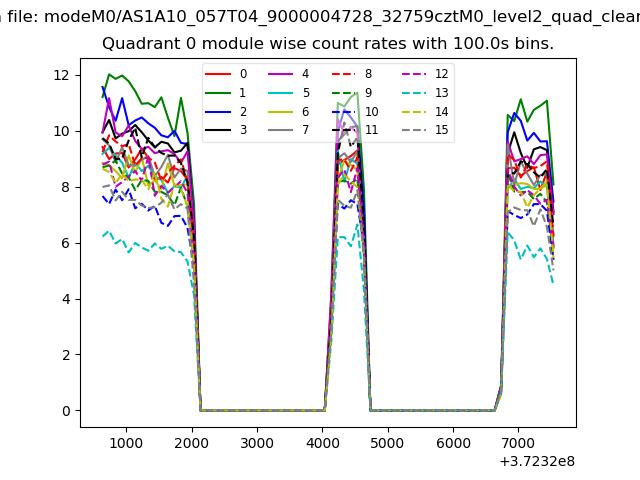 |
 |
| Module-wise count rates for Quadrant B Data is divided into 100 sec bins |
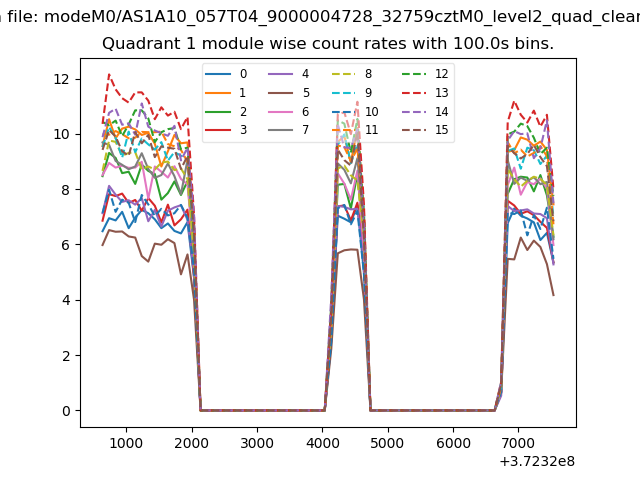 |
 |
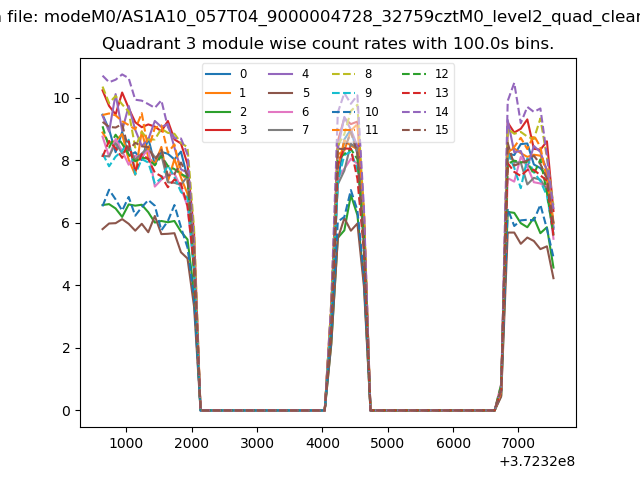
| Module-wise count rates for Quadrant C Data is divided into 100 sec bins |
 |
 |
| Module-wise count rates for Quadrant D Data is divided into 100 sec bins |
 |
 |
| Parameter | Plot |
|---|---|
| CZT HV Monitor | 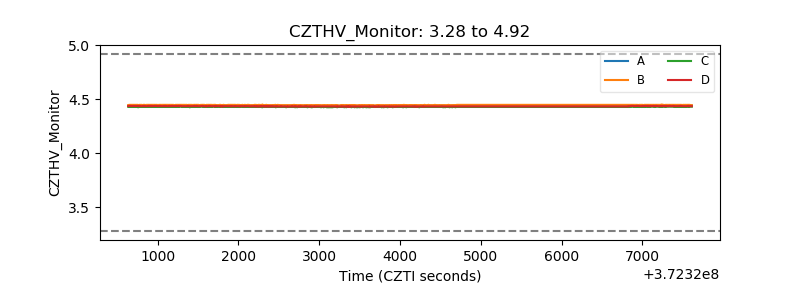 |
| D_VDD | 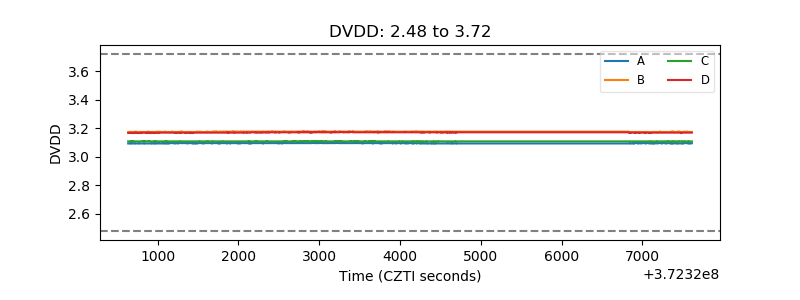 |
| Temperature 1 | 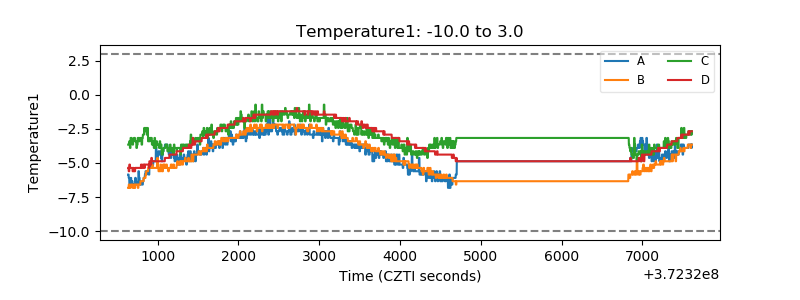 |
| Veto HV Monitor | 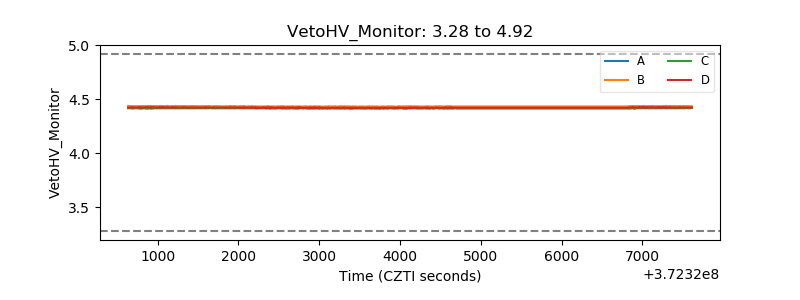 |
| Veto LLD | 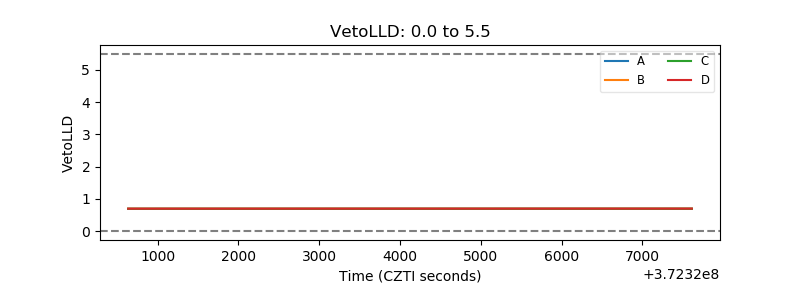 |
| Alpha Counter | 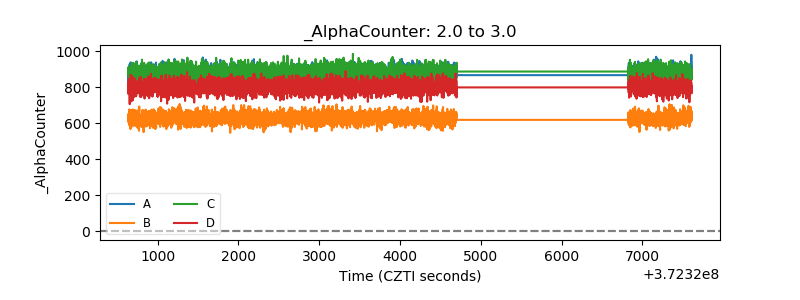 |
| _CPM_Rate | 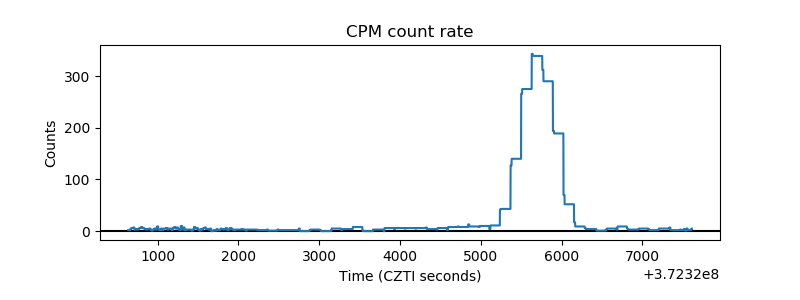 |
| CZT Counter | 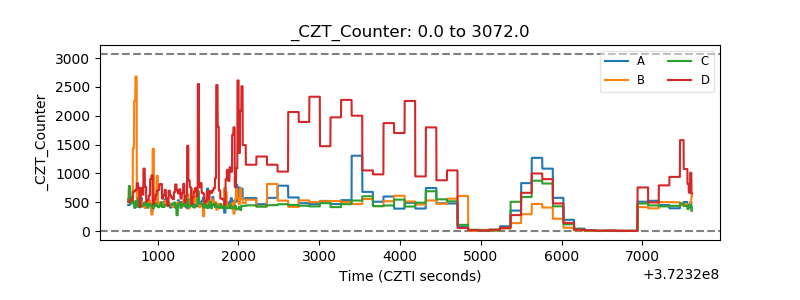 |
| +2.5 Volts monitor |  |
| +5 Volts monitor |  |
| _ROLL_ROT | 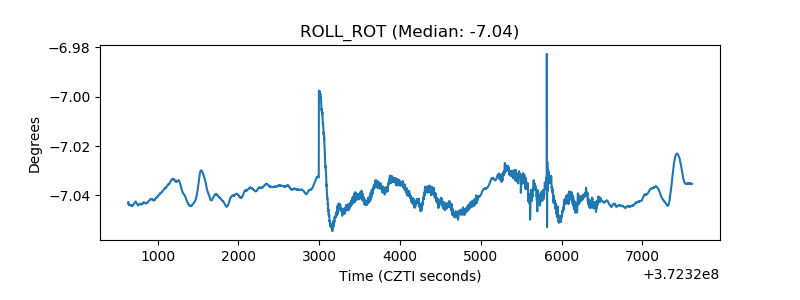 |
| _Roll_DEC | 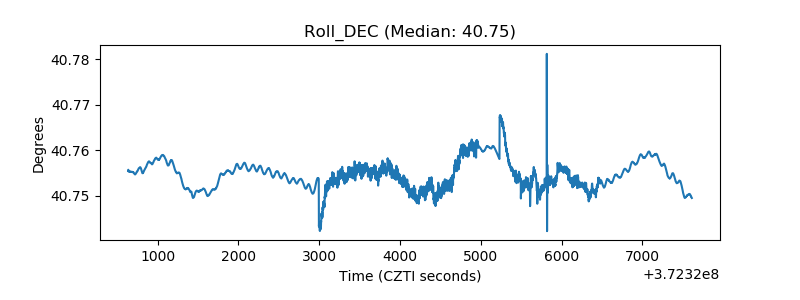 |
| _Roll_RA | 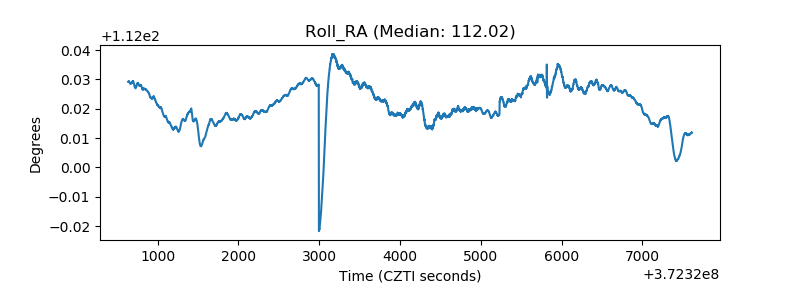 |
| Veto Counter |  |