| Param | Original file | Final file |
|---|---|---|
| Filename | modeM0/AS1A10_057T04_9000004728_32760cztM0_level2.evt | modeM0/AS1A10_057T04_9000004728_32760cztM0_level2_quad_clean.evt |
| Size (bytes) | 481,792,320 | 61,989,120 |
| Size | 459.5 MB | 59.1 MB |
| Events in quadrant A | 2,522,448 | 387,036 |
| Events in quadrant B | 2,603,142 | 391,740 |
| Events in quadrant C | 2,547,023 | 384,187 |
| Events in quadrant D | 6,568,677 | 352,028 |
| Mode M0 | |||
|---|---|---|---|
| Quadrant | BADHDUFLAG | Total packets | Discarded packets |
| A | 0 | 10668 | 2 |
| B | 0 | 10827 | 1 |
| C | 0 | 10983 | 1 |
| D | 0 | 23120 | 1 |
| Mode M9 | |||
|---|---|---|---|
| Quadrant | BADHDUFLAG | Total packets | Discarded packets |
| A | 0 | 26 | 0 |
| B | 0 | 26 | 0 |
| C | 0 | 26 | 0 |
| D | 0 | 27 | 0 |
| Mode SS | |||
|---|---|---|---|
| Quadrant | BADHDUFLAG | Total packets | Discarded packets |
| A | 0 | 104 | 0 |
| B | 0 | 104 | 0 |
| C | 0 | 104 | 0 |
| D | 0 | 104 | 0 |
| Quadrant | Total seconds | Saturated seconds | Saturation percentage |
|---|---|---|---|
| A | 5168 | 15 | 0.290248% |
| B | 5168 | 22 | 0.425697% |
| C | 5168 | 17 | 0.328947% |
| D | 5168 | 424 | 8.204334% |
Noise dominated data is calculated using 1-second bins in cleaned event files. If a bin has >2000 counts, and if more than 50% of those come from <1% of pixels, then it is considered to be noise-dominated and hence unusable.
| Quadrant | # 1 sec bins | Bins with >0 counts | Bins with >2000 counts | High rate bins dominated by noise | Noise dominated (total time) | Noise dominated (detector-on time) | Marked lightcurve |
|---|---|---|---|---|---|---|---|
| A | 7081 | 5169 | 9 | 9 | 0.13% | 0.17% | 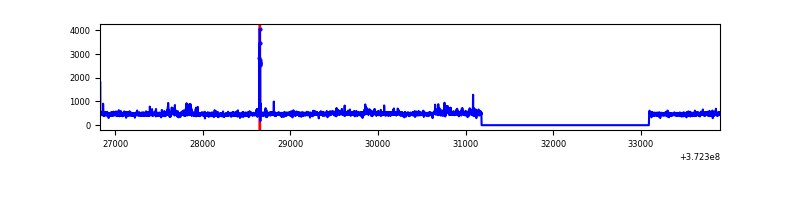 |
| B | 7081 | 5169 | 8 | 8 | 0.11% | 0.15% | 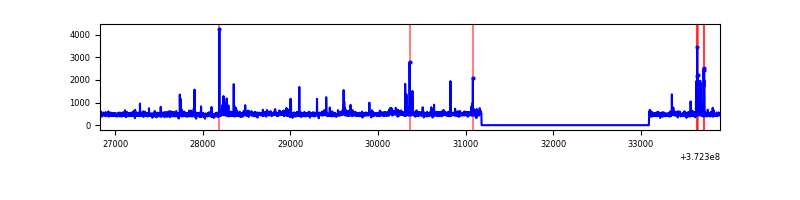 |
| C | 7081 | 5169 | 12 | 12 | 0.17% | 0.23% | 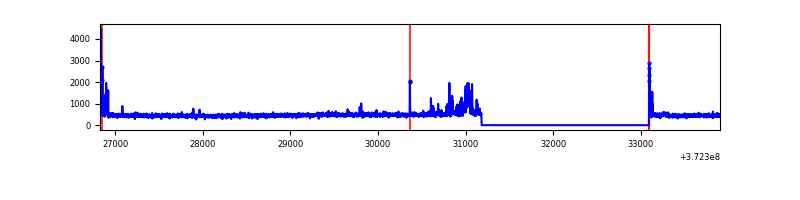 |
| D | 7081 | 5169 | 367 | 367 | 5.18% | 7.10% | 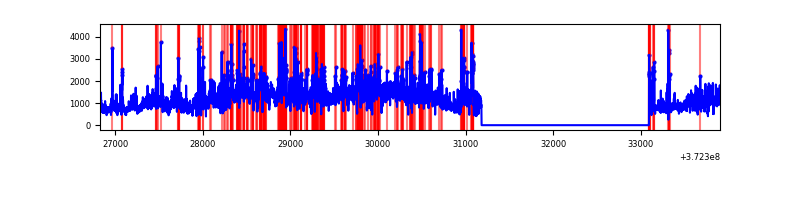 |
Top three noisy pixels from each quadrant. If the there are fewer than three noisy pixels in the level2.evt file, extra rows are filled as -1
| Pixel properties | Quadrant properties | ||||||
|---|---|---|---|---|---|---|---|
| Quadrant | DetID | PixID | Counts | Sigma | Mean | Median | Sigma |
| A | 12 | 16 | 68267 | 554.5 | 614 | 603 | 122.0 |
| A | 0 | 254 | 38698 | 312.18 | 614 | 603 | 122.0 |
| A | 12 | 194 | 15067 | 118.53 | 614 | 603 | 122.0 |
| B | 0 | 219 | 50696 | 430.36 | 612 | 598 | 116.4 |
| B | 0 | 197 | 41550 | 351.79 | 612 | 598 | 116.4 |
| B | 5 | 172 | 26130 | 219.33 | 612 | 598 | 116.4 |
| C | 3 | 233 | 144206 | 1040.26 | 592 | 597 | 138.1 |
| C | 0 | 10 | 61791 | 443.27 | 592 | 597 | 138.1 |
| C | 4 | 254 | 9082 | 61.46 | 592 | 597 | 138.1 |
| D | 8 | 195 | 3223583 | 22436.99 | 573 | 561 | 143.6 |
| D | 7 | 80 | 370469 | 2575.11 | 573 | 561 | 143.6 |
| D | 2 | 250 | 307718 | 2138.27 | 573 | 561 | 143.6 |
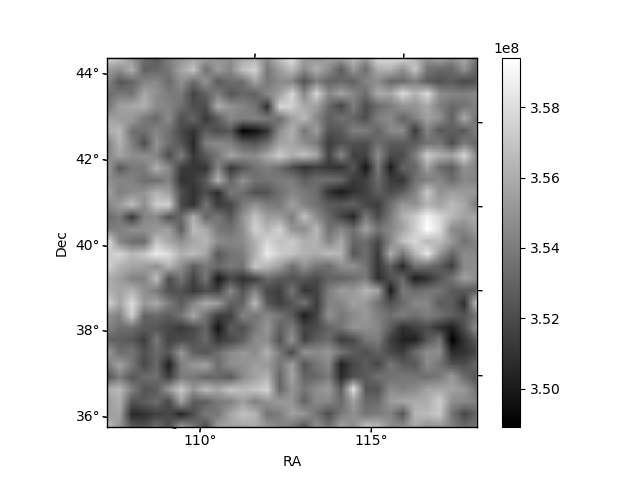
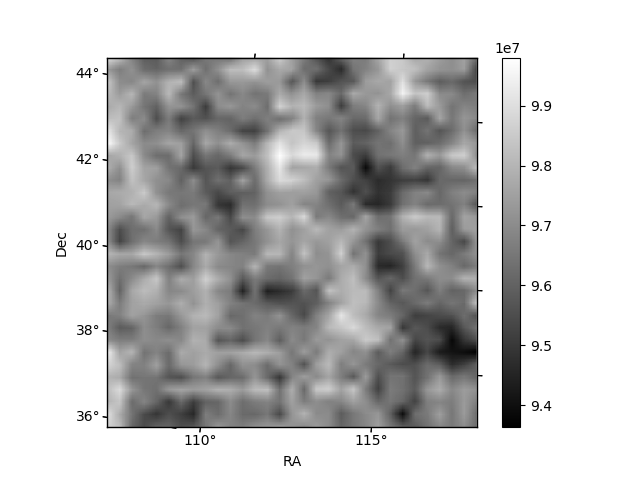
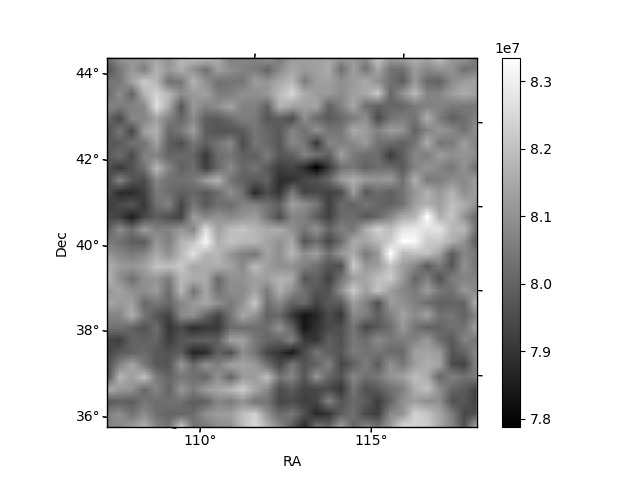
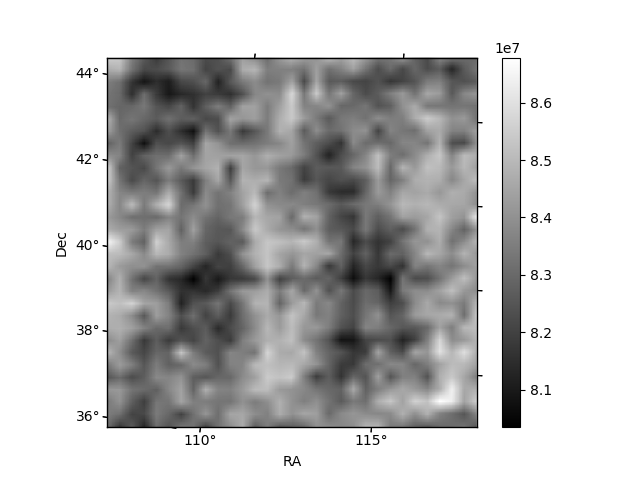
Histogram calculated using DETX and DETY for each event in the final _common_clean file
| Quadrant A | 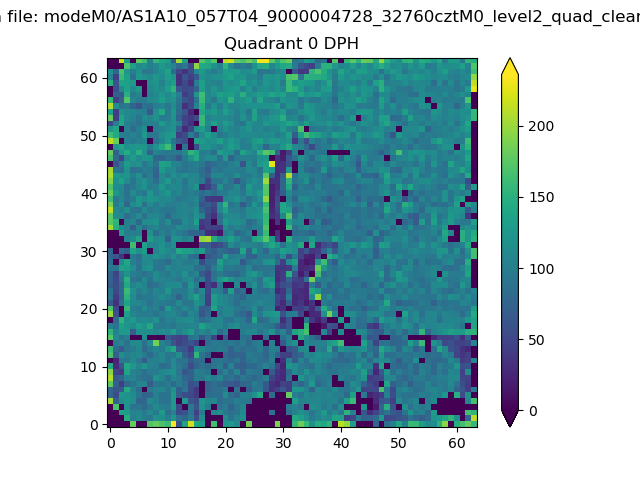 |
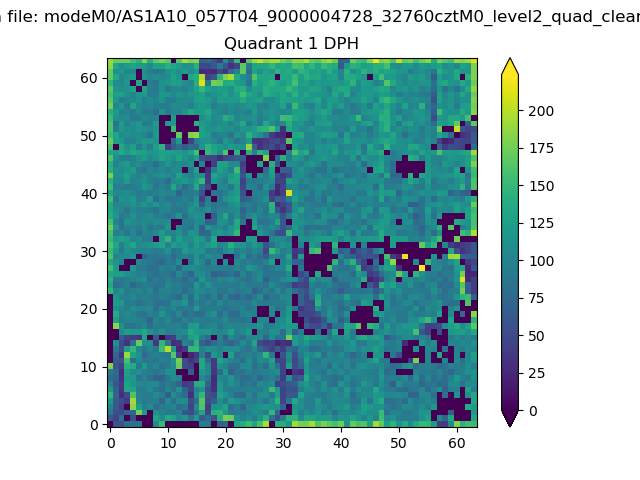 |
Quadrant B |
|---|---|---|---|
| Quadrant D | 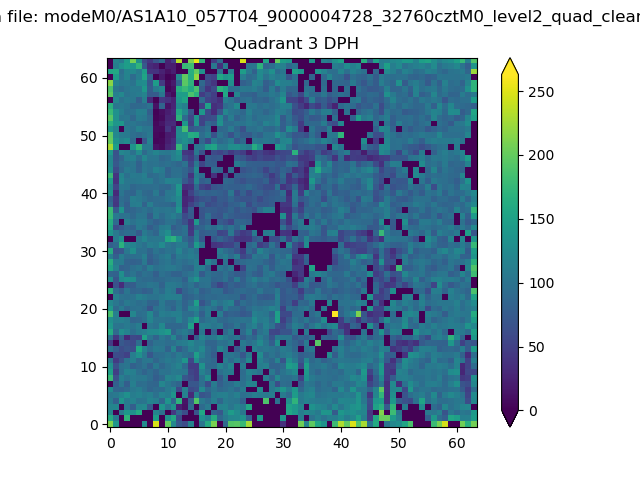 |
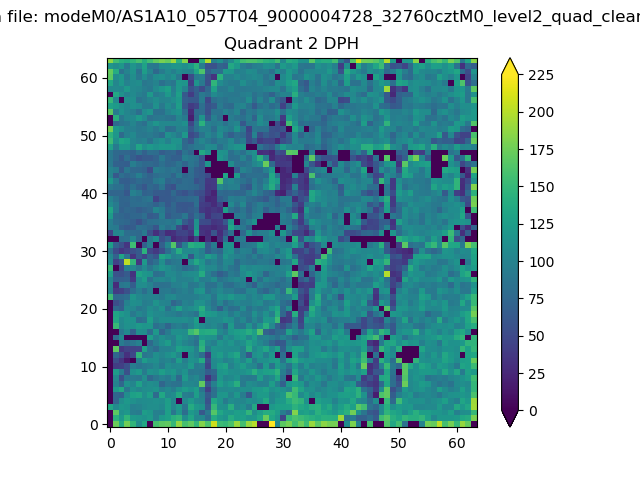 |
Quadrant C |
| Plot type | Count rate plots | Images |
|---|---|---|
| Comparison with Poisson distribution Blue bars denote a histogram of data divided into 1 sec bins. Red curve is a Poisson curve with rate = median count rate of data. |
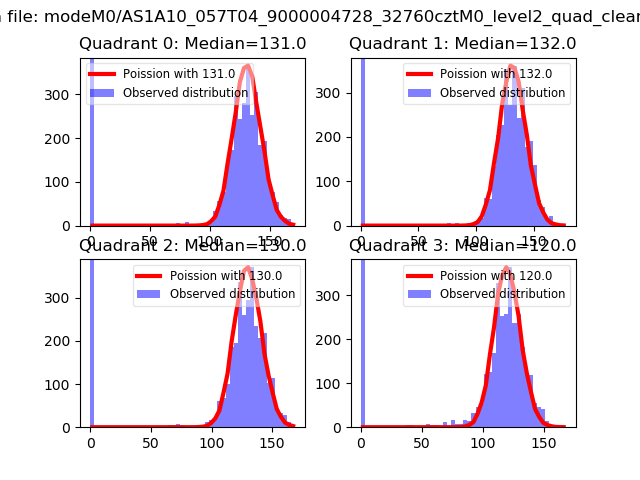 |
 |
| Quadrant-wise count rates Data is divided into 100 sec bins |
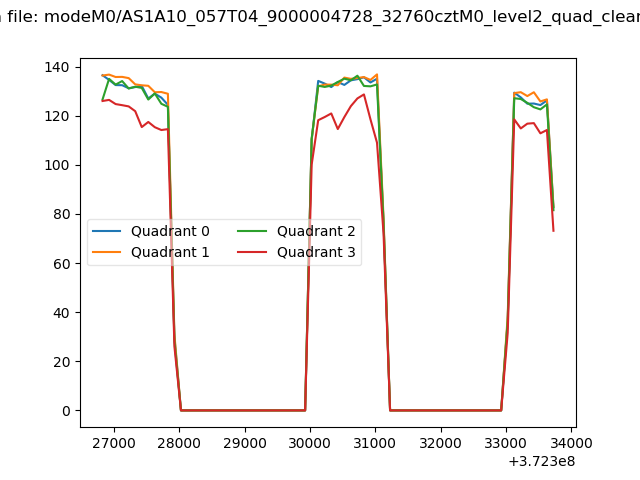 |
|
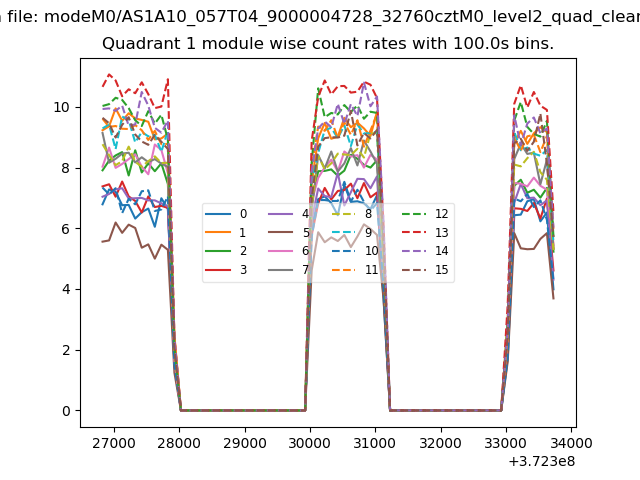
| Module-wise count rates for Quadrant A Data is divided into 100 sec bins |
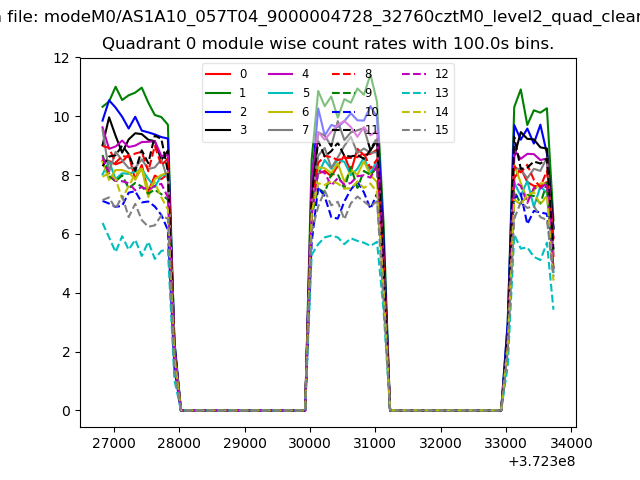 |
 |
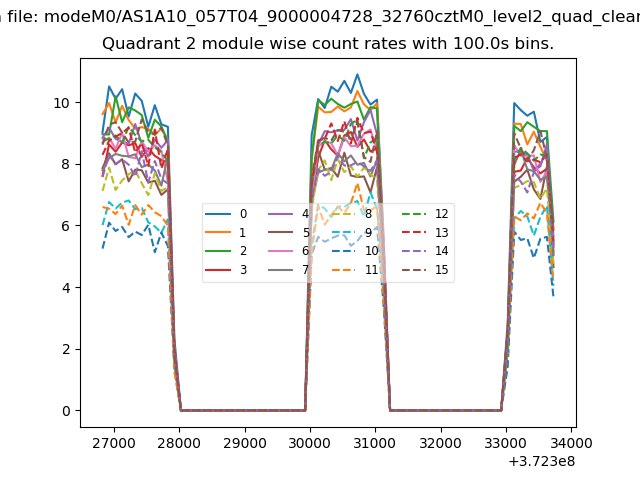
| Module-wise count rates for Quadrant B Data is divided into 100 sec bins |
 |
 |
| Module-wise count rates for Quadrant C Data is divided into 100 sec bins |
 |
 |
| Module-wise count rates for Quadrant D Data is divided into 100 sec bins |
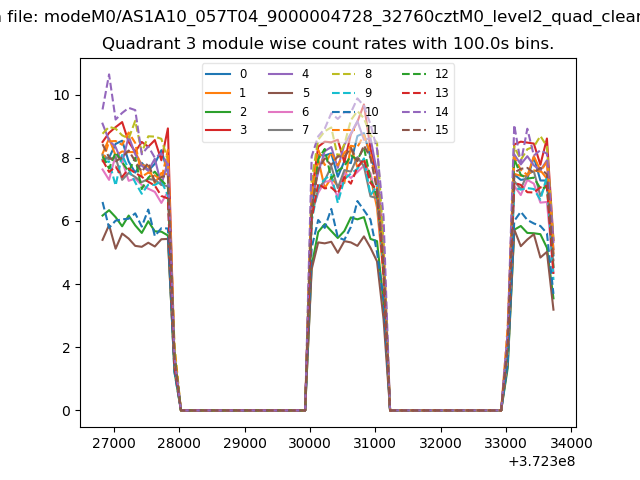 |
 |
| Parameter | Plot |
|---|---|
| CZT HV Monitor | 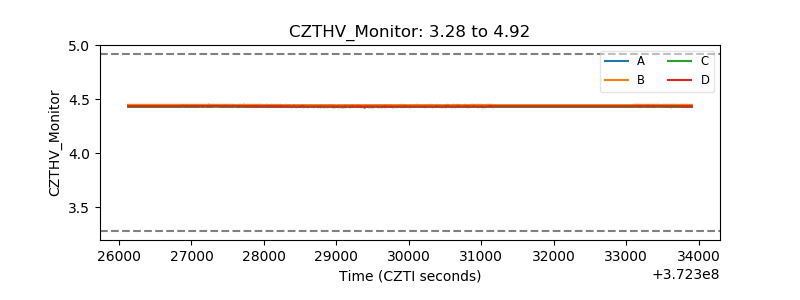 |
| D_VDD | 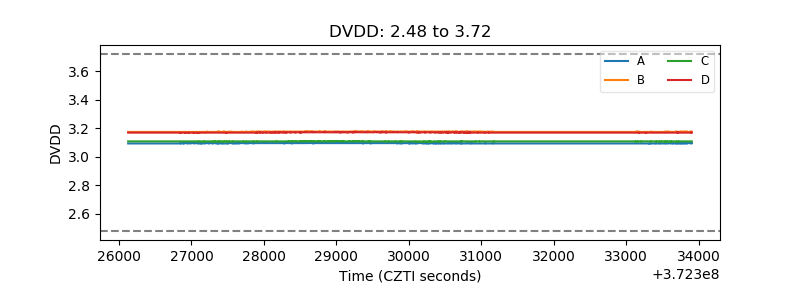 |
| Temperature 1 | 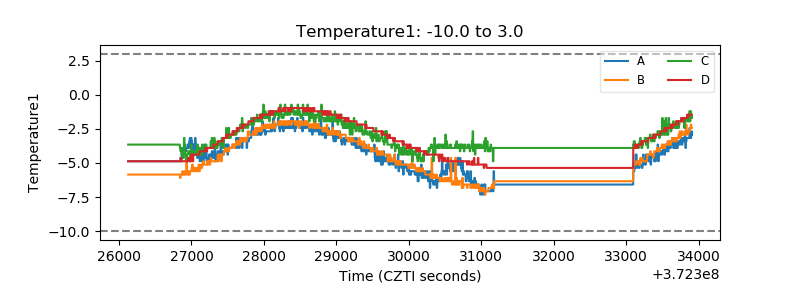 |
| Veto HV Monitor | 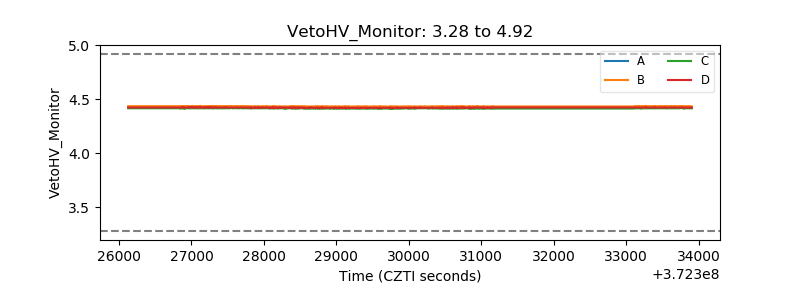 |
| Veto LLD | 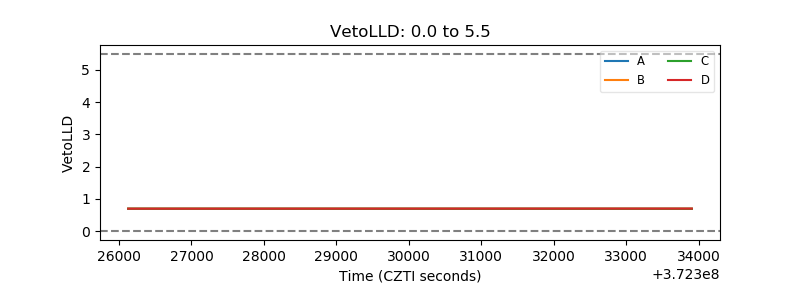 |
| Alpha Counter | 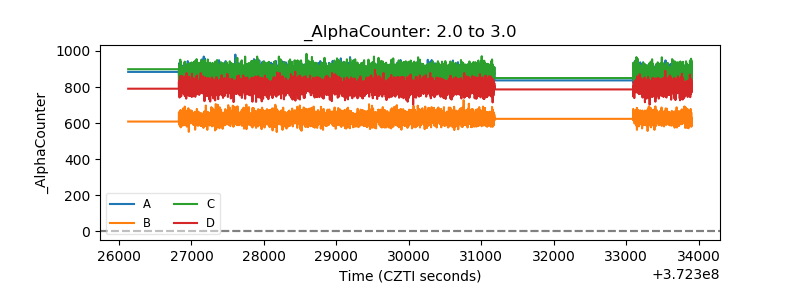 |
| _CPM_Rate | 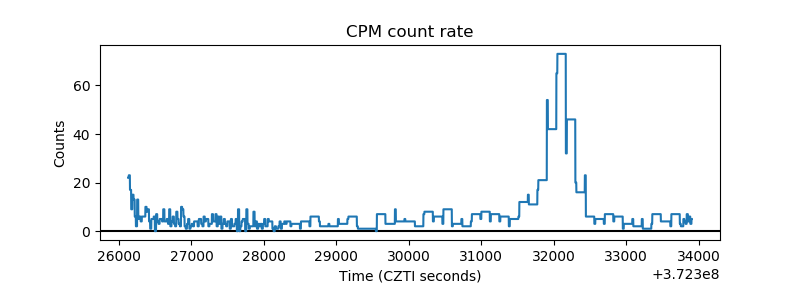 |
| CZT Counter | 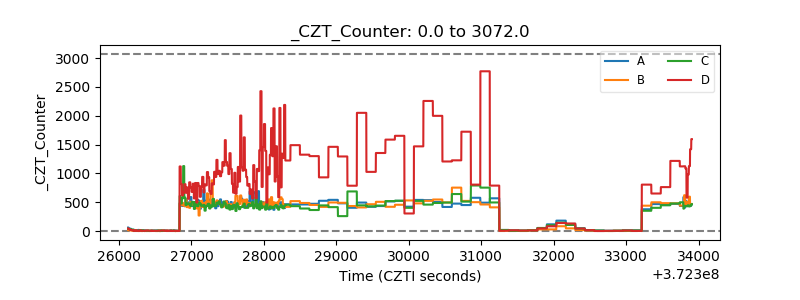 |
| +2.5 Volts monitor |  |
| +5 Volts monitor |  |
| _ROLL_ROT | 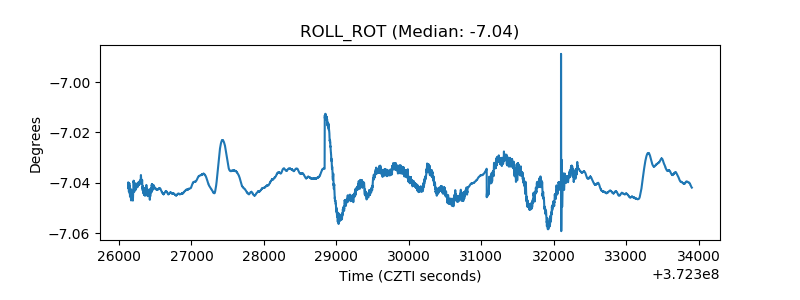 |
| _Roll_DEC | 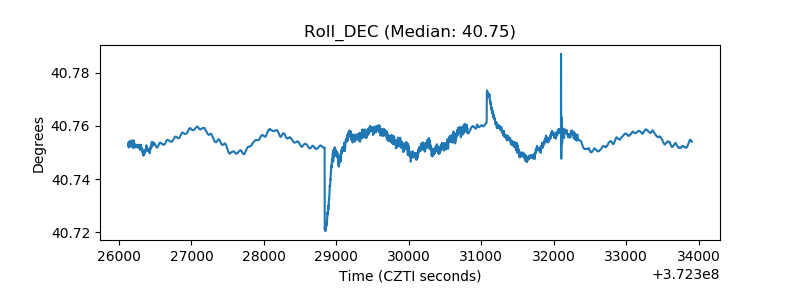 |
| _Roll_RA | 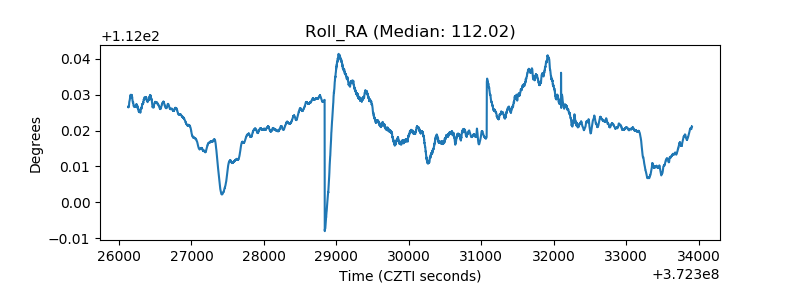 |
| Veto Counter | 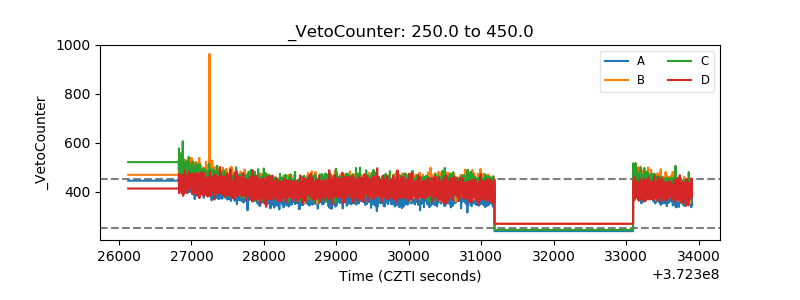 |