| Param | Original file | Final file |
|---|---|---|
| Filename | modeM0/AS1A10_057T04_9000004728_32762cztM0_level2.evt | modeM0/AS1A10_057T04_9000004728_32762cztM0_level2_quad_clean.evt |
| Size (bytes) | 600,603,840 | 59,495,040 |
| Size | 572.8 MB | 56.7 MB |
| Events in quadrant A | 2,873,320 | 356,696 |
| Events in quadrant B | 3,048,835 | 358,532 |
| Events in quadrant C | 2,792,054 | 356,800 |
| Events in quadrant D | 9,076,911 | 317,476 |
| Mode M0 | |||
|---|---|---|---|
| Quadrant | BADHDUFLAG | Total packets | Discarded packets |
| A | 0 | 12281 | 3 |
| B | 0 | 12670 | 2 |
| C | 0 | 12239 | 2 |
| D | 0 | 31093 | 2 |
| Mode M9 | |||
|---|---|---|---|
| Quadrant | BADHDUFLAG | Total packets | Discarded packets |
| A | 0 | 14 | 0 |
| B | 0 | 14 | 0 |
| C | 0 | 14 | 0 |
| D | 0 | 15 | 0 |
| Mode SS | |||
|---|---|---|---|
| Quadrant | BADHDUFLAG | Total packets | Discarded packets |
| A | 0 | 120 | 0 |
| B | 0 | 120 | 0 |
| C | 0 | 120 | 0 |
| D | 0 | 120 | 0 |
| Quadrant | Total seconds | Saturated seconds | Saturation percentage |
|---|---|---|---|
| A | 5889 | 12 | 0.203770% |
| B | 5889 | 50 | 0.849041% |
| C | 5889 | 33 | 0.560367% |
| D | 5889 | 1168 | 19.833588% |
Noise dominated data is calculated using 1-second bins in cleaned event files. If a bin has >2000 counts, and if more than 50% of those come from <1% of pixels, then it is considered to be noise-dominated and hence unusable.
| Quadrant | # 1 sec bins | Bins with >0 counts | Bins with >2000 counts | High rate bins dominated by noise | Noise dominated (total time) | Noise dominated (detector-on time) | Marked lightcurve |
|---|---|---|---|---|---|---|---|
| A | 7231 | 5890 | 5 | 5 | 0.07% | 0.08% | 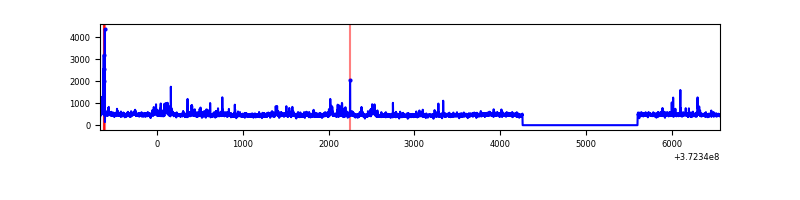 |
| B | 7231 | 5890 | 26 | 26 | 0.36% | 0.44% | 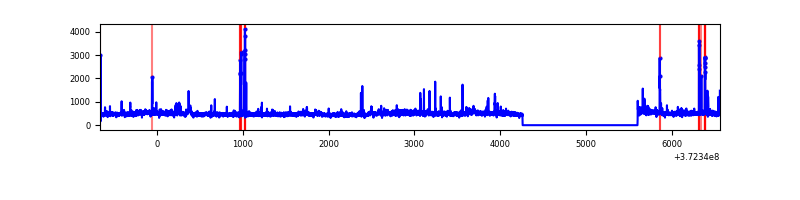 |
| C | 7231 | 5890 | 22 | 22 | 0.30% | 0.37% | 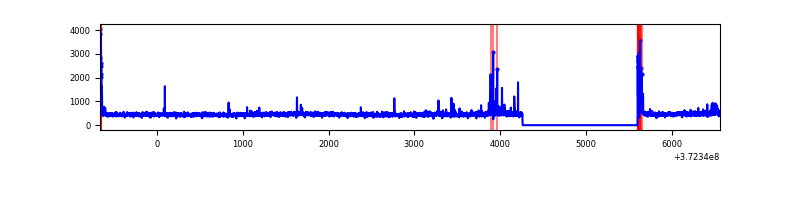 |
| D | 7231 | 5890 | 1156 | 1156 | 15.99% | 19.63% | 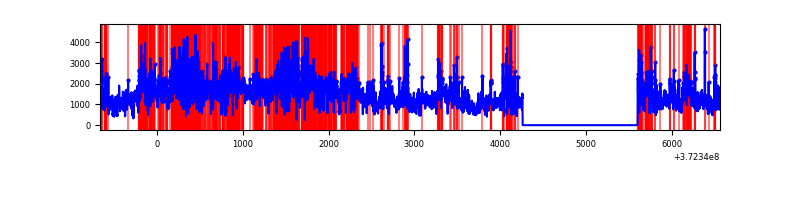 |
Top three noisy pixels from each quadrant. If the there are fewer than three noisy pixels in the level2.evt file, extra rows are filled as -1
| Pixel properties | Quadrant properties | ||||||
|---|---|---|---|---|---|---|---|
| Quadrant | DetID | PixID | Counts | Sigma | Mean | Median | Sigma |
| A | 12 | 16 | 141834 | 1018.93 | 688 | 675 | 138.5 |
| A | 0 | 254 | 28422 | 200.29 | 688 | 675 | 138.5 |
| A | 12 | 194 | 24331 | 170.76 | 688 | 675 | 138.5 |
| B | 0 | 219 | 131304 | 988.34 | 687 | 671 | 132.2 |
| B | 5 | 172 | 106856 | 803.37 | 687 | 671 | 132.2 |
| B | 0 | 197 | 57734 | 431.72 | 687 | 671 | 132.2 |
| C | 0 | 10 | 91737 | 579.58 | 667 | 672 | 157.1 |
| C | 8 | 35 | 55606 | 349.63 | 667 | 672 | 157.1 |
| C | 3 | 233 | 16064 | 97.96 | 667 | 672 | 157.1 |
| D | 8 | 195 | 4566055 | 29024.92 | 615 | 601 | 157.3 |
| D | 2 | 250 | 568419 | 3609.91 | 615 | 601 | 157.3 |
| D | 12 | 218 | 369066 | 2342.52 | 615 | 601 | 157.3 |
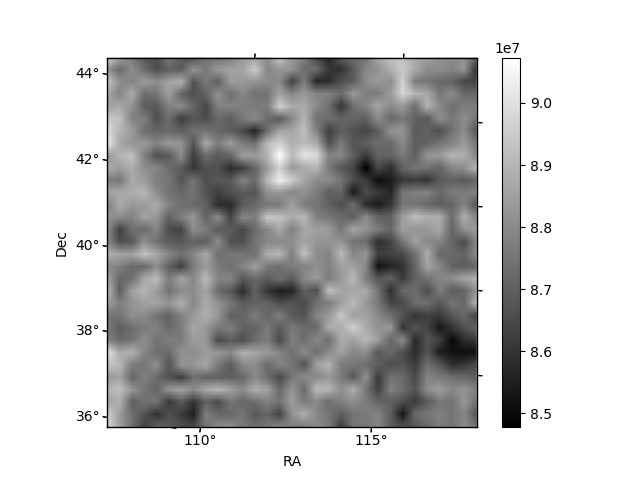
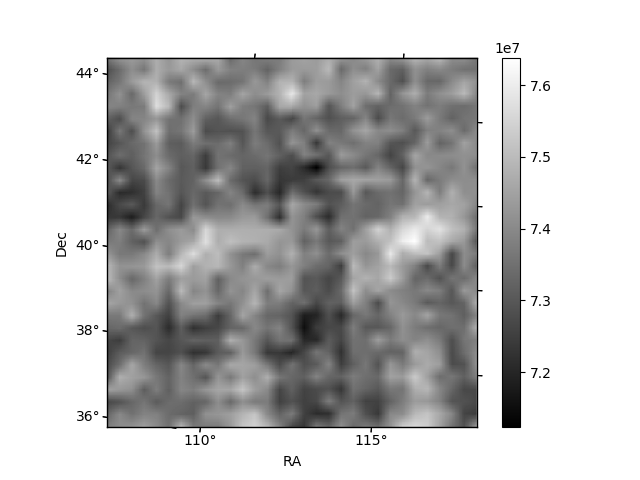
Histogram calculated using DETX and DETY for each event in the final _common_clean file
| Quadrant A |  |
 |
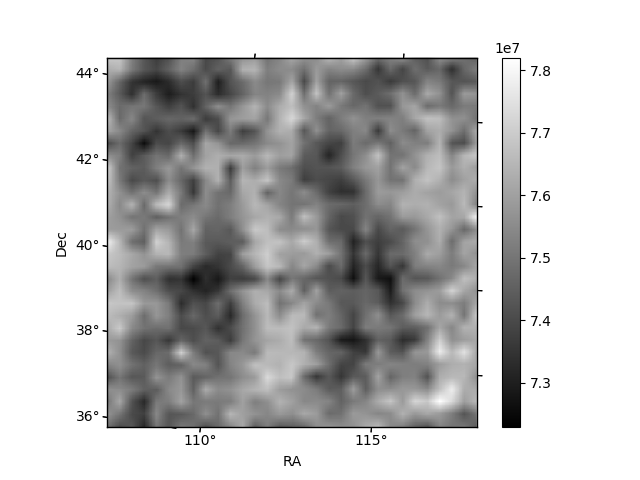
Quadrant B |
|---|---|---|---|
| Quadrant D | 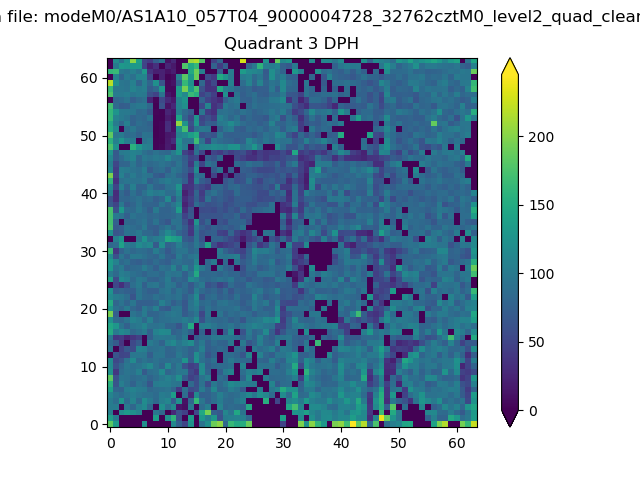 |
 |
Quadrant C |
| Plot type | Count rate plots | Images |
|---|---|---|
| Comparison with Poisson distribution Blue bars denote a histogram of data divided into 1 sec bins. Red curve is a Poisson curve with rate = median count rate of data. |
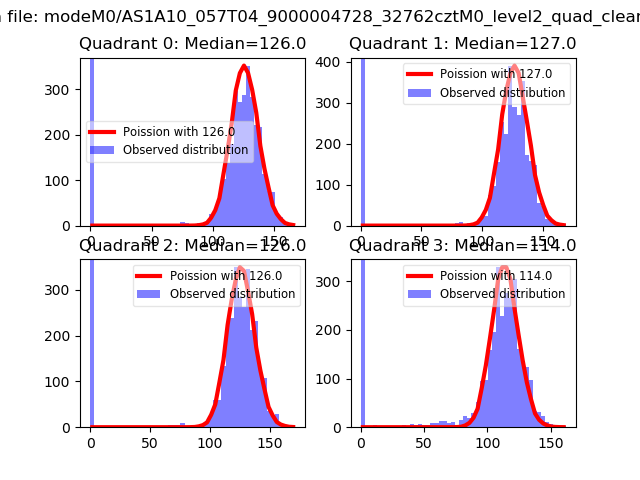 |
 |
| Quadrant-wise count rates Data is divided into 100 sec bins |
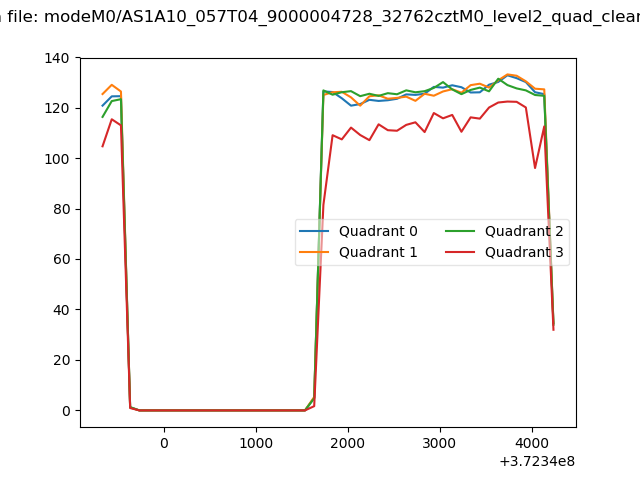 |
|
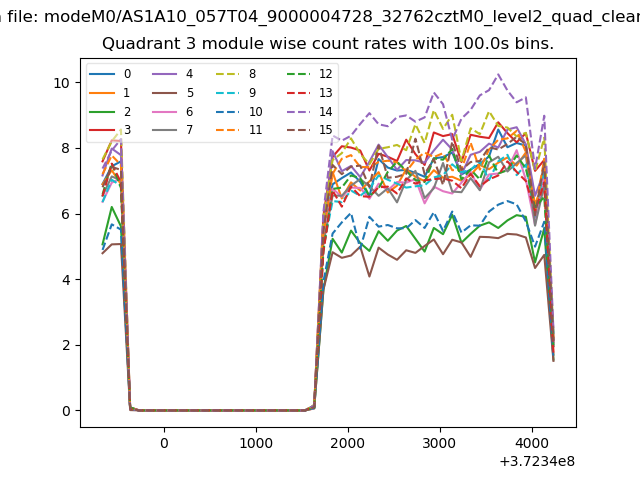
| Module-wise count rates for Quadrant A Data is divided into 100 sec bins |
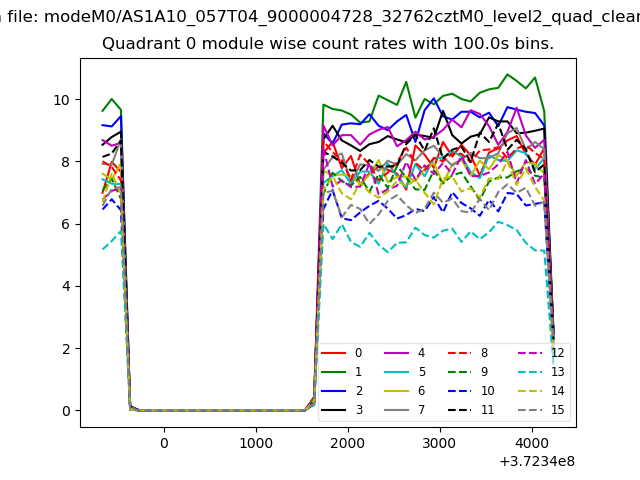 |
 |
| Module-wise count rates for Quadrant B Data is divided into 100 sec bins |
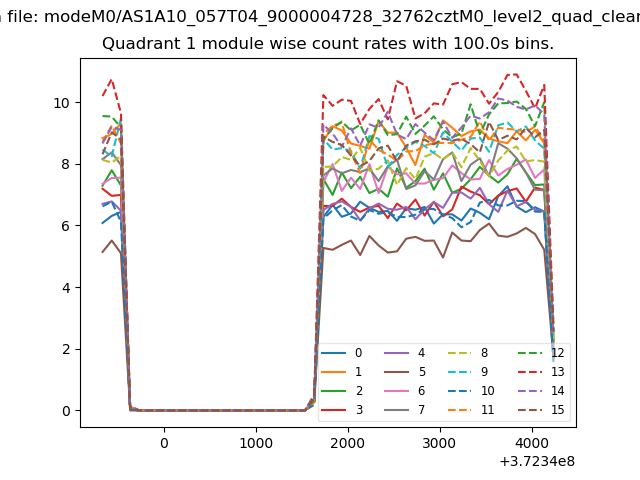 |
 |
| Module-wise count rates for Quadrant C Data is divided into 100 sec bins |
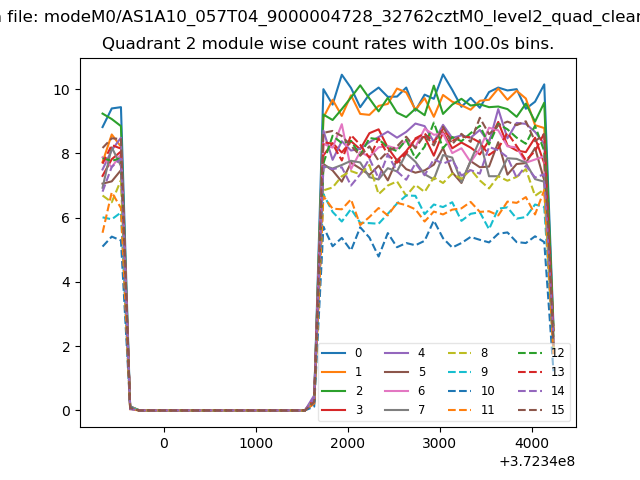 |
 |
| Module-wise count rates for Quadrant D Data is divided into 100 sec bins |
 |
 |
| Parameter | Plot |
|---|---|
| CZT HV Monitor |  |
| D_VDD | 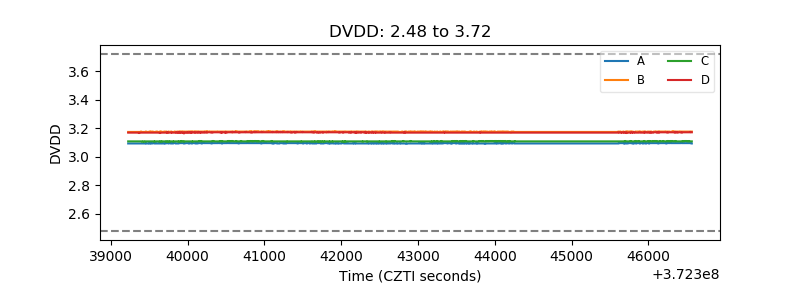 |
| Temperature 1 | 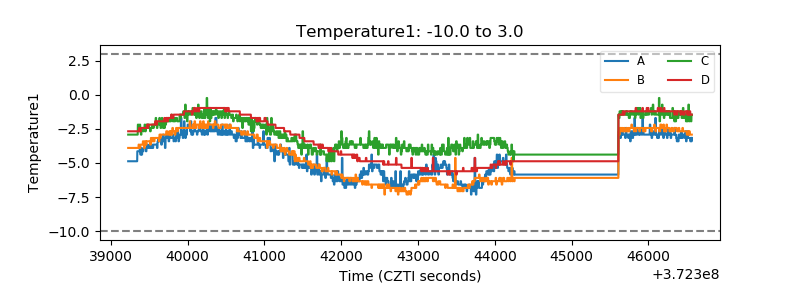 |
| Veto HV Monitor | 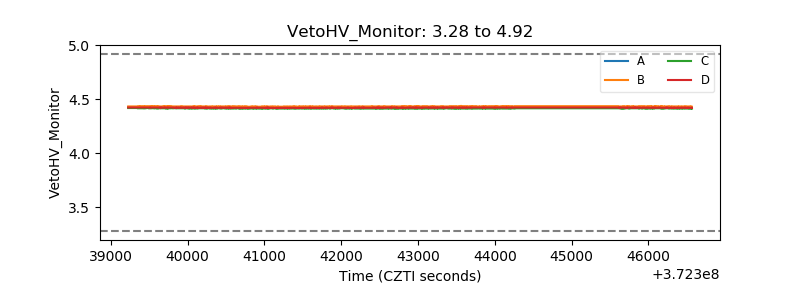 |
| Veto LLD | 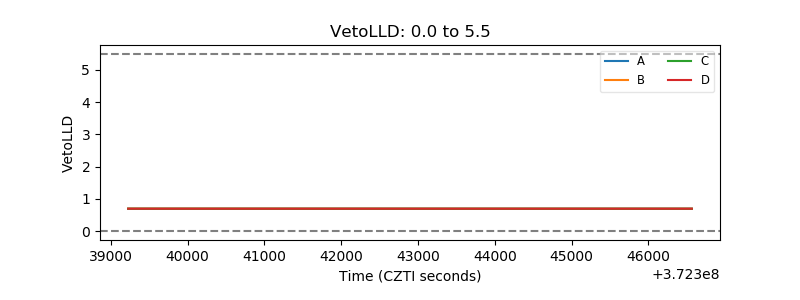 |
| Alpha Counter | 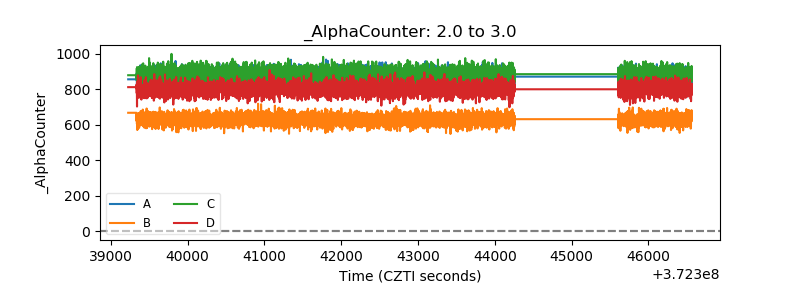 |
| _CPM_Rate | 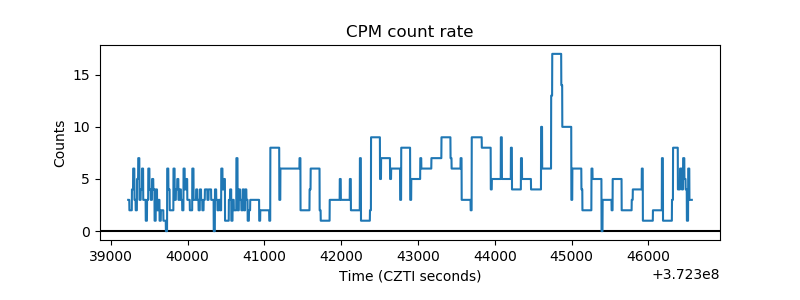 |
| CZT Counter | 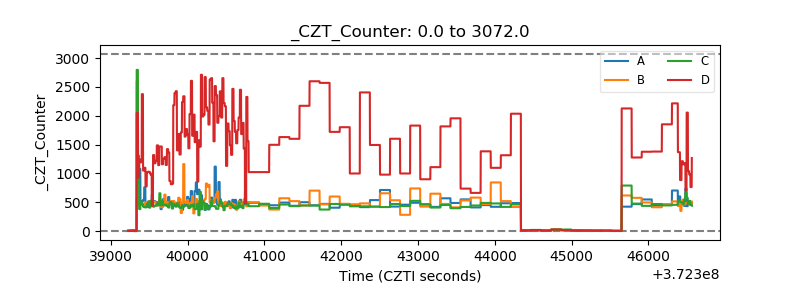 |
| +2.5 Volts monitor |  |
| +5 Volts monitor |  |
| _ROLL_ROT | 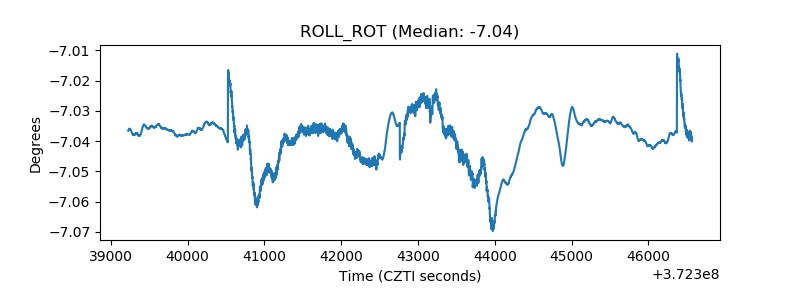 |
| _Roll_DEC | 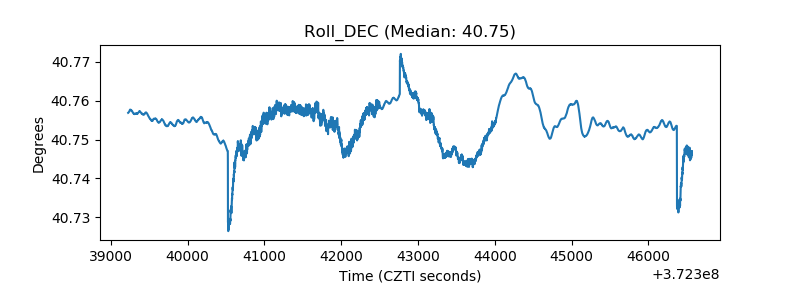 |
| _Roll_RA | 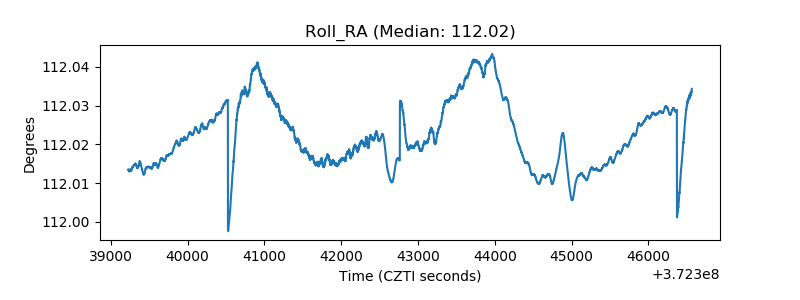 |
| Veto Counter | 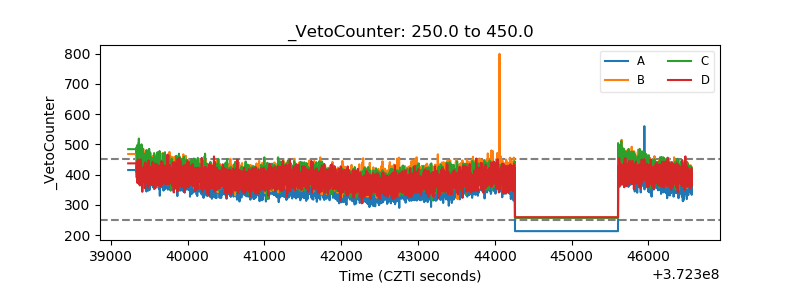 |