| Param | Original file | Final file |
|---|---|---|
| Filename | modeM0/AS1A10_057T04_9000004728_32763cztM0_level2.evt | modeM0/AS1A10_057T04_9000004728_32763cztM0_level2_quad_clean.evt |
| Size (bytes) | 591,298,560 | 62,386,560 |
| Size | 563.9 MB | 59.5 MB |
| Events in quadrant A | 2,887,182 | 378,554 |
| Events in quadrant B | 3,683,713 | 368,976 |
| Events in quadrant C | 2,885,012 | 377,623 |
| Events in quadrant D | 8,043,311 | 342,184 |
| Mode M0 | |||
|---|---|---|---|
| Quadrant | BADHDUFLAG | Total packets | Discarded packets |
| A | 0 | 12514 | 3 |
| B | 0 | 14733 | 2 |
| C | 0 | 12552 | 2 |
| D | 0 | 28172 | 2 |
| Mode M9 | |||
|---|---|---|---|
| Quadrant | BADHDUFLAG | Total packets | Discarded packets |
| A | 0 | 16 | 0 |
| B | 0 | 16 | 0 |
| C | 0 | 16 | 0 |
| D | 0 | 17 | 0 |
| Mode SS | |||
|---|---|---|---|
| Quadrant | BADHDUFLAG | Total packets | Discarded packets |
| A | 0 | 122 | 0 |
| B | 0 | 122 | 0 |
| C | 0 | 122 | 0 |
| D | 0 | 122 | 0 |
| Quadrant | Total seconds | Saturated seconds | Saturation percentage |
|---|---|---|---|
| A | 6035 | 17 | 0.281690% |
| B | 6035 | 193 | 3.198012% |
| C | 6035 | 32 | 0.530240% |
| D | 6035 | 1175 | 19.469760% |
Noise dominated data is calculated using 1-second bins in cleaned event files. If a bin has >2000 counts, and if more than 50% of those come from <1% of pixels, then it is considered to be noise-dominated and hence unusable.
| Quadrant | # 1 sec bins | Bins with >0 counts | Bins with >2000 counts | High rate bins dominated by noise | Noise dominated (total time) | Noise dominated (detector-on time) | Marked lightcurve |
|---|---|---|---|---|---|---|---|
| A | 7318 | 6037 | 5 | 5 | 0.07% | 0.08% | 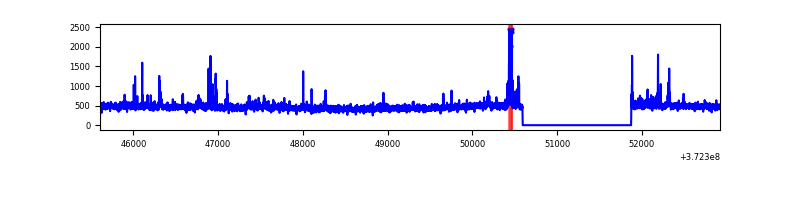 |
| B | 7318 | 6037 | 124 | 124 | 1.69% | 2.05% | 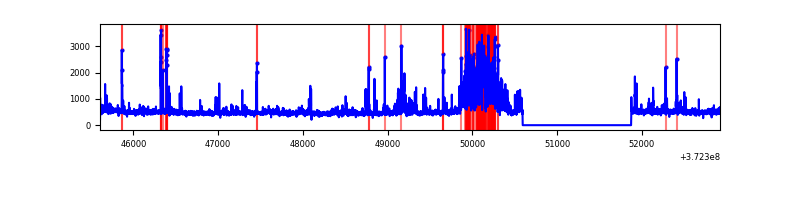 |
| C | 7318 | 6037 | 19 | 19 | 0.26% | 0.31% | 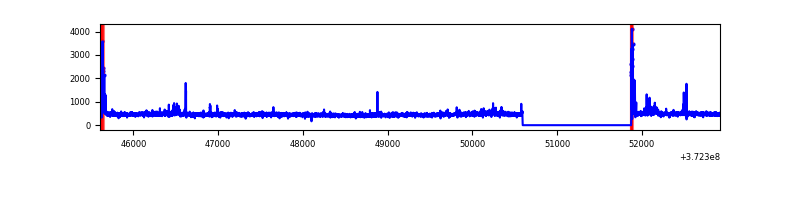 |
| D | 7318 | 6037 | 1012 | 1012 | 13.83% | 16.76% | 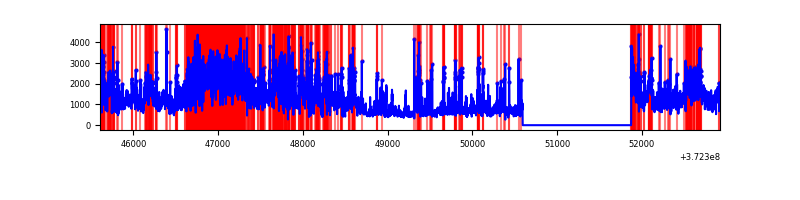 |
Top three noisy pixels from each quadrant. If the there are fewer than three noisy pixels in the level2.evt file, extra rows are filled as -1
| Pixel properties | Quadrant properties | ||||||
|---|---|---|---|---|---|---|---|
| Quadrant | DetID | PixID | Counts | Sigma | Mean | Median | Sigma |
| A | 12 | 16 | 113394 | 786.47 | 705 | 690 | 143.3 |
| A | 12 | 194 | 19977 | 134.59 | 705 | 690 | 143.3 |
| A | 7 | 16 | 17037 | 114.07 | 705 | 690 | 143.3 |
| B | 10 | 246 | 593734 | 4393.1 | 703 | 686 | 135.0 |
| B | 0 | 197 | 76015 | 558.01 | 703 | 686 | 135.0 |
| B | 5 | 172 | 70939 | 520.41 | 703 | 686 | 135.0 |
| C | 0 | 10 | 115833 | 721.45 | 686 | 691 | 159.6 |
| C | 8 | 79 | 41551 | 256.02 | 686 | 691 | 159.6 |
| C | 15 | 159 | 18951 | 114.41 | 686 | 691 | 159.6 |
| D | 8 | 195 | 2827201 | 17668.27 | 633 | 618 | 160.0 |
| D | 12 | 218 | 1371028 | 8566.09 | 633 | 618 | 160.0 |
| D | 2 | 250 | 592462 | 3699.47 | 633 | 618 | 160.0 |
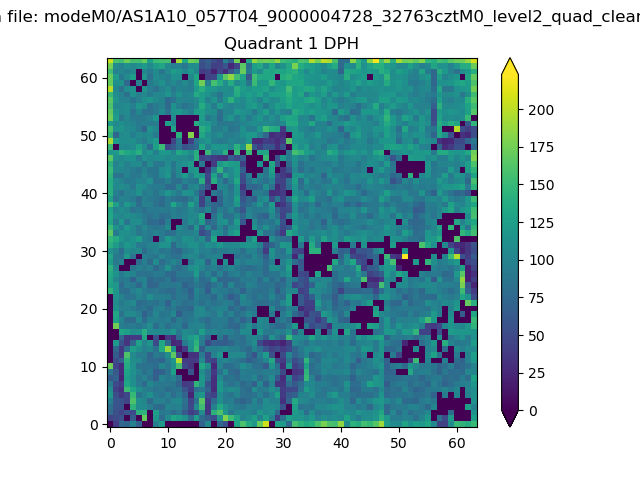
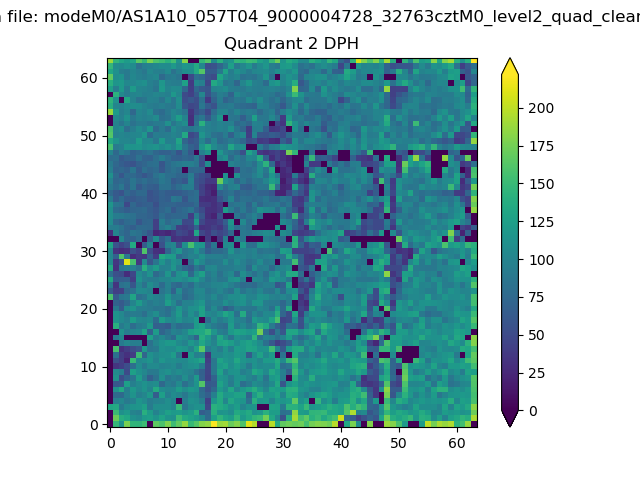
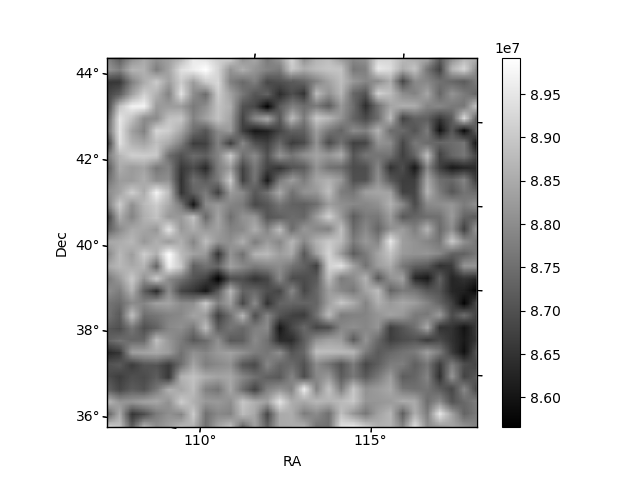
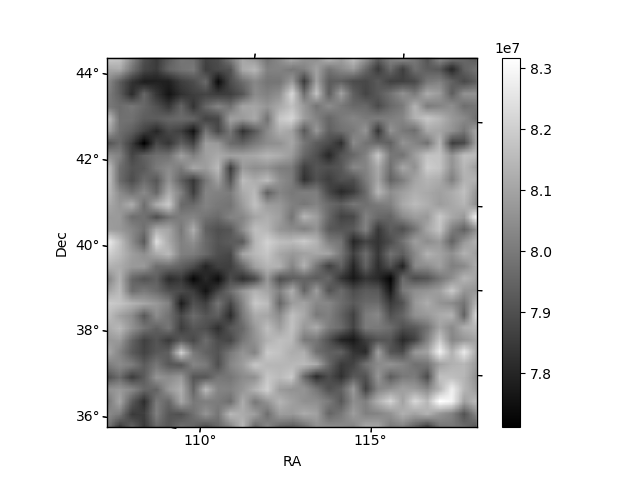
Histogram calculated using DETX and DETY for each event in the final _common_clean file
| Quadrant A |  |
 |
Quadrant B |
|---|---|---|---|
| Quadrant D | 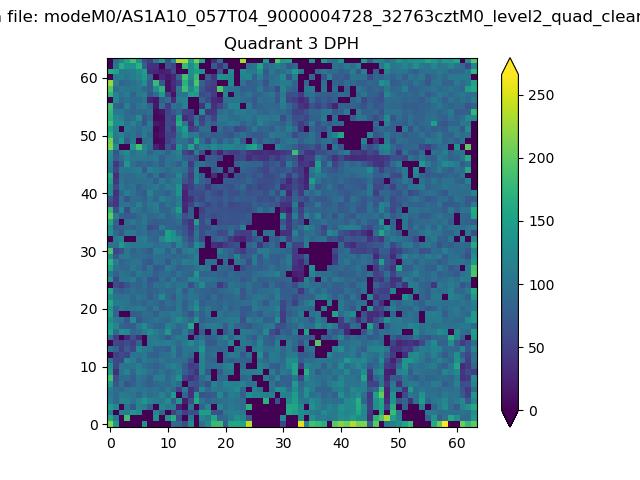 |
 |
Quadrant C |
| Plot type | Count rate plots | Images |
|---|---|---|
| Comparison with Poisson distribution Blue bars denote a histogram of data divided into 1 sec bins. Red curve is a Poisson curve with rate = median count rate of data. |
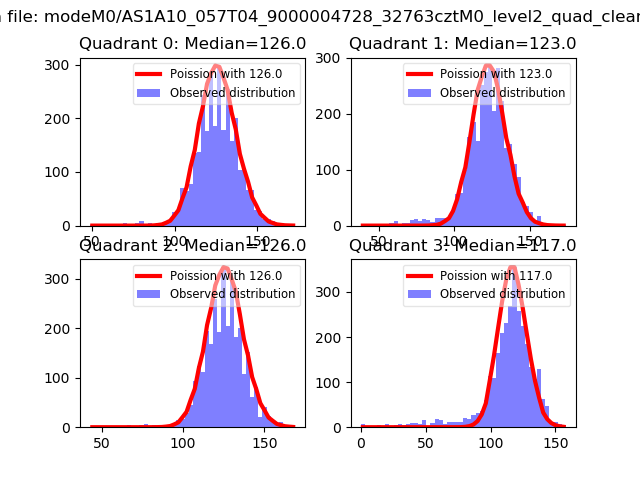 |
 |
| Quadrant-wise count rates Data is divided into 100 sec bins |
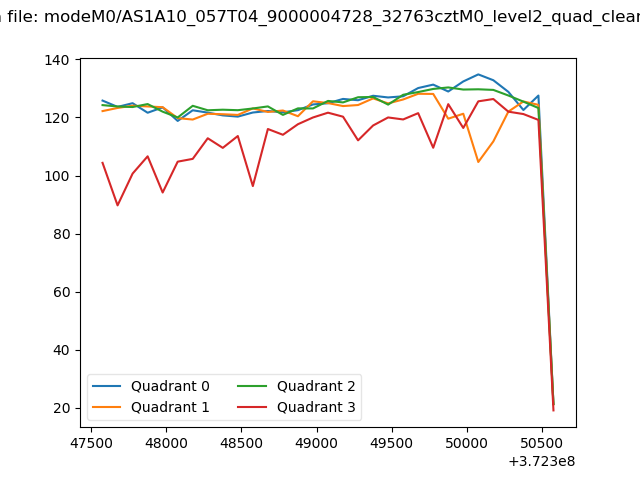 |
|
| Module-wise count rates for Quadrant A Data is divided into 100 sec bins |
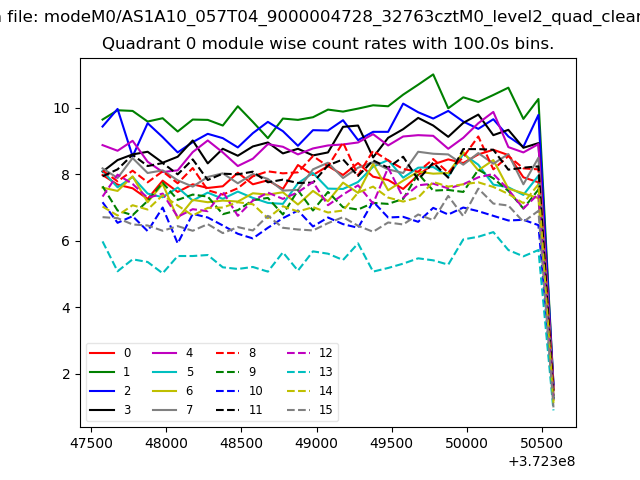 |
 |
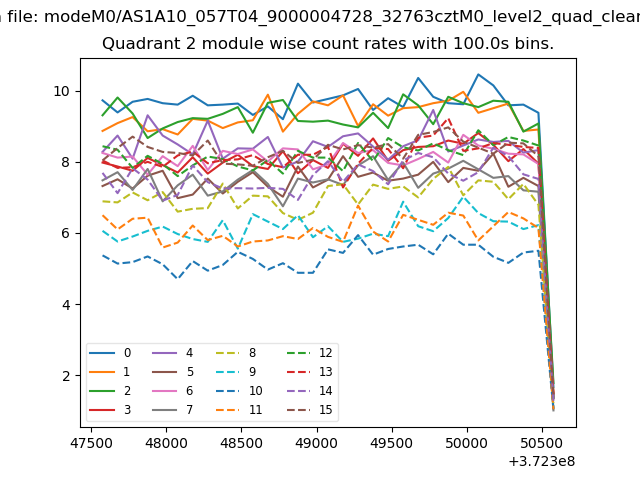
| Module-wise count rates for Quadrant B Data is divided into 100 sec bins |
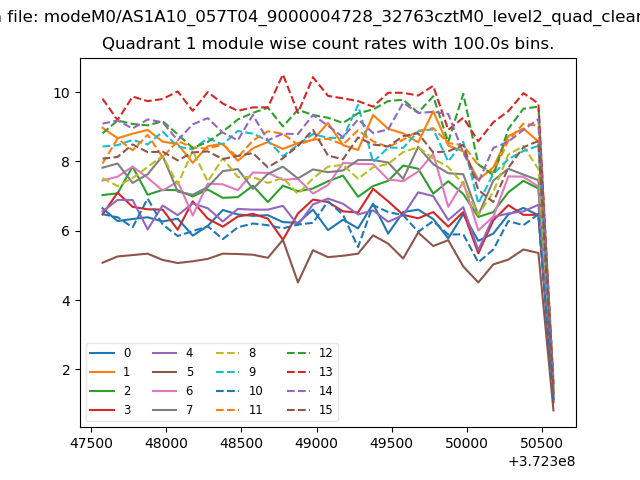 |
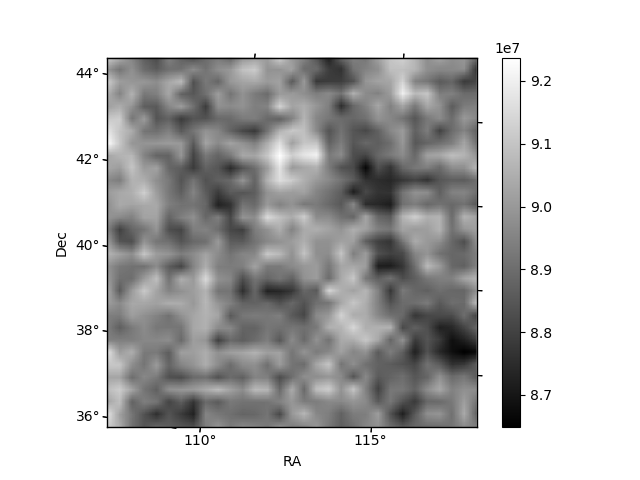 |
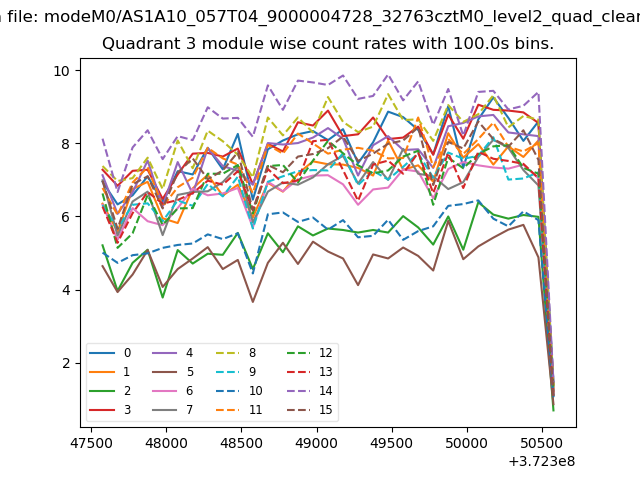
| Module-wise count rates for Quadrant C Data is divided into 100 sec bins |
 |
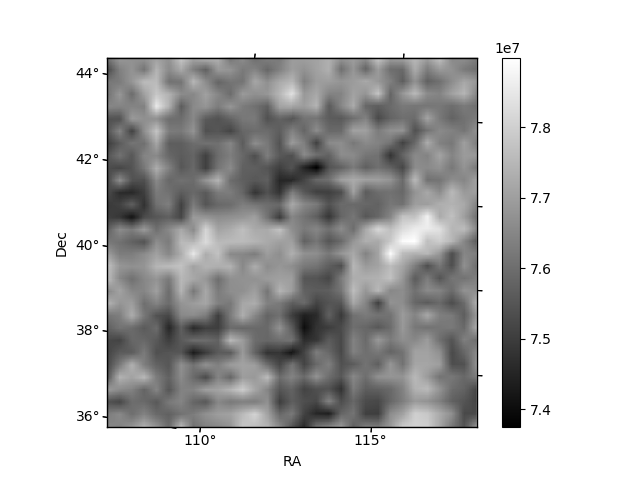 |
| Module-wise count rates for Quadrant D Data is divided into 100 sec bins |
 |
 |
| Parameter | Plot |
|---|---|
| CZT HV Monitor | 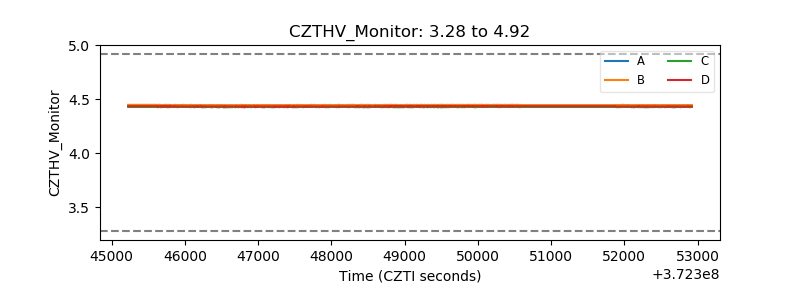 |
| D_VDD | 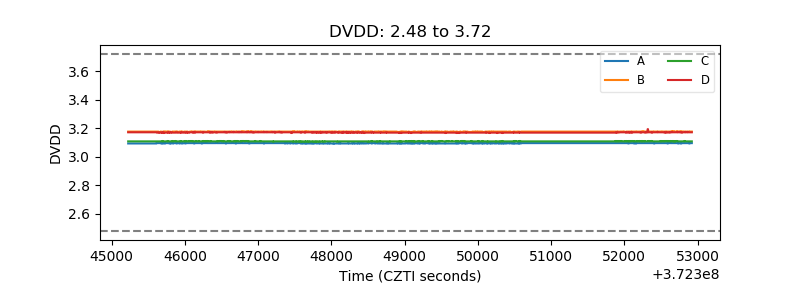 |
| Temperature 1 | 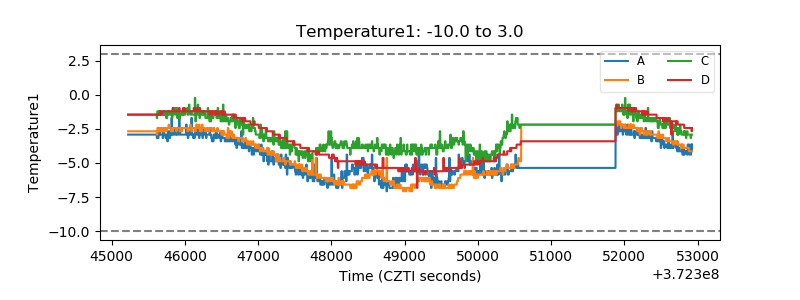 |
| Veto HV Monitor | 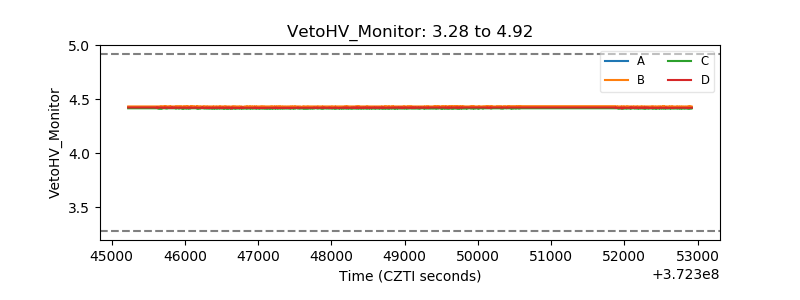 |
| Veto LLD | 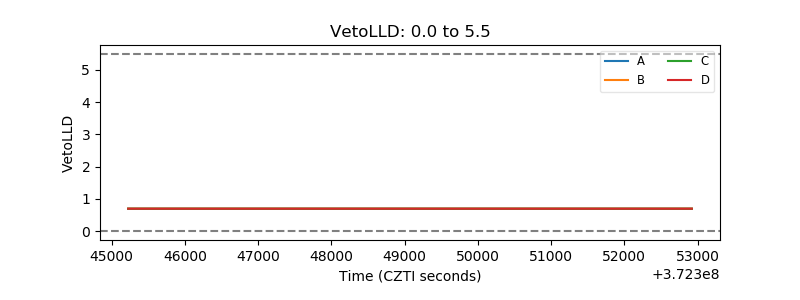 |
| Alpha Counter | 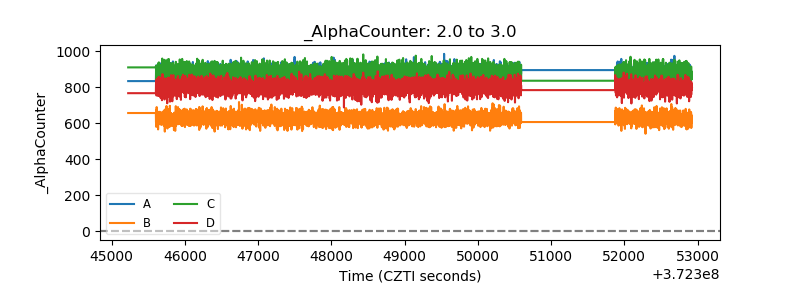 |
| _CPM_Rate | 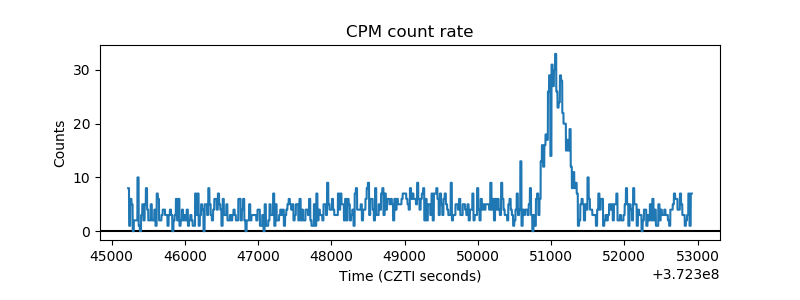 |
| CZT Counter | 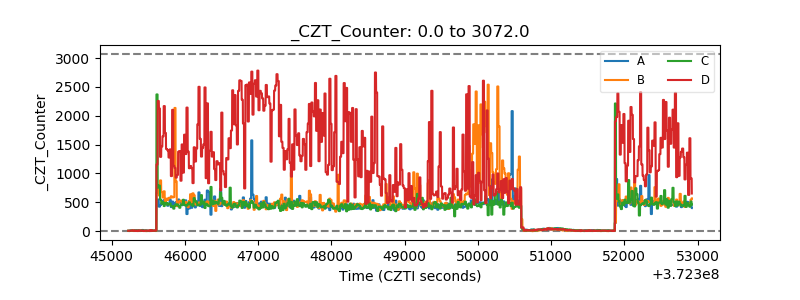 |
| +2.5 Volts monitor |  |
| +5 Volts monitor |  |
| _ROLL_ROT | 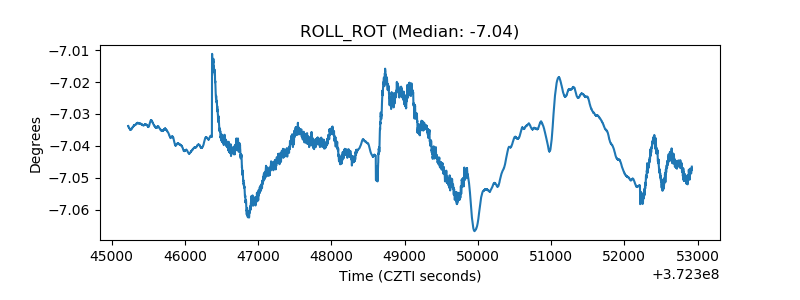 |
| _Roll_DEC | 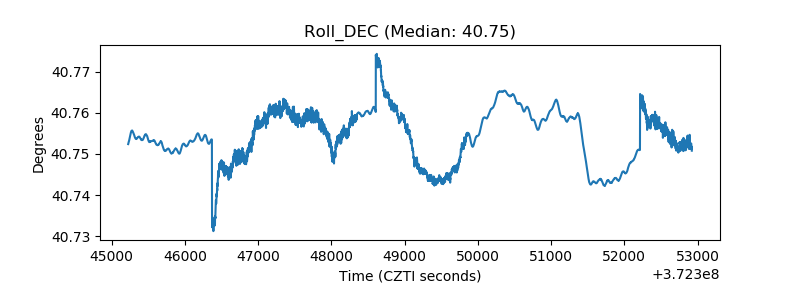 |
| _Roll_RA |  |
| Veto Counter | 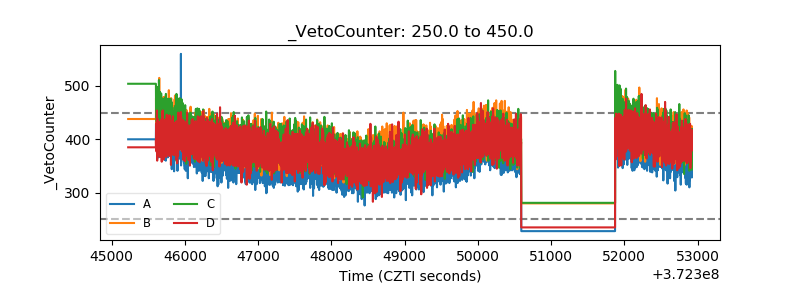 |