| Param | Original file | Final file |
|---|---|---|
| Filename | modeM0/AS1T04_064T01_9000004730_32765cztM0_level2.evt | modeM0/AS1T04_064T01_9000004730_32765cztM0_level2_quad_clean.evt |
| Size (bytes) | 95,264,640 | 17,752,320 |
| Size | 90.9 MB | 16.9 MB |
| Events in quadrant A | 629,516 | 119,248 |
| Events in quadrant B | 529,013 | 122,518 |
| Events in quadrant C | 475,039 | 122,475 |
| Events in quadrant D | 1,188,167 | 103,367 |
| Mode SS | |||
|---|---|---|---|
| Quadrant | BADHDUFLAG | Total packets | Discarded packets |
| A | 0 | 18 | 0 |
| B | 0 | 18 | 0 |
| C | 0 | 18 | 0 |
| D | 0 | 18 | 0 |
| Mode M0 | |||
|---|---|---|---|
| Quadrant | BADHDUFLAG | Total packets | Discarded packets |
| A | 0 | 2471 | 1 |
| B | 0 | 2156 | 0 |
| C | 0 | 1855 | 0 |
| D | 0 | 4174 | 0 |
| Quadrant | Total seconds | Saturated seconds | Saturation percentage |
|---|---|---|---|
| A | 887 | 14 | 1.578354% |
| B | 887 | 5 | 0.563698% |
| C | 887 | 0 | 0.000000% |
| D | 887 | 197 | 22.209696% |
Noise dominated data is calculated using 1-second bins in cleaned event files. If a bin has >2000 counts, and if more than 50% of those come from <1% of pixels, then it is considered to be noise-dominated and hence unusable.
| Quadrant | # 1 sec bins | Bins with >0 counts | Bins with >2000 counts | High rate bins dominated by noise | Noise dominated (total time) | Noise dominated (detector-on time) | Marked lightcurve |
|---|---|---|---|---|---|---|---|
| A | 887 | 887 | 1 | 1 | 0.11% | 0.11% | 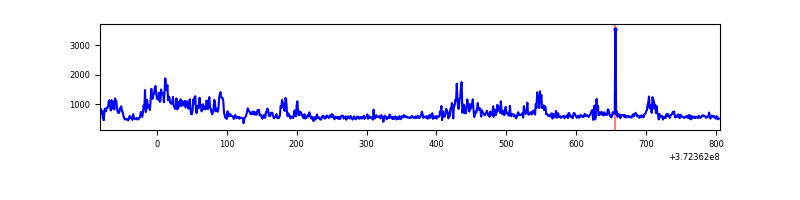 |
| B | 887 | 887 | 0 | 0 | 0.00% | 0.00% | 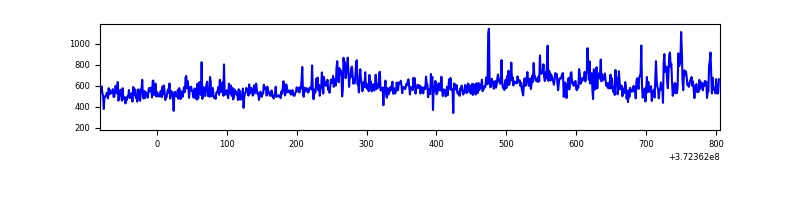 |
| C | 887 | 887 | 0 | 0 | 0.00% | 0.00% | 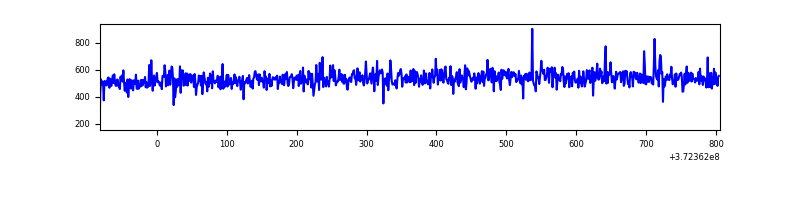 |
| D | 887 | 887 | 120 | 120 | 13.53% | 13.53% | 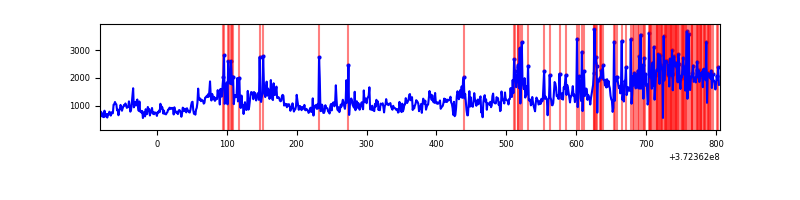 |
Top three noisy pixels from each quadrant. If the there are fewer than three noisy pixels in the level2.evt file, extra rows are filled as -1
| Pixel properties | Quadrant properties | ||||||
|---|---|---|---|---|---|---|---|
| Quadrant | DetID | PixID | Counts | Sigma | Mean | Median | Sigma |
| A | 12 | 16 | 125151 | 4580.1 | 123 | 121 | 27.3 |
| A | 12 | 194 | 17724 | 644.83 | 123 | 121 | 27.3 |
| A | 0 | 159 | 4844 | 173.01 | 123 | 121 | 27.3 |
| B | 0 | 219 | 30156 | 1156.47 | 122 | 119 | 26.0 |
| B | 0 | 197 | 10250 | 390.06 | 122 | 119 | 26.0 |
| B | 4 | 251 | 4160 | 155.58 | 122 | 119 | 26.0 |
| C | 0 | 10 | 2174 | 68.31 | 120 | 120 | 30.1 |
| C | 14 | 67 | 2047 | 64.09 | 120 | 120 | 30.1 |
| C | 0 | 207 | 1633 | 50.32 | 120 | 120 | 30.1 |
| D | 8 | 195 | 345544 | 11513.05 | 111 | 108 | 30.0 |
| D | 2 | 250 | 140179 | 4668.43 | 111 | 108 | 30.0 |
| D | 12 | 17 | 116217 | 3869.8 | 111 | 108 | 30.0 |
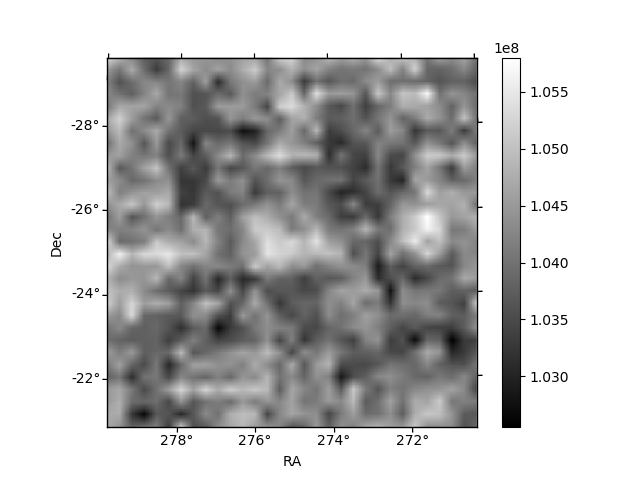
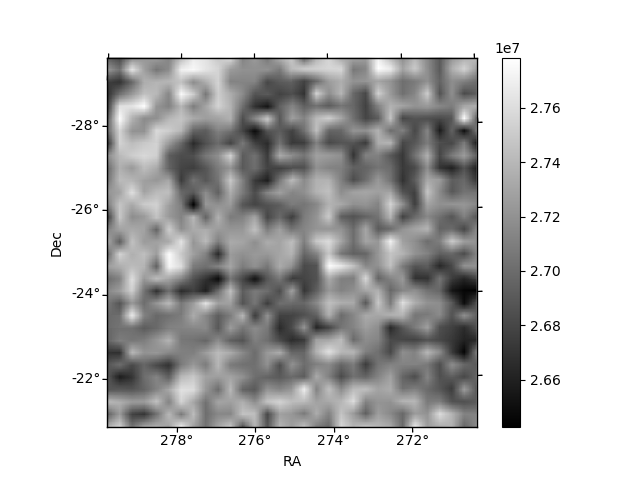
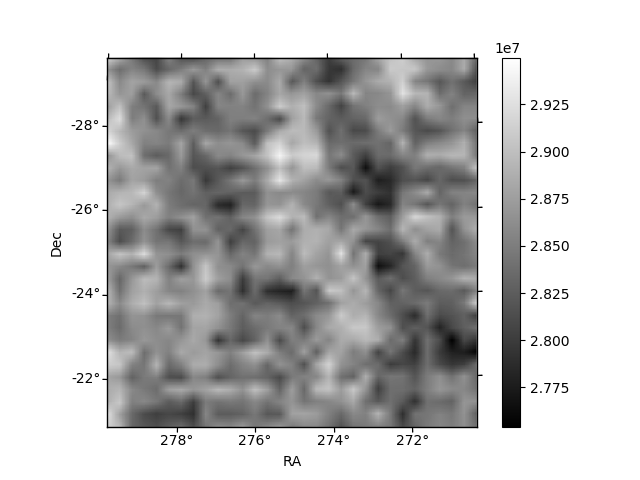
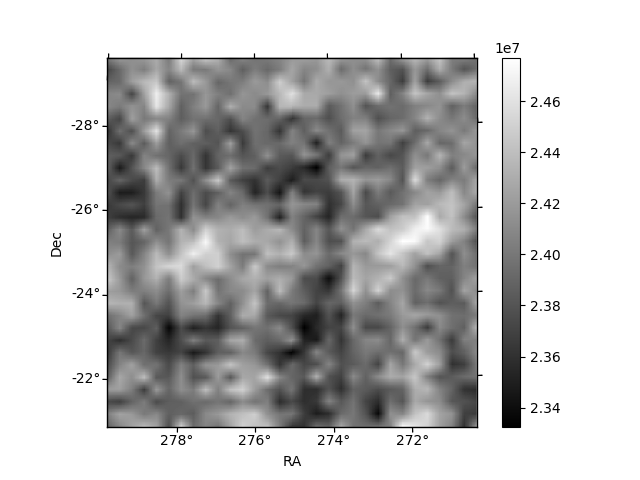
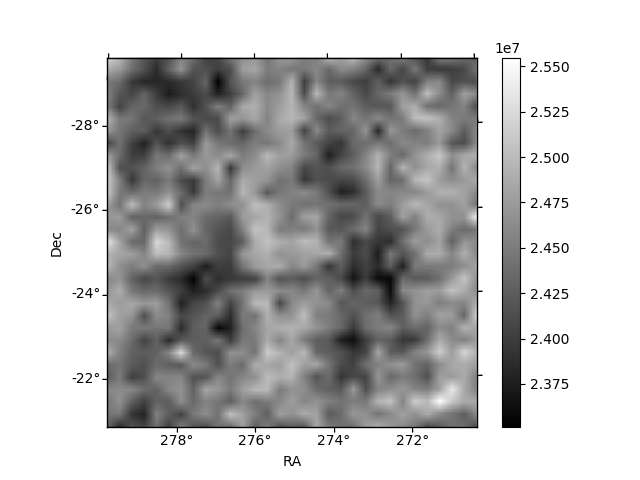
Histogram calculated using DETX and DETY for each event in the final _common_clean file
| Quadrant A | 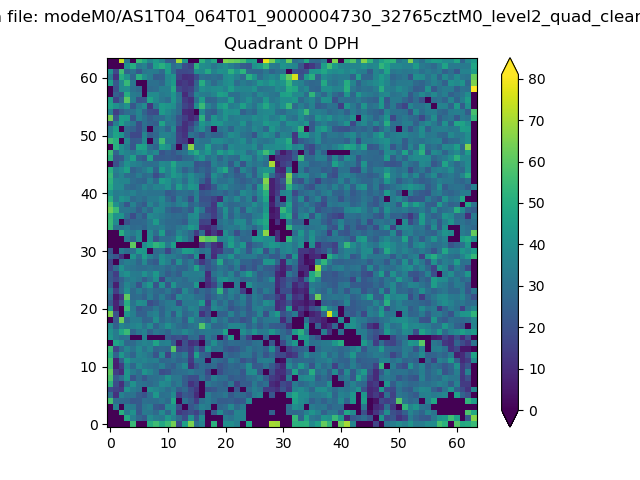 |
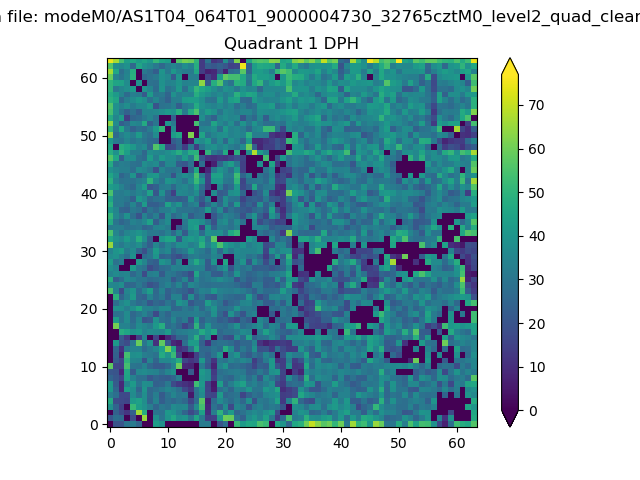 |
Quadrant B |
|---|---|---|---|
| Quadrant D | 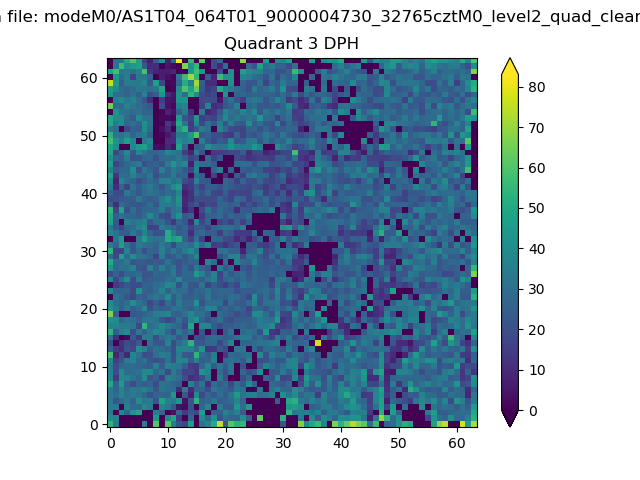 |
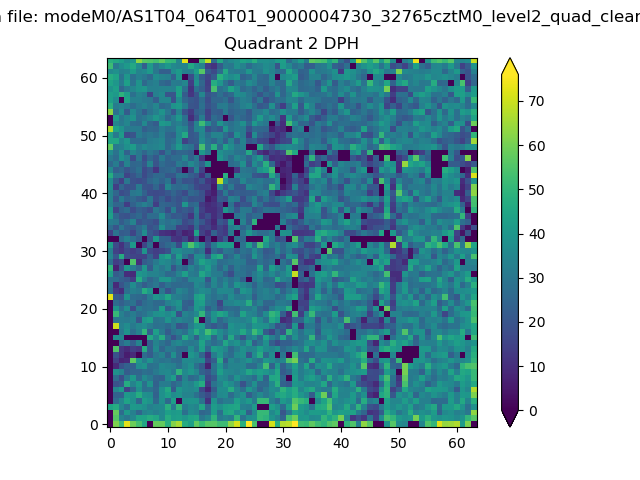 |
Quadrant C |
| Plot type | Count rate plots | Images |
|---|---|---|
| Comparison with Poisson distribution Blue bars denote a histogram of data divided into 1 sec bins. Red curve is a Poisson curve with rate = median count rate of data. |
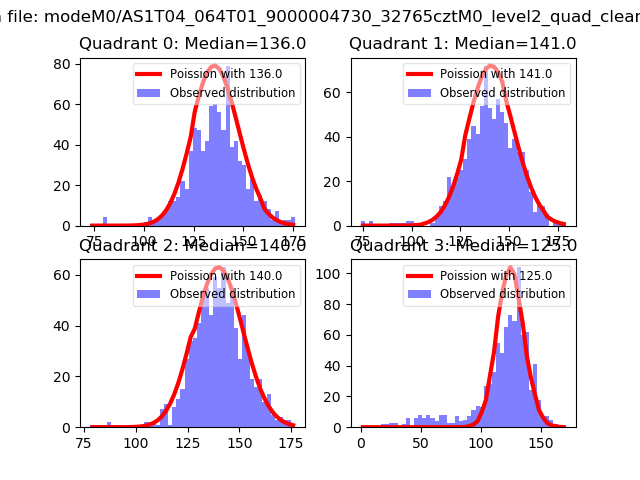 |
 |
| Quadrant-wise count rates Data is divided into 100 sec bins |
 |
|
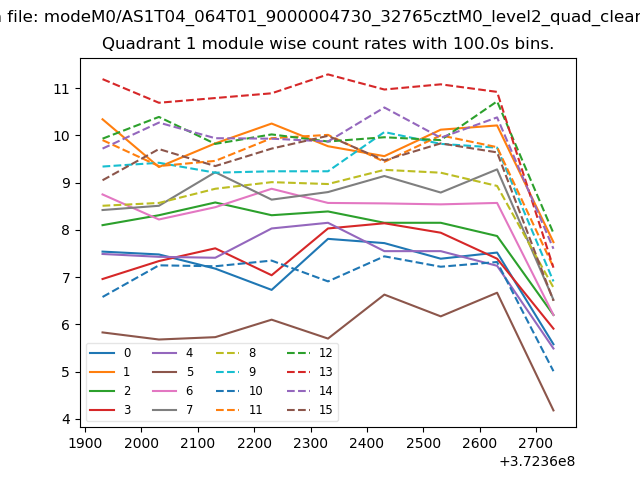
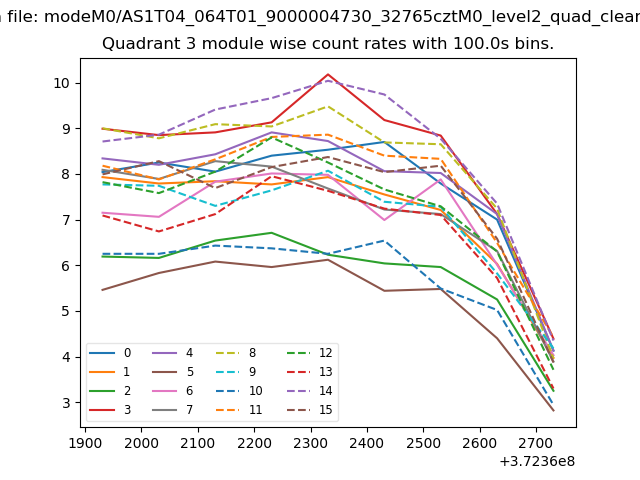
| Module-wise count rates for Quadrant A Data is divided into 100 sec bins |
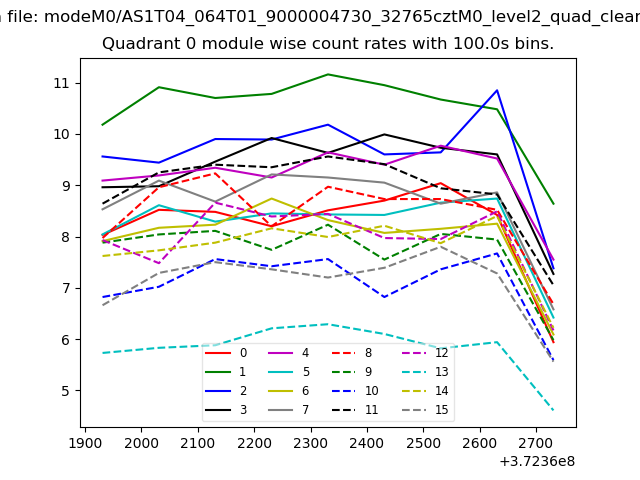 |
 |
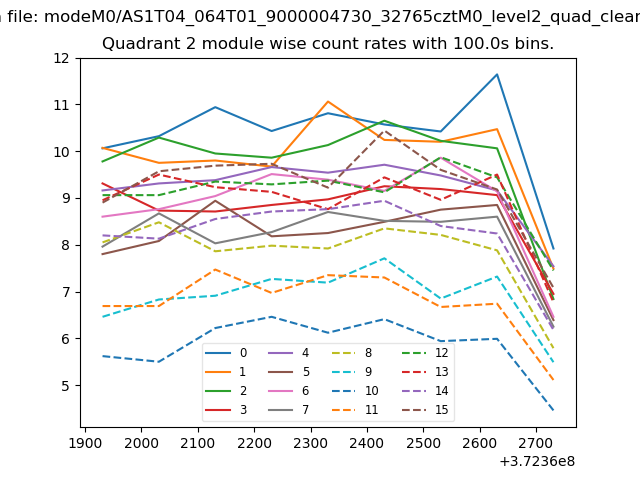
| Module-wise count rates for Quadrant B Data is divided into 100 sec bins |
 |
 |
| Module-wise count rates for Quadrant C Data is divided into 100 sec bins |
 |
 |
| Module-wise count rates for Quadrant D Data is divided into 100 sec bins |
 |
 |
| Parameter | Plot |
|---|---|
| CZT HV Monitor | 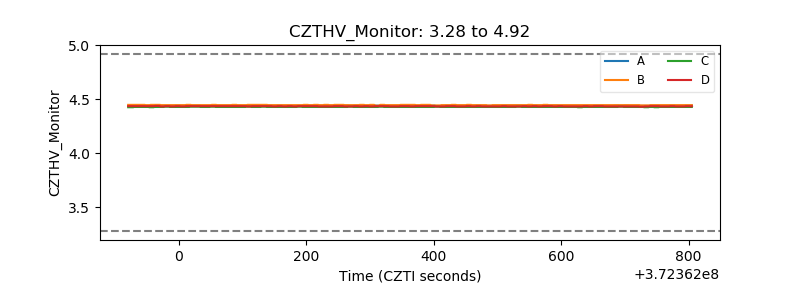 |
| D_VDD | 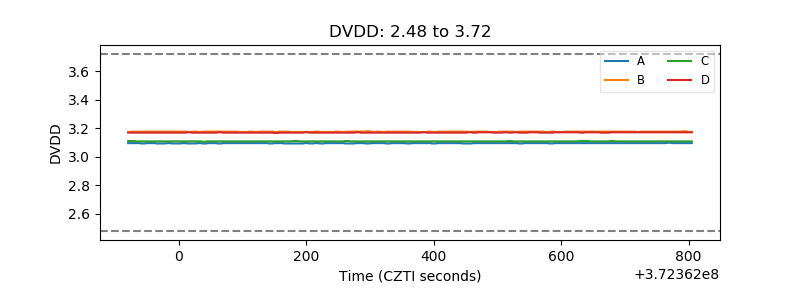 |
| Temperature 1 | 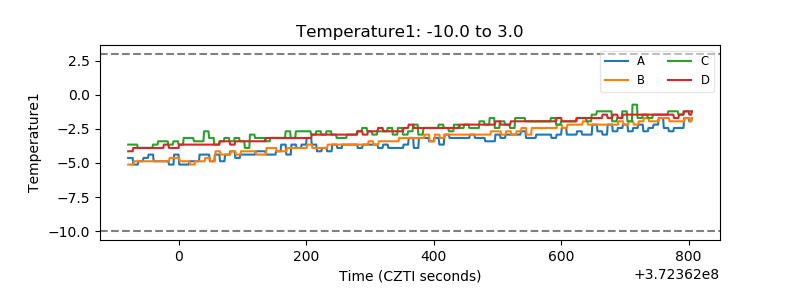 |
| Veto HV Monitor |  |
| Veto LLD | 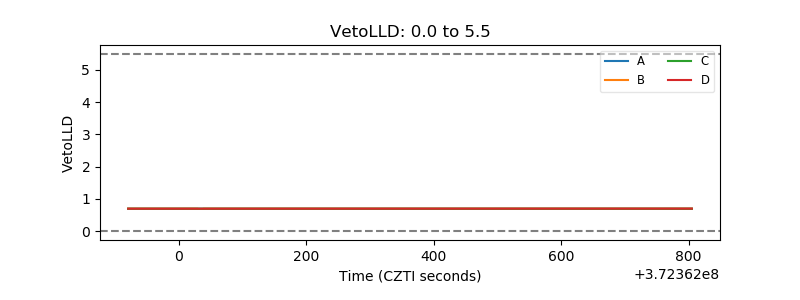 |
| Alpha Counter | 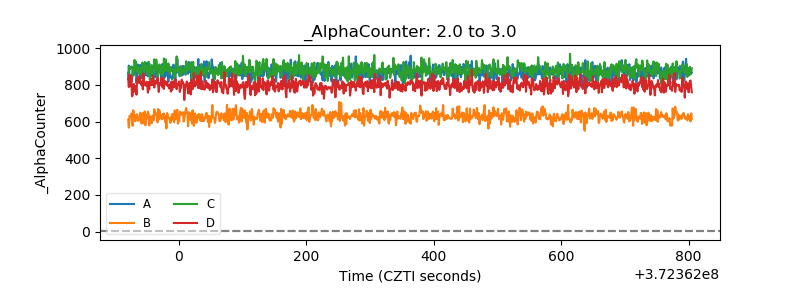 |
| _CPM_Rate | 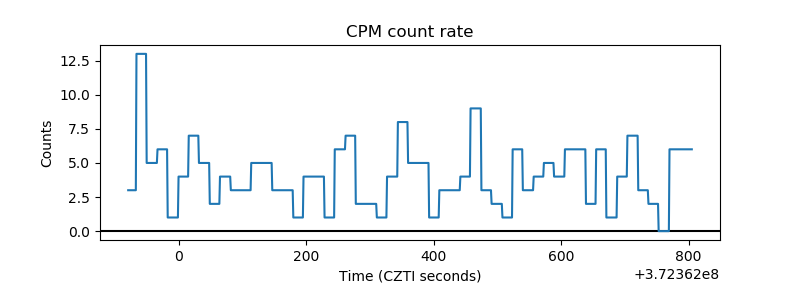 |
| CZT Counter | 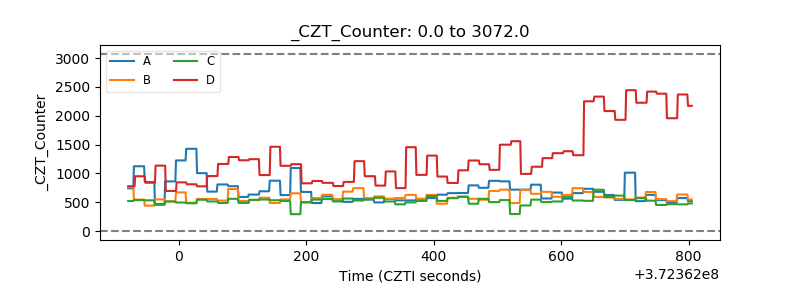 |
| +2.5 Volts monitor | 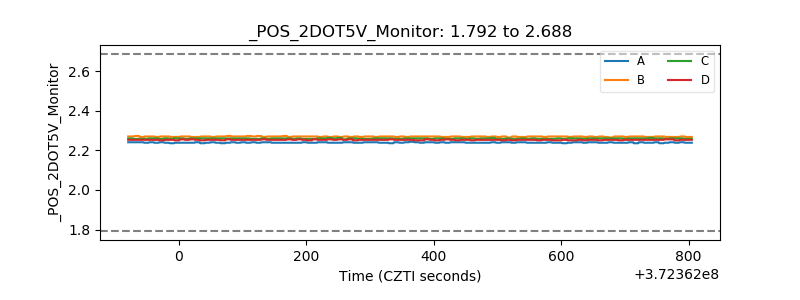 |
| +5 Volts monitor |  |
| _ROLL_ROT | 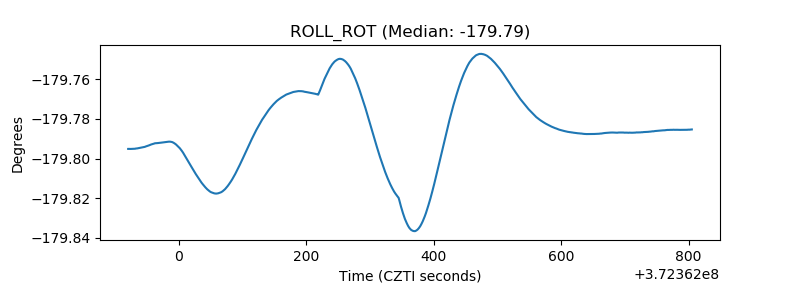 |
| _Roll_DEC | 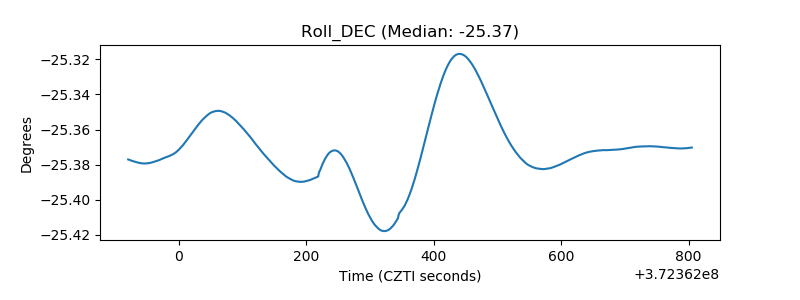 |
| _Roll_RA | 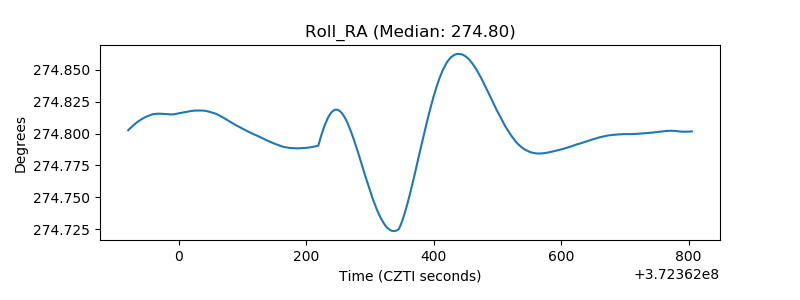 |
| Veto Counter | 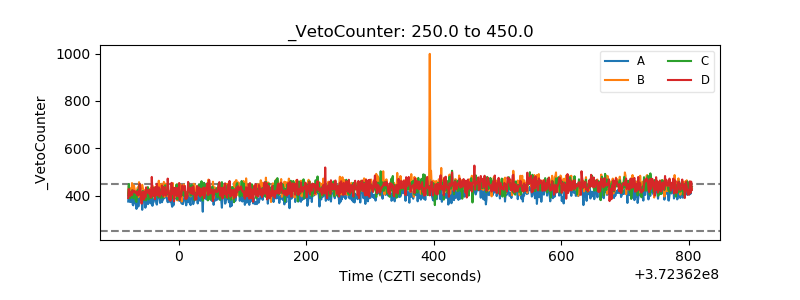 |