| Param | Original file | Final file |
|---|---|---|
| Filename | modeM0/AS1T04_064T01_9000004730_32766cztM0_level2.evt | modeM0/AS1T04_064T01_9000004730_32766cztM0_level2_quad_clean.evt |
| Size (bytes) | 658,100,160 | 81,178,560 |
| Size | 627.6 MB | 77.4 MB |
| Events in quadrant A | 3,342,241 | 534,441 |
| Events in quadrant B | 3,491,666 | 544,686 |
| Events in quadrant C | 3,182,241 | 539,117 |
| Events in quadrant D | 9,472,174 | 383,262 |
| Mode M9 | |||
|---|---|---|---|
| Quadrant | BADHDUFLAG | Total packets | Discarded packets |
| A | 0 | 30 | 0 |
| B | 0 | 30 | 0 |
| C | 0 | 30 | 0 |
| D | 0 | 30 | 0 |
| Mode SS | |||
|---|---|---|---|
| Quadrant | BADHDUFLAG | Total packets | Discarded packets |
| A | 0 | 134 | 0 |
| B | 0 | 134 | 0 |
| C | 0 | 134 | 0 |
| D | 0 | 134 | 0 |
| Mode M0 | |||
|---|---|---|---|
| Quadrant | BADHDUFLAG | Total packets | Discarded packets |
| A | 0 | 14140 | 4 |
| B | 0 | 14721 | 2 |
| C | 0 | 13662 | 2 |
| D | 0 | 32763 | 2 |
| Quadrant | Total seconds | Saturated seconds | Saturation percentage |
|---|---|---|---|
| A | 6539 | 33 | 0.504664% |
| B | 6539 | 49 | 0.749350% |
| C | 6539 | 38 | 0.581129% |
| D | 6539 | 1921 | 29.377581% |
Noise dominated data is calculated using 1-second bins in cleaned event files. If a bin has >2000 counts, and if more than 50% of those come from <1% of pixels, then it is considered to be noise-dominated and hence unusable.
| Quadrant | # 1 sec bins | Bins with >0 counts | Bins with >2000 counts | High rate bins dominated by noise | Noise dominated (total time) | Noise dominated (detector-on time) | Marked lightcurve |
|---|---|---|---|---|---|---|---|
| A | 9524 | 6542 | 7 | 7 | 0.07% | 0.11% | 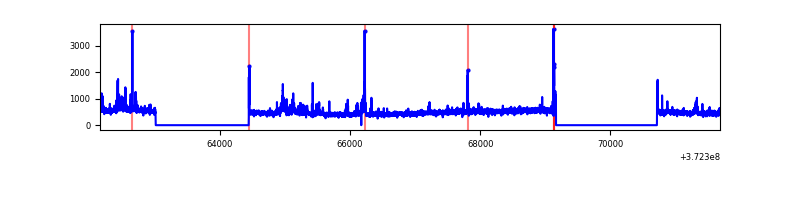 |
| B | 9524 | 6542 | 20 | 20 | 0.21% | 0.31% | 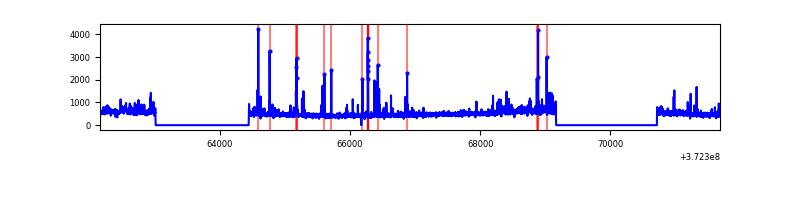 |
| C | 9524 | 6542 | 26 | 26 | 0.27% | 0.40% | 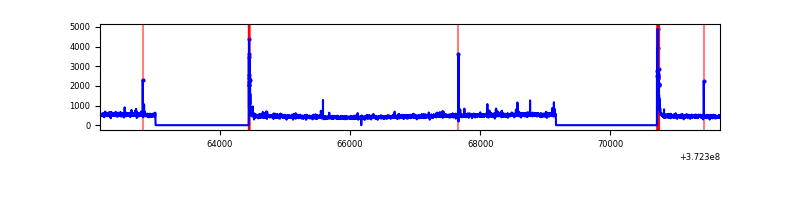 |
| D | 9524 | 6541 | 1452 | 1452 | 15.25% | 22.20% | 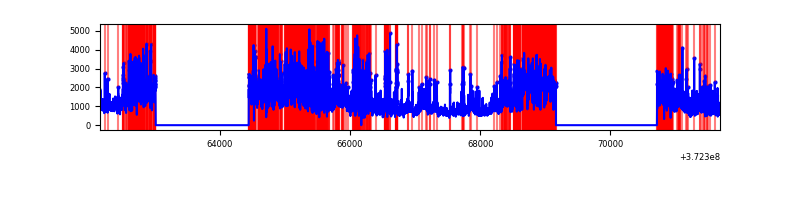 |
Top three noisy pixels from each quadrant. If the there are fewer than three noisy pixels in the level2.evt file, extra rows are filled as -1
| Pixel properties | Quadrant properties | ||||||
|---|---|---|---|---|---|---|---|
| Quadrant | DetID | PixID | Counts | Sigma | Mean | Median | Sigma |
| A | 12 | 16 | 187255 | 1167.04 | 785 | 768 | 159.8 |
| A | 15 | 237 | 32274 | 197.17 | 785 | 768 | 159.8 |
| A | 12 | 194 | 31897 | 194.81 | 785 | 768 | 159.8 |
| B | 0 | 219 | 79107 | 516.2 | 790 | 770 | 151.8 |
| B | 5 | 172 | 68558 | 446.69 | 790 | 770 | 151.8 |
| B | 0 | 197 | 50738 | 329.26 | 790 | 770 | 151.8 |
| C | 0 | 10 | 131167 | 729.9 | 762 | 770 | 178.7 |
| C | 3 | 233 | 23731 | 128.52 | 762 | 770 | 178.7 |
| C | 14 | 67 | 17690 | 94.71 | 762 | 770 | 178.7 |
| D | 12 | 17 | 3172509 | 19831.91 | 642 | 629 | 159.9 |
| D | 8 | 195 | 1916781 | 11980.58 | 642 | 629 | 159.9 |
| D | 2 | 250 | 611175 | 3817.39 | 642 | 629 | 159.9 |
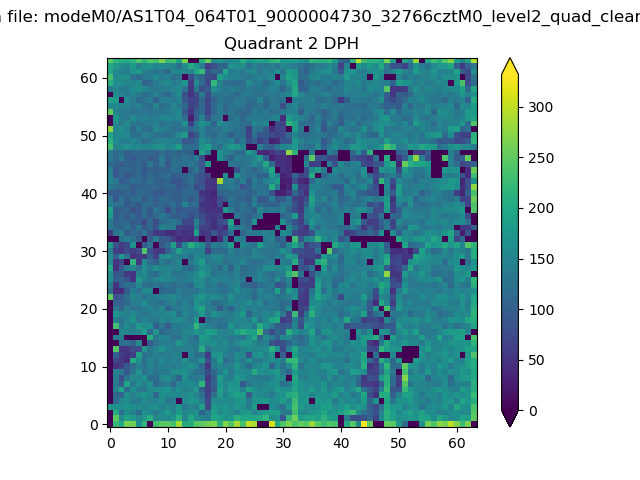
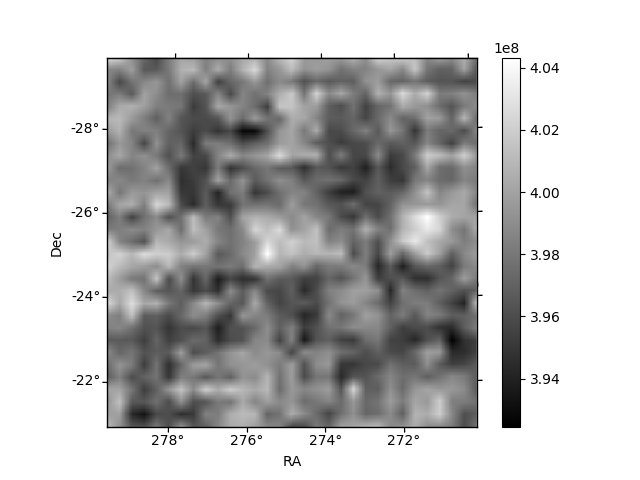
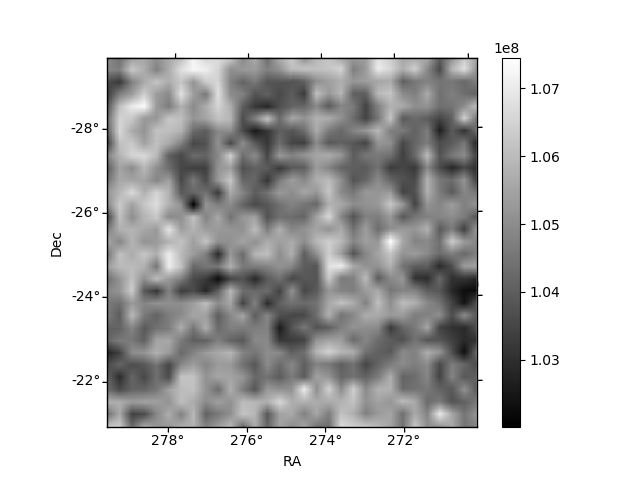
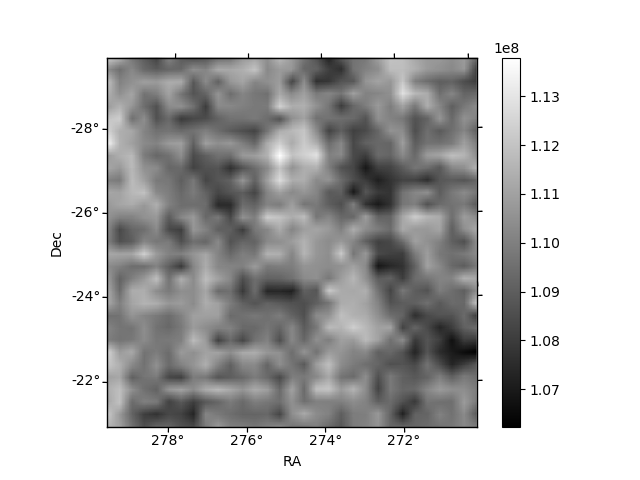
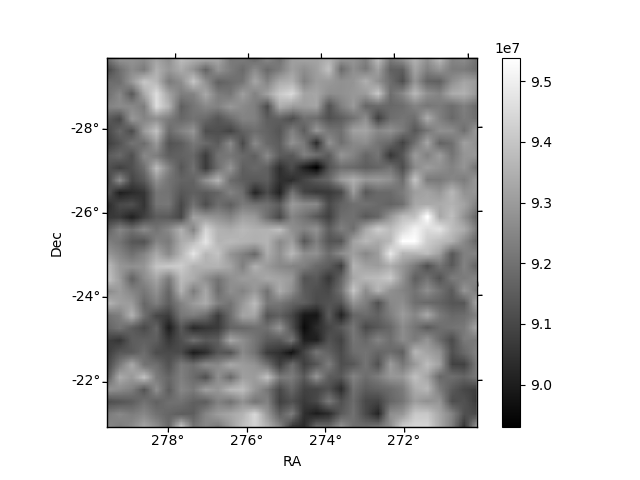
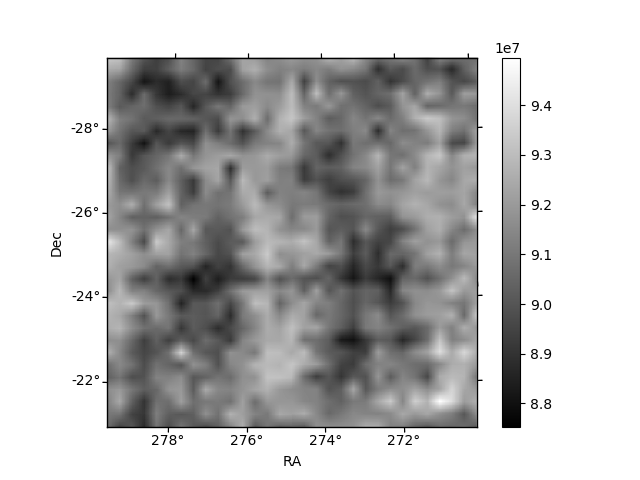
Histogram calculated using DETX and DETY for each event in the final _common_clean file
| Quadrant A | 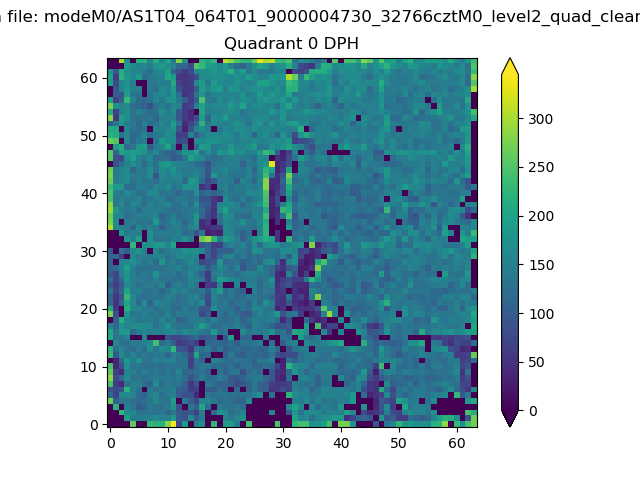 |
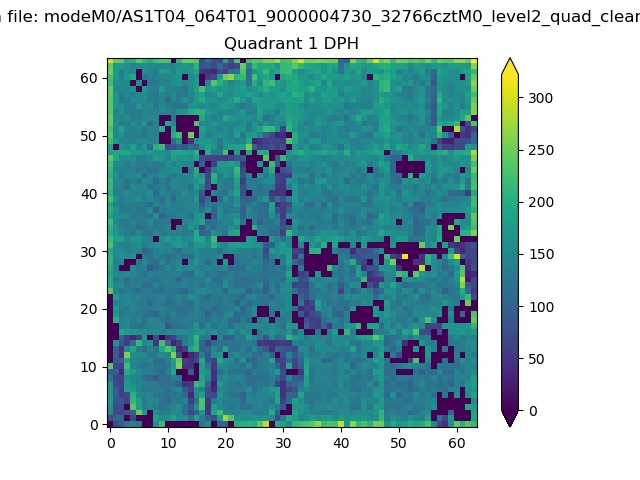 |
Quadrant B |
|---|---|---|---|
| Quadrant D | 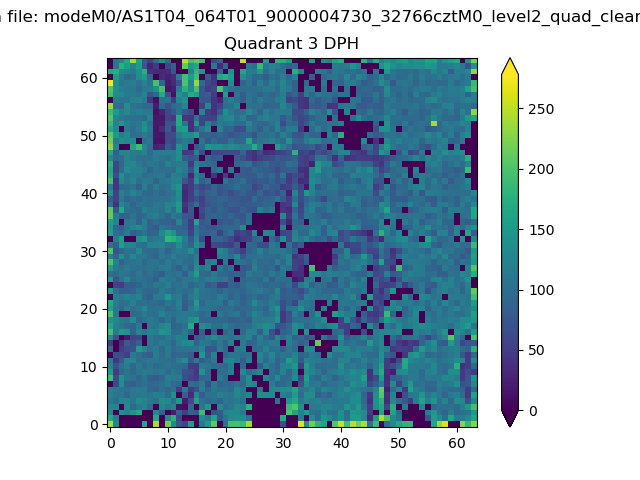 |
 |
Quadrant C |
| Plot type | Count rate plots | Images |
|---|---|---|
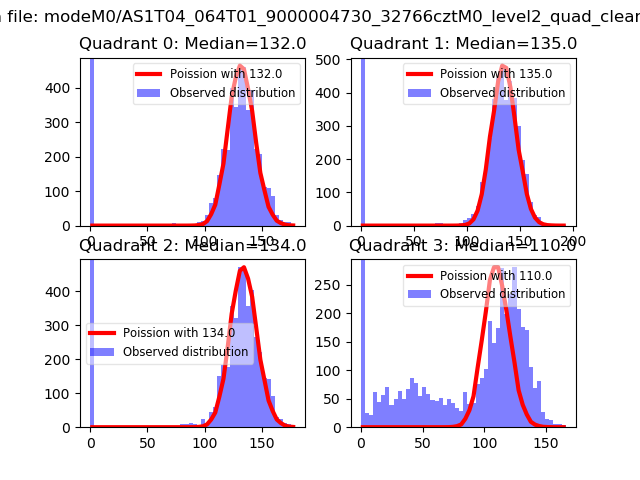
| Comparison with Poisson distribution Blue bars denote a histogram of data divided into 1 sec bins. Red curve is a Poisson curve with rate = median count rate of data. |
 |
 |
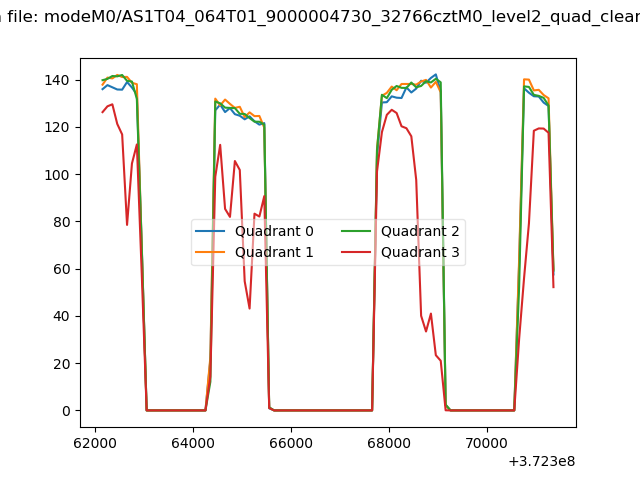
| Quadrant-wise count rates Data is divided into 100 sec bins |
 |
|
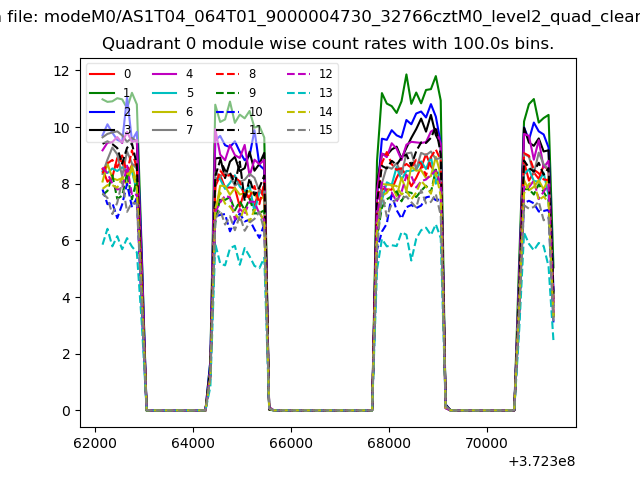
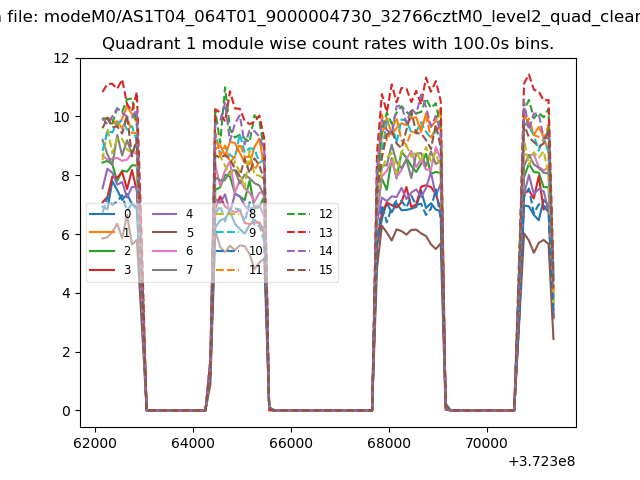
| Module-wise count rates for Quadrant A Data is divided into 100 sec bins |
 |
 |
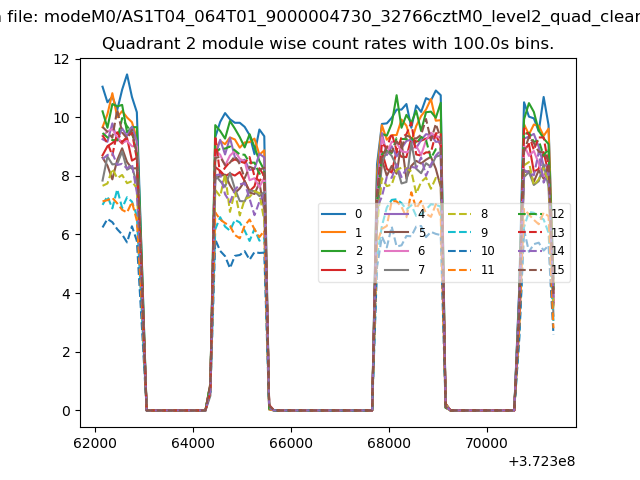
| Module-wise count rates for Quadrant B Data is divided into 100 sec bins |
 |
 |
| Module-wise count rates for Quadrant C Data is divided into 100 sec bins |
 |
 |
| Module-wise count rates for Quadrant D Data is divided into 100 sec bins |
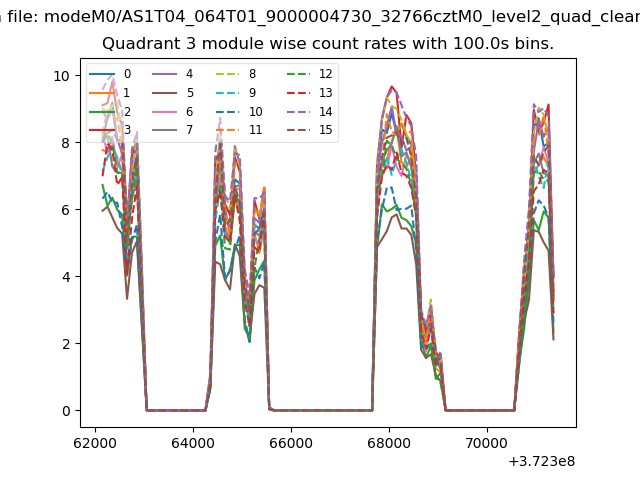 |
 |
| Parameter | Plot |
|---|---|
| CZT HV Monitor | 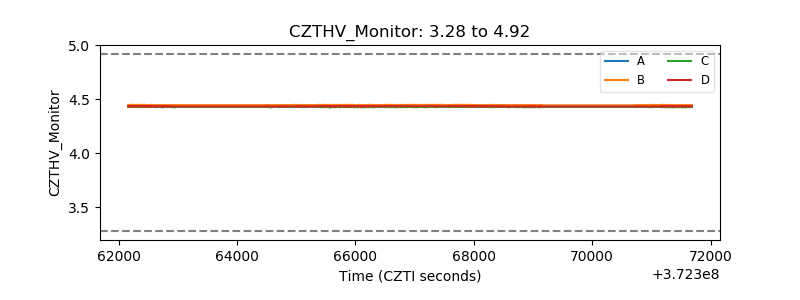 |
| D_VDD | 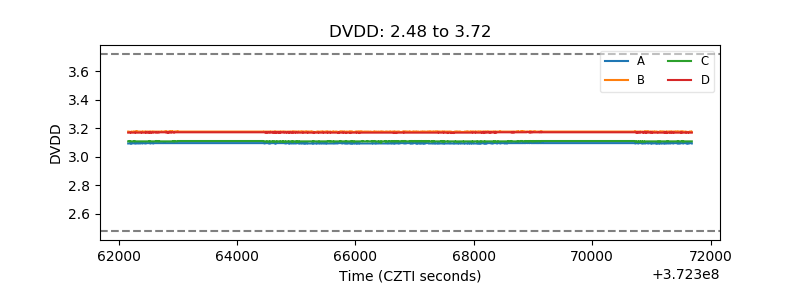 |
| Temperature 1 | 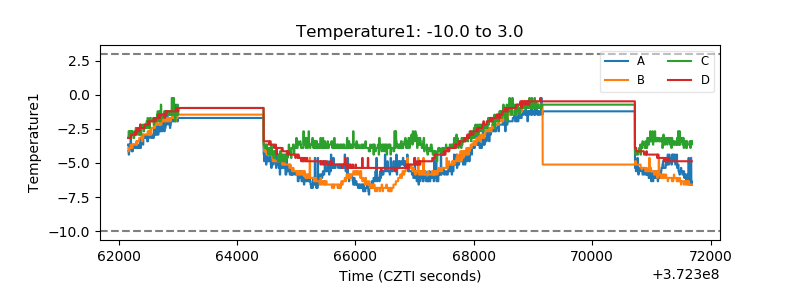 |
| Veto HV Monitor | 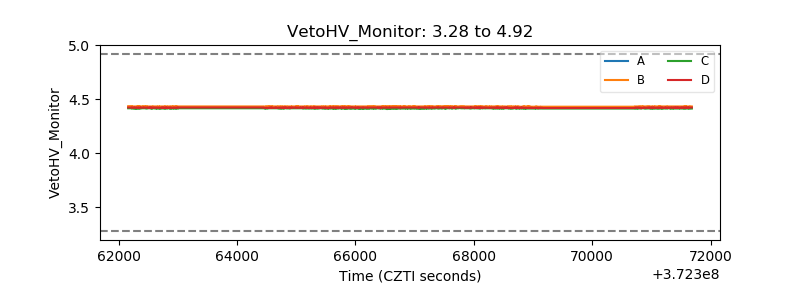 |
| Veto LLD | 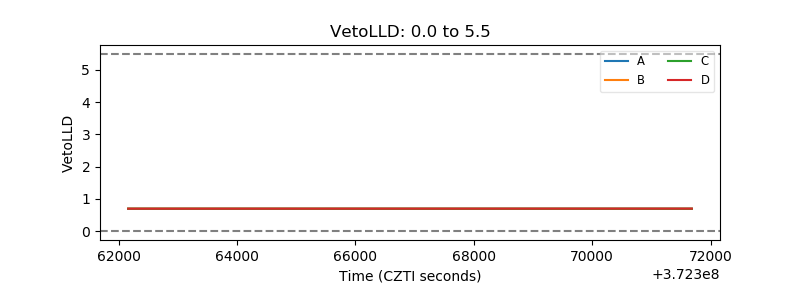 |
| Alpha Counter | 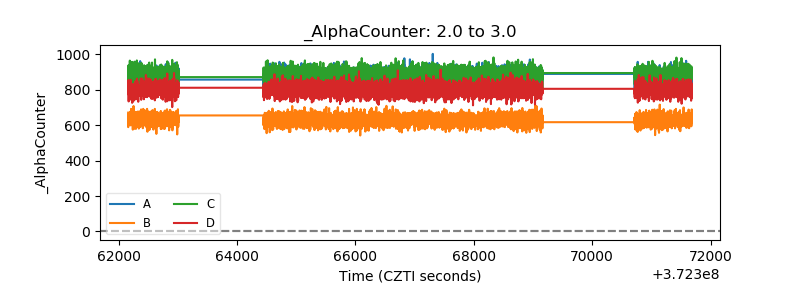 |
| _CPM_Rate | 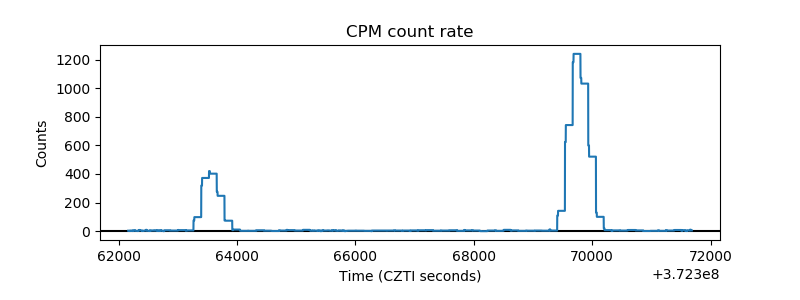 |
| CZT Counter | 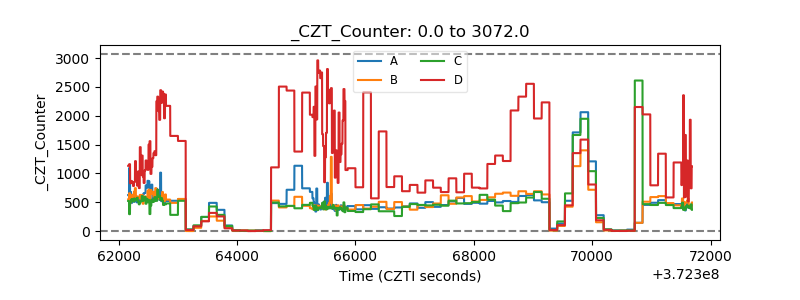 |
| +2.5 Volts monitor |  |
| +5 Volts monitor |  |
| _ROLL_ROT | 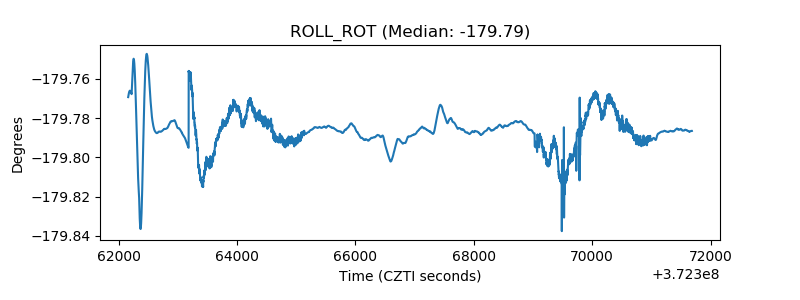 |
| _Roll_DEC | 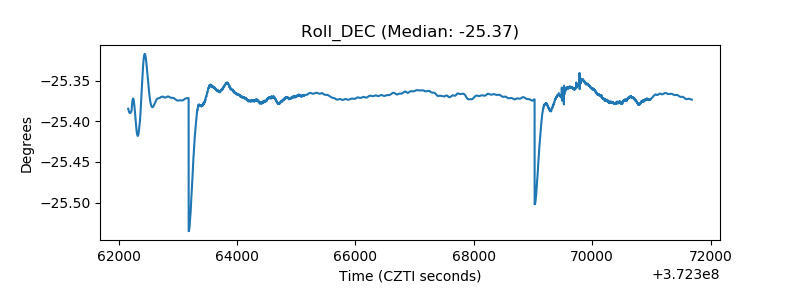 |
| _Roll_RA | 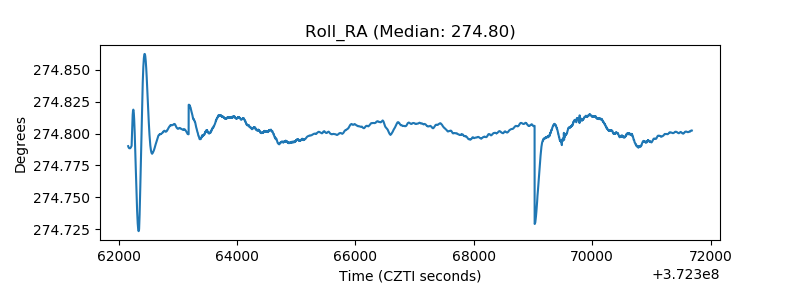 |
| Veto Counter | 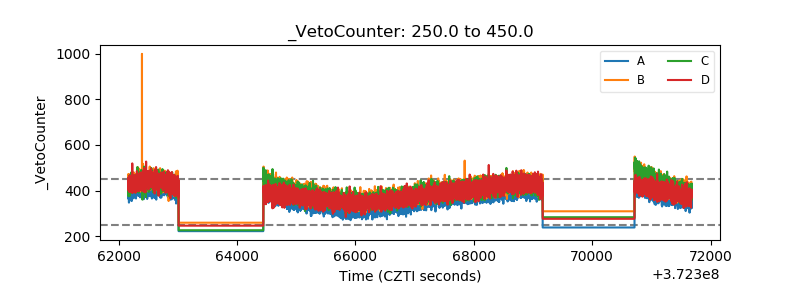 |