| Param | Original file | Final file |
|---|---|---|
| Filename | modeM0/AS1T04_064T01_9000004730_32769cztM0_level2.evt | modeM0/AS1T04_064T01_9000004730_32769cztM0_level2_quad_clean.evt |
| Size (bytes) | 542,724,480 | 50,921,280 |
| Size | 517.6 MB | 48.6 MB |
| Events in quadrant A | 3,548,485 | 289,888 |
| Events in quadrant B | 3,467,985 | 305,630 |
| Events in quadrant C | 4,177,650 | 283,268 |
| Events in quadrant D | 4,870,733 | 277,924 |
| Mode M9 | |||
|---|---|---|---|
| Quadrant | BADHDUFLAG | Total packets | Discarded packets |
| A | 0 | 24 | 0 |
| B | 0 | 24 | 0 |
| C | 0 | 24 | 0 |
| D | 0 | 25 | 0 |
| Mode SS | |||
|---|---|---|---|
| Quadrant | BADHDUFLAG | Total packets | Discarded packets |
| A | 0 | 112 | 0 |
| B | 0 | 112 | 0 |
| C | 0 | 112 | 0 |
| D | 0 | 112 | 0 |
| Mode M0 | |||
|---|---|---|---|
| Quadrant | BADHDUFLAG | Total packets | Discarded packets |
| A | 0 | 13981 | 2 |
| B | 0 | 13874 | 1 |
| C | 0 | 15831 | 1 |
| D | 0 | 18341 | 1 |
| Quadrant | Total seconds | Saturated seconds | Saturation percentage |
|---|---|---|---|
| A | 5492 | 225 | 4.096868% |
| B | 5492 | 93 | 1.693372% |
| C | 5492 | 397 | 7.228696% |
| D | 5492 | 248 | 4.515659% |
Noise dominated data is calculated using 1-second bins in cleaned event files. If a bin has >2000 counts, and if more than 50% of those come from <1% of pixels, then it is considered to be noise-dominated and hence unusable.
| Quadrant | # 1 sec bins | Bins with >0 counts | Bins with >2000 counts | High rate bins dominated by noise | Noise dominated (total time) | Noise dominated (detector-on time) | Marked lightcurve |
|---|---|---|---|---|---|---|---|
| A | 7286 | 5493 | 135 | 135 | 1.85% | 2.46% | 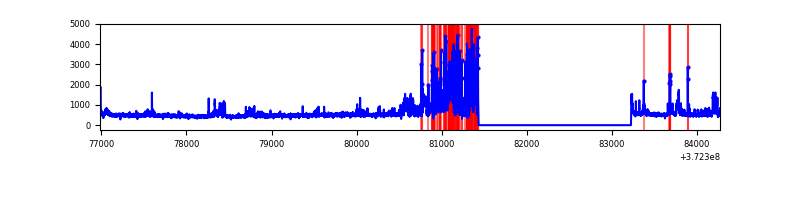 |
| B | 7286 | 5493 | 66 | 66 | 0.91% | 1.20% | 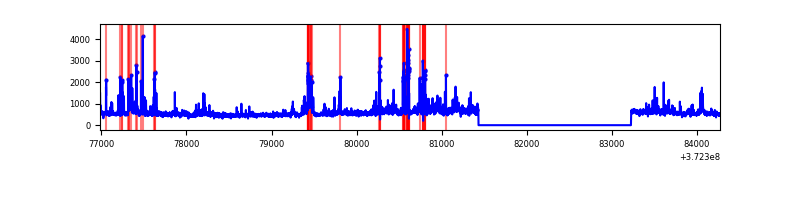 |
| C | 7286 | 5493 | 309 | 309 | 4.24% | 5.63% | 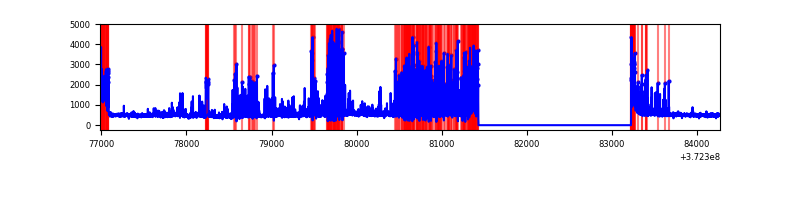 |
| D | 7286 | 5493 | 195 | 195 | 2.68% | 3.55% | 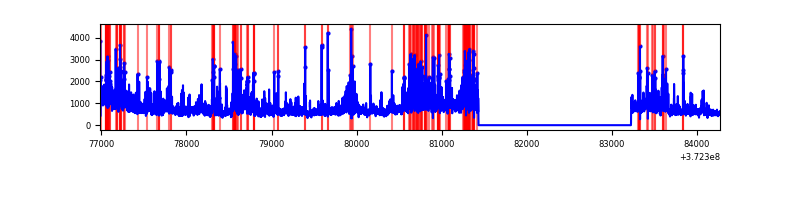 |
Top three noisy pixels from each quadrant. If the there are fewer than three noisy pixels in the level2.evt file, extra rows are filled as -1
| Pixel properties | Quadrant properties | ||||||
|---|---|---|---|---|---|---|---|
| Quadrant | DetID | PixID | Counts | Sigma | Mean | Median | Sigma |
| A | 12 | 16 | 433882 | 3280.92 | 667 | 656 | 132.0 |
| A | 15 | 237 | 405377 | 3065.05 | 667 | 656 | 132.0 |
| A | 12 | 194 | 64327 | 482.2 | 667 | 656 | 132.0 |
| B | 12 | 1 | 259640 | 2019.41 | 681 | 664 | 128.2 |
| B | 5 | 172 | 171372 | 1331.13 | 681 | 664 | 128.2 |
| B | 0 | 219 | 106785 | 827.5 | 681 | 664 | 128.2 |
| C | 0 | 10 | 1406858 | 9533.14 | 640 | 647 | 147.5 |
| C | 3 | 233 | 89990 | 605.68 | 640 | 647 | 147.5 |
| C | 0 | 207 | 76101 | 511.53 | 640 | 647 | 147.5 |
| D | 8 | 195 | 1127127 | 6885.81 | 640 | 628 | 163.6 |
| D | 2 | 250 | 445060 | 2716.62 | 640 | 628 | 163.6 |
| D | 12 | 218 | 205007 | 1249.28 | 640 | 628 | 163.6 |
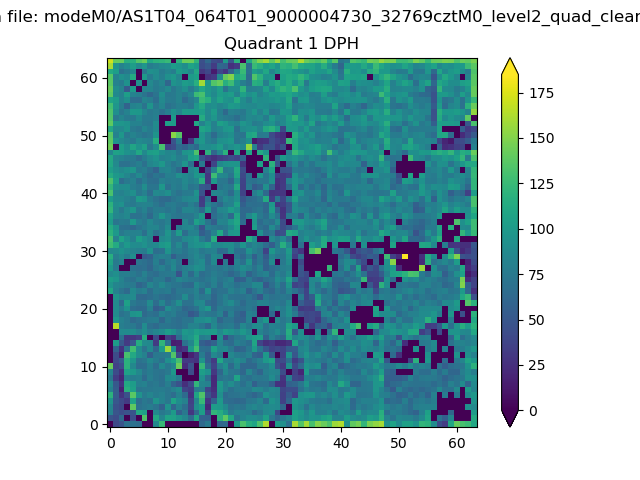
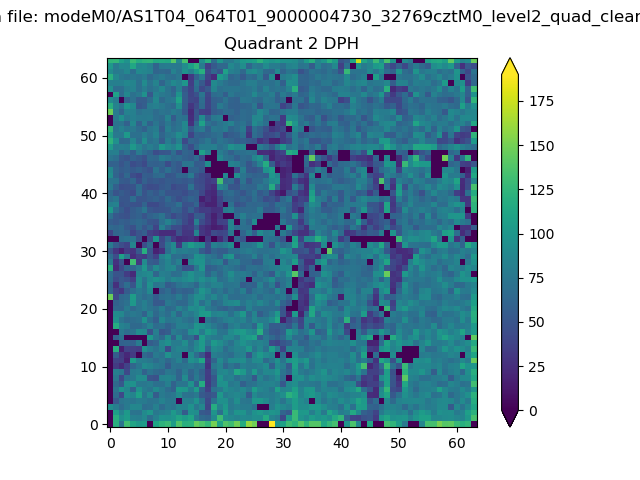
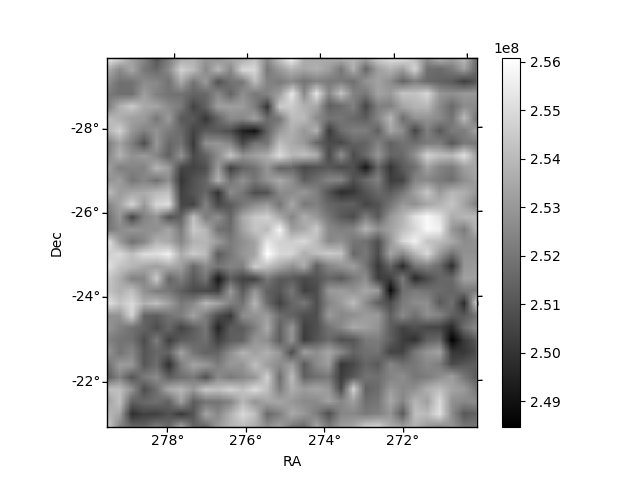
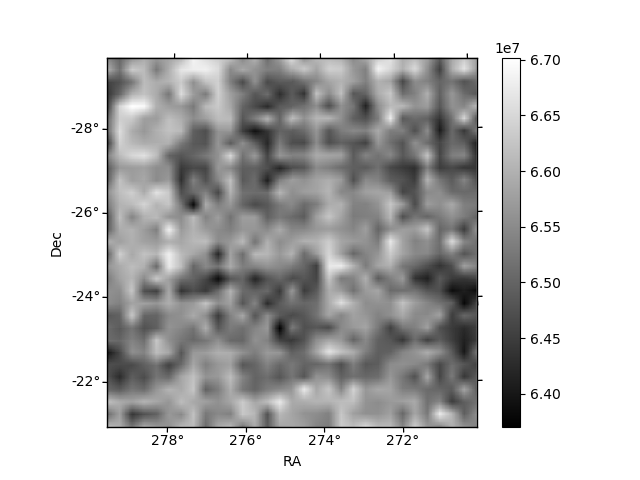
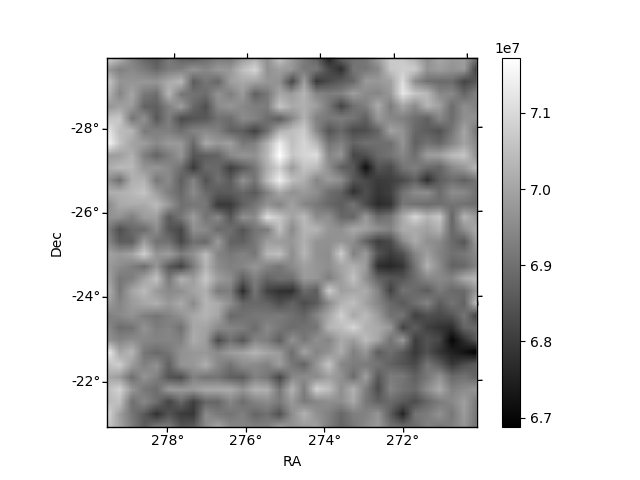
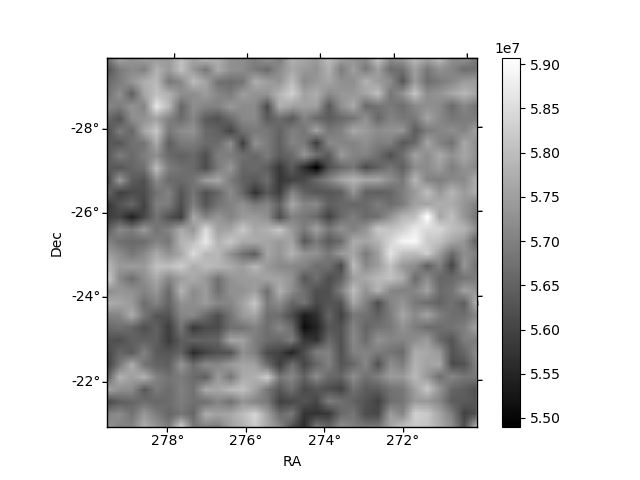
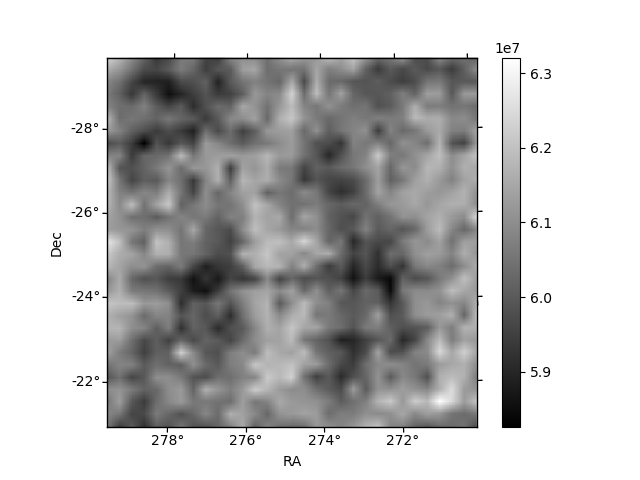
Histogram calculated using DETX and DETY for each event in the final _common_clean file
| Quadrant A |  |
 |
Quadrant B |
|---|---|---|---|
| Quadrant D | 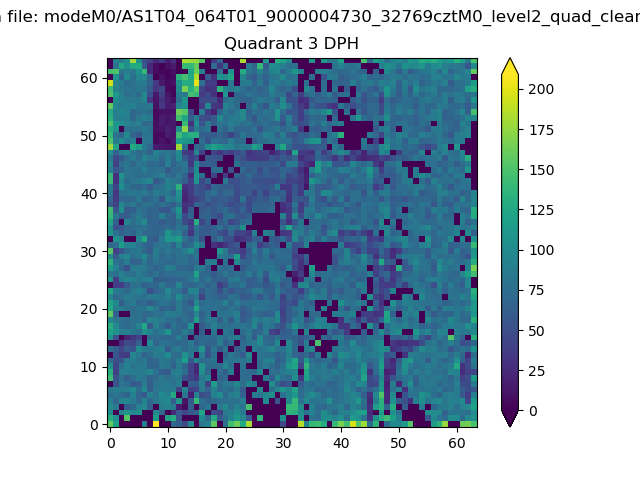 |
 |
Quadrant C |
| Plot type | Count rate plots | Images |
|---|---|---|
| Comparison with Poisson distribution Blue bars denote a histogram of data divided into 1 sec bins. Red curve is a Poisson curve with rate = median count rate of data. |
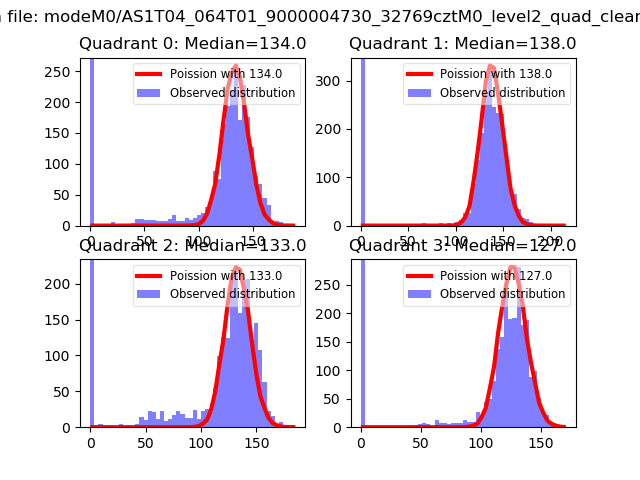 |
 |
| Quadrant-wise count rates Data is divided into 100 sec bins |
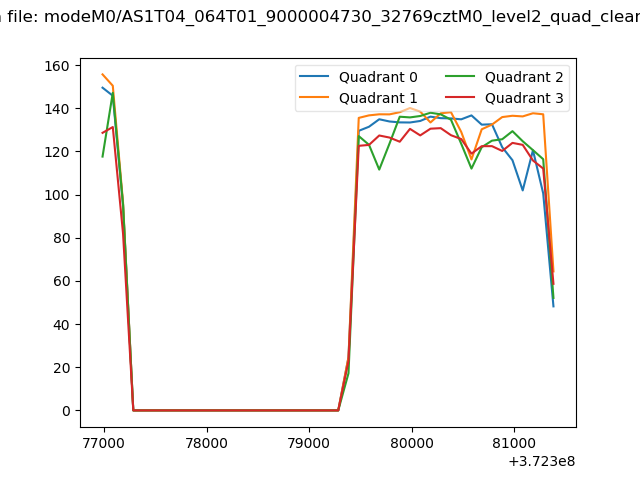 |
|
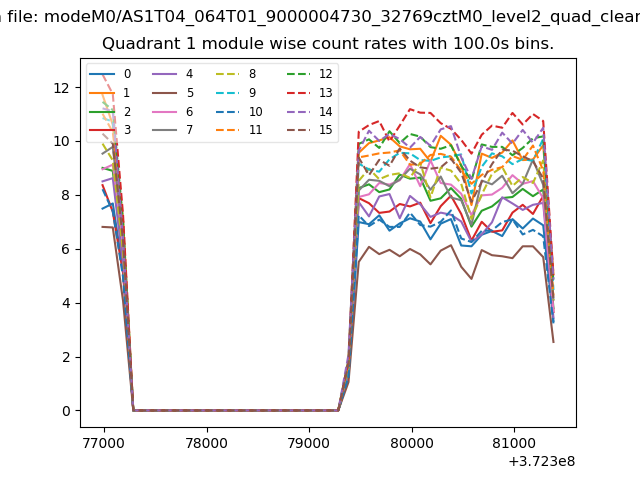
| Module-wise count rates for Quadrant A Data is divided into 100 sec bins |
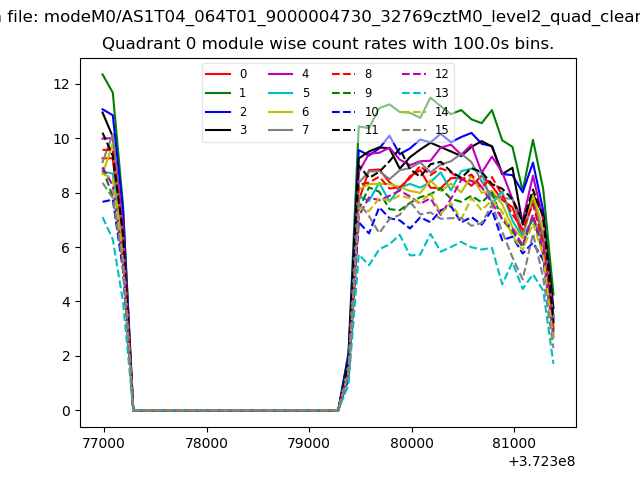 |
 |
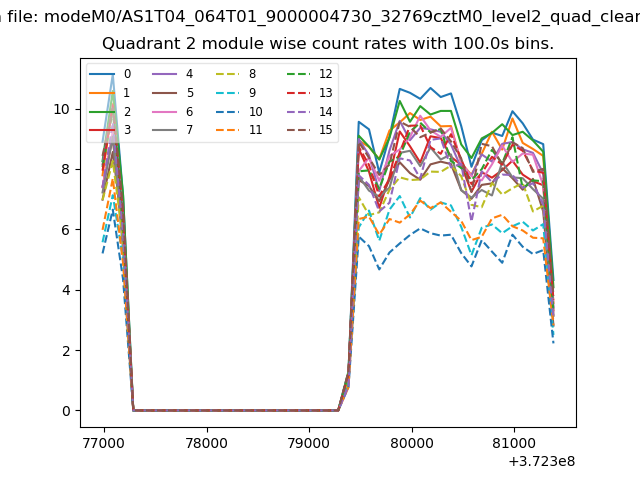
| Module-wise count rates for Quadrant B Data is divided into 100 sec bins |
 |
 |
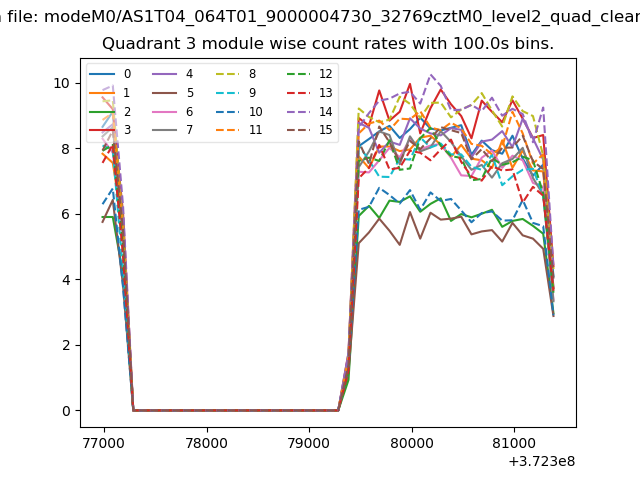
| Module-wise count rates for Quadrant C Data is divided into 100 sec bins |
 |
 |
| Module-wise count rates for Quadrant D Data is divided into 100 sec bins |
 |
 |
| Parameter | Plot |
|---|---|
| CZT HV Monitor | 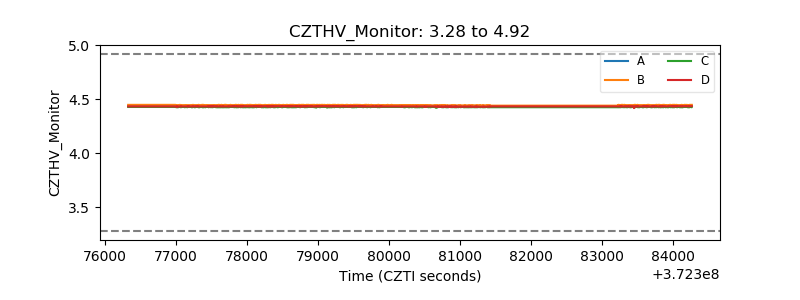 |
| D_VDD | 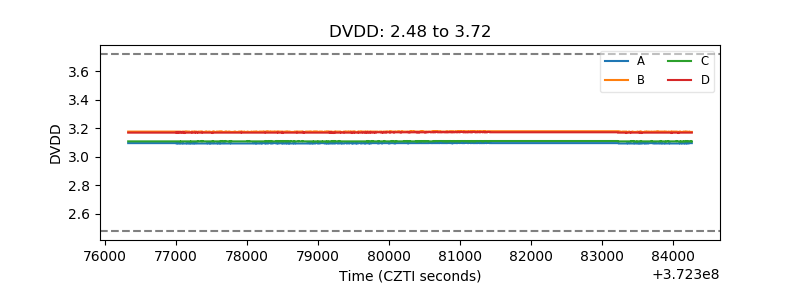 |
| Temperature 1 | 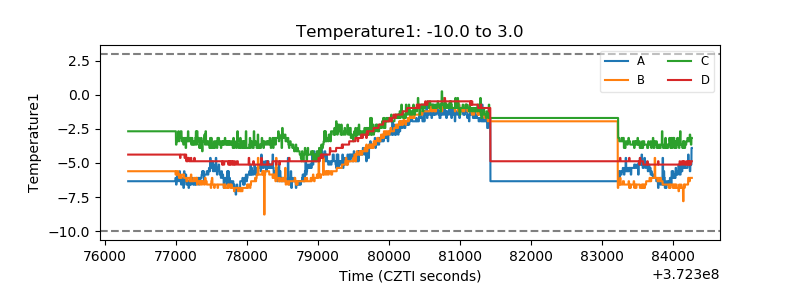 |
| Veto HV Monitor | 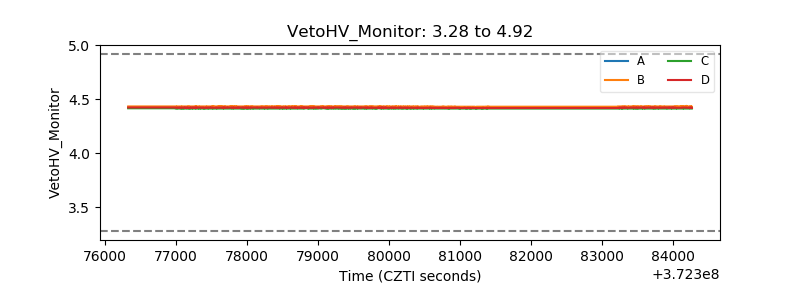 |
| Veto LLD | 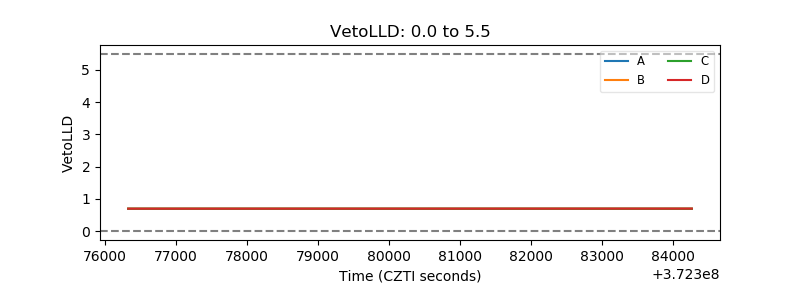 |
| Alpha Counter | 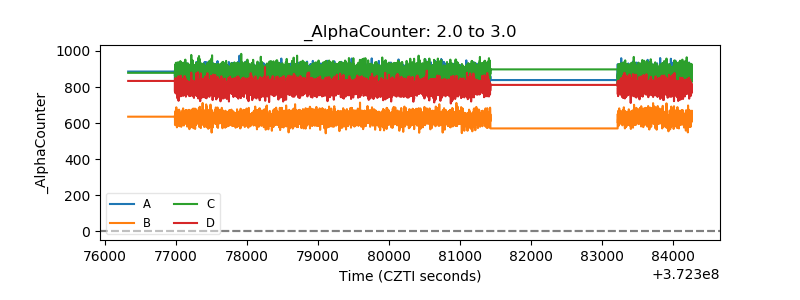 |
| _CPM_Rate | 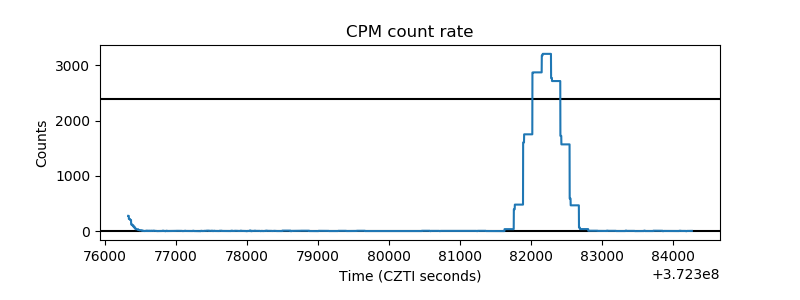 |
| CZT Counter | 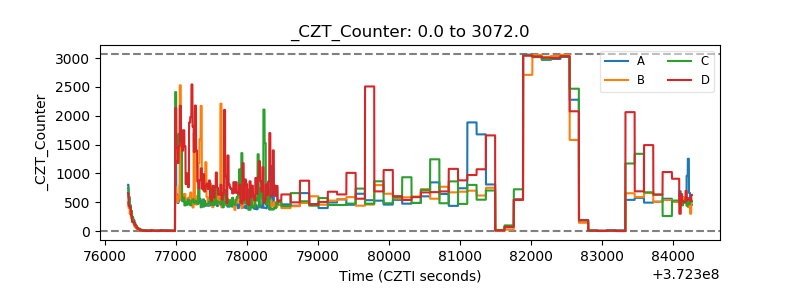 |
| +2.5 Volts monitor | 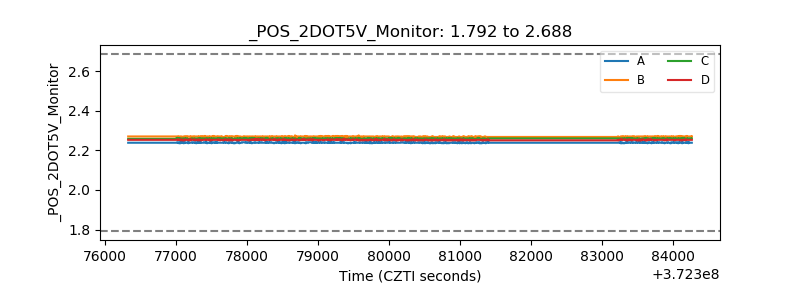 |
| +5 Volts monitor | 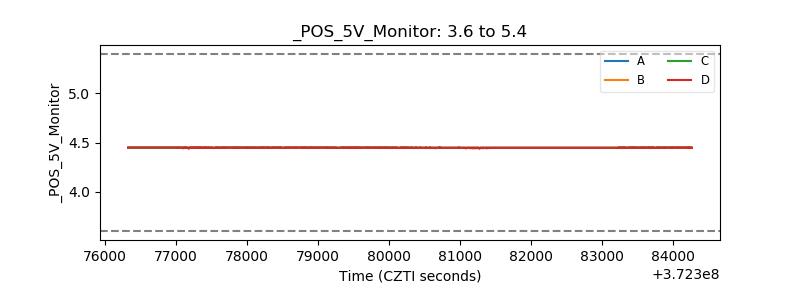 |
| _ROLL_ROT | 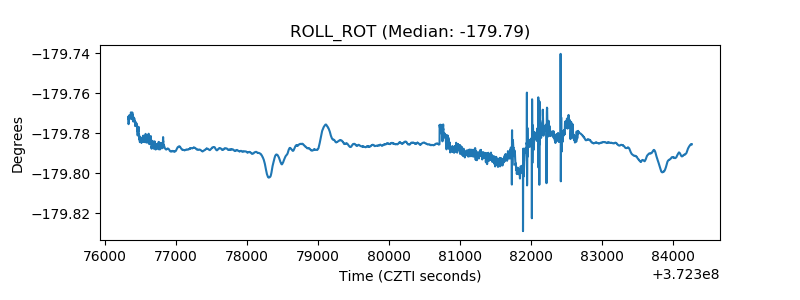 |
| _Roll_DEC | 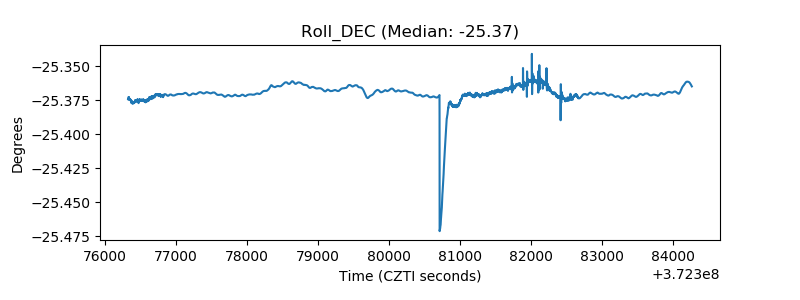 |
| _Roll_RA | 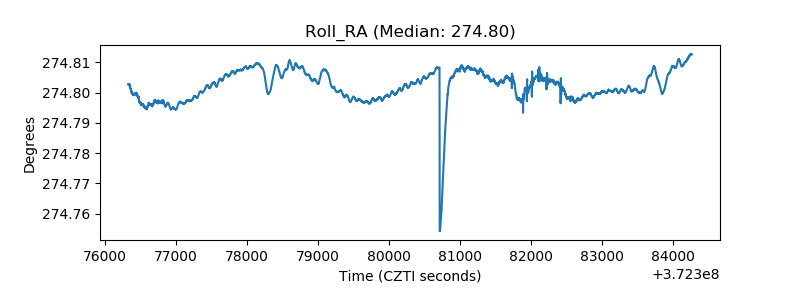 |
| Veto Counter | 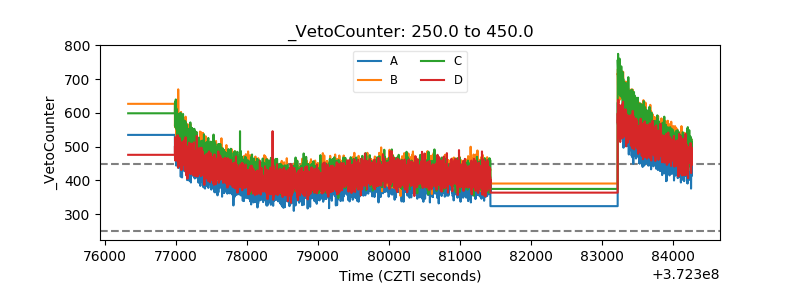 |