| Param | Original file | Final file |
|---|---|---|
| Filename | modeM0/AS1T04_064T01_9000004730_32771cztM0_level2.evt | modeM0/AS1T04_064T01_9000004730_32771cztM0_level2_quad_clean.evt |
| Size (bytes) | 560,485,440 | 60,557,760 |
| Size | 534.5 MB | 57.8 MB |
| Events in quadrant A | 3,877,945 | 363,836 |
| Events in quadrant B | 3,134,980 | 387,315 |
| Events in quadrant C | 2,865,627 | 385,838 |
| Events in quadrant D | 6,752,692 | 340,183 |
| Mode M9 | |||
|---|---|---|---|
| Quadrant | BADHDUFLAG | Total packets | Discarded packets |
| A | 0 | 25 | 0 |
| B | 0 | 25 | 0 |
| C | 0 | 25 | 0 |
| D | 0 | 26 | 0 |
| Mode SS | |||
|---|---|---|---|
| Quadrant | BADHDUFLAG | Total packets | Discarded packets |
| A | 0 | 104 | 0 |
| B | 0 | 104 | 0 |
| C | 0 | 104 | 0 |
| D | 0 | 104 | 0 |
| Mode M0 | |||
|---|---|---|---|
| Quadrant | BADHDUFLAG | Total packets | Discarded packets |
| A | 0 | 14797 | 3 |
| B | 0 | 12614 | 2 |
| C | 0 | 11313 | 2 |
| D | 0 | 23595 | 2 |
| Quadrant | Total seconds | Saturated seconds | Saturation percentage |
|---|---|---|---|
| A | 5080 | 195 | 3.838583% |
| B | 5080 | 53 | 1.043307% |
| C | 5080 | 56 | 1.102362% |
| D | 5080 | 639 | 12.578740% |
Noise dominated data is calculated using 1-second bins in cleaned event files. If a bin has >2000 counts, and if more than 50% of those come from <1% of pixels, then it is considered to be noise-dominated and hence unusable.
| Quadrant | # 1 sec bins | Bins with >0 counts | Bins with >2000 counts | High rate bins dominated by noise | Noise dominated (total time) | Noise dominated (detector-on time) | Marked lightcurve |
|---|---|---|---|---|---|---|---|
| A | 7113 | 5081 | 138 | 138 | 1.94% | 2.72% | 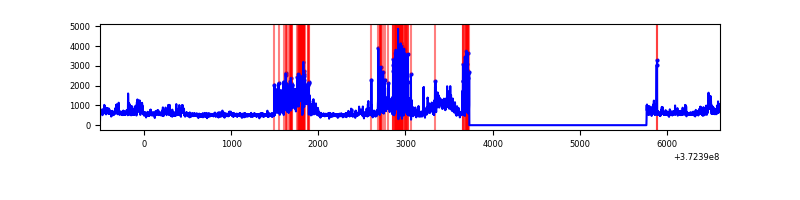 |
| B | 7113 | 5081 | 29 | 29 | 0.41% | 0.57% | 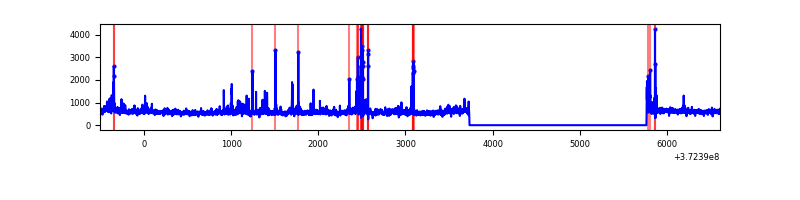 |
| C | 7113 | 5081 | 40 | 40 | 0.56% | 0.79% | 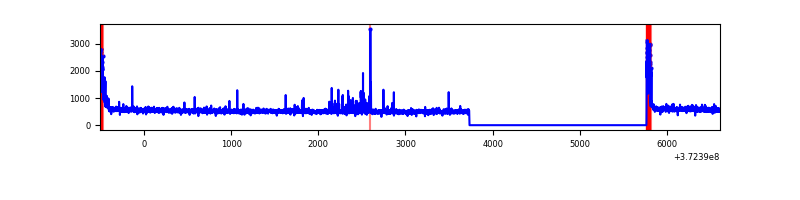 |
| D | 7113 | 5081 | 586 | 586 | 8.24% | 11.53% | 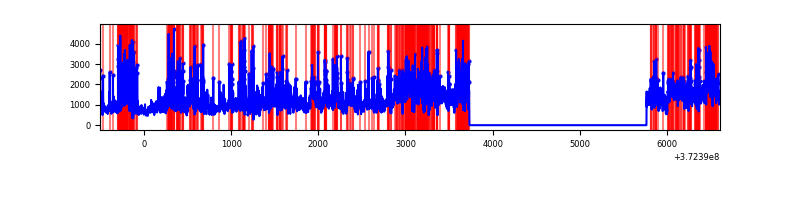 |
Top three noisy pixels from each quadrant. If the there are fewer than three noisy pixels in the level2.evt file, extra rows are filled as -1
| Pixel properties | Quadrant properties | ||||||
|---|---|---|---|---|---|---|---|
| Quadrant | DetID | PixID | Counts | Sigma | Mean | Median | Sigma |
| A | 15 | 237 | 382261 | 2833.53 | 681 | 671 | 134.7 |
| A | 7 | 16 | 374535 | 2776.16 | 681 | 671 | 134.7 |
| A | 12 | 16 | 345332 | 2559.31 | 681 | 671 | 134.7 |
| B | 5 | 172 | 116468 | 894.66 | 694 | 681 | 129.4 |
| B | 0 | 219 | 101566 | 779.52 | 694 | 681 | 129.4 |
| B | 12 | 1 | 63489 | 485.3 | 694 | 681 | 129.4 |
| C | 0 | 10 | 210291 | 1375.17 | 669 | 676 | 152.4 |
| C | 14 | 67 | 15272 | 95.76 | 669 | 676 | 152.4 |
| C | 3 | 233 | 6856 | 40.54 | 669 | 676 | 152.4 |
| D | 8 | 195 | 2381202 | 14494.73 | 635 | 624 | 164.2 |
| D | 7 | 80 | 657291 | 3998.28 | 635 | 624 | 164.2 |
| D | 2 | 249 | 389195 | 2365.91 | 635 | 624 | 164.2 |
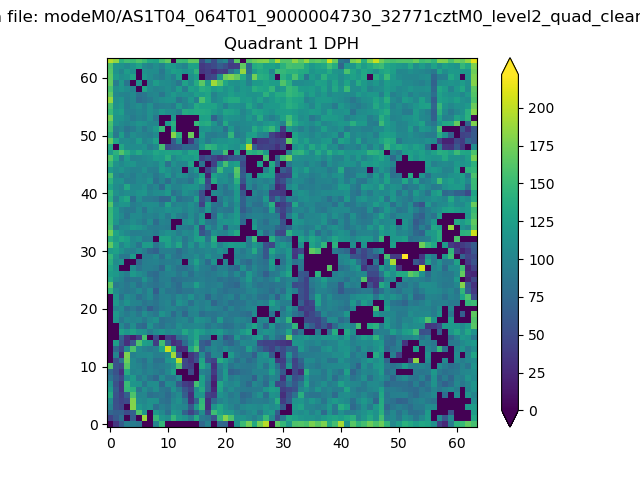
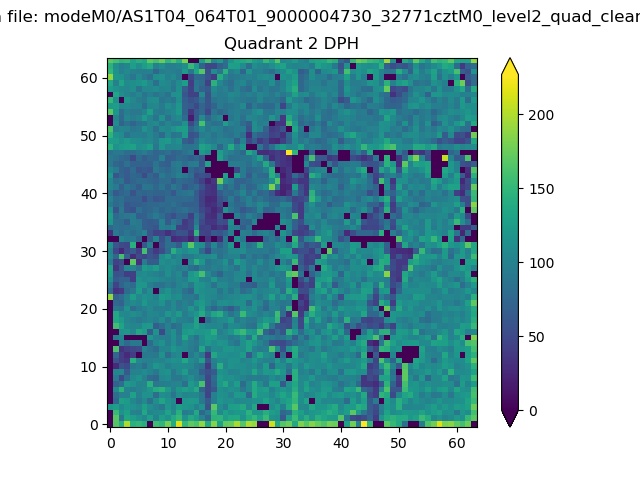
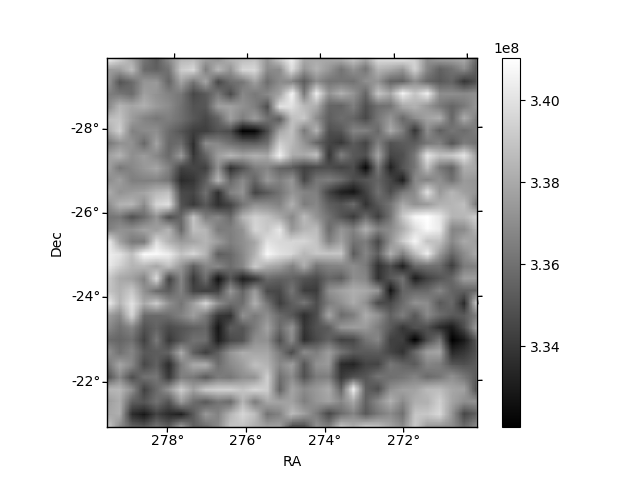
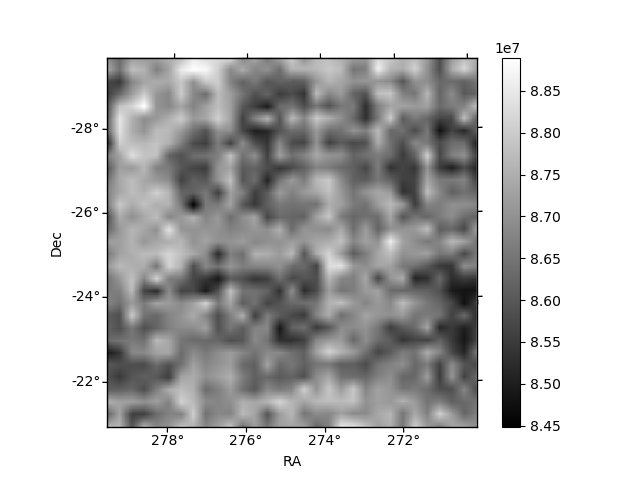
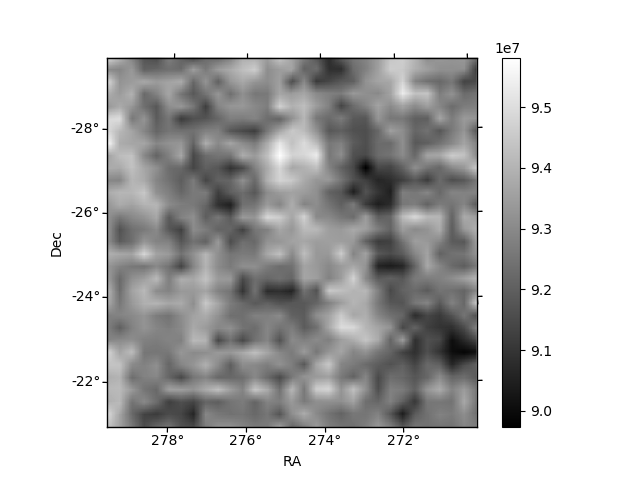
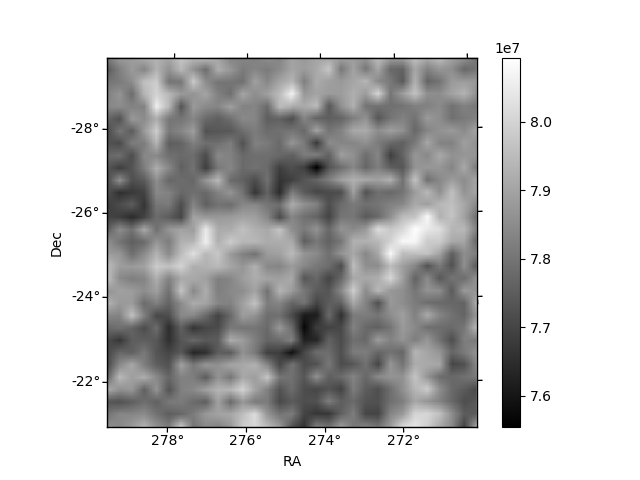
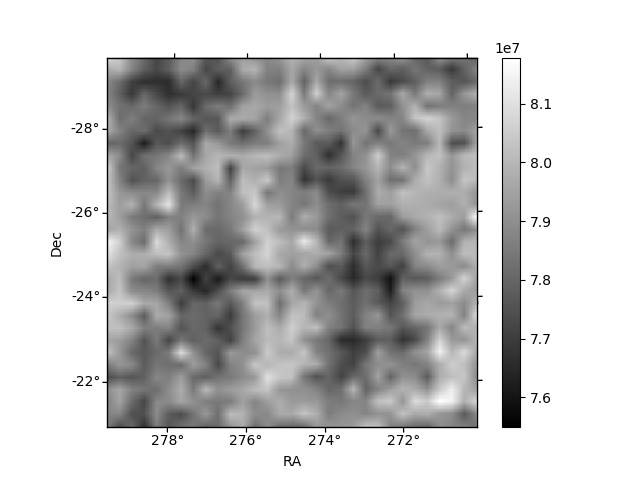
Histogram calculated using DETX and DETY for each event in the final _common_clean file
| Quadrant A |  |
 |
Quadrant B |
|---|---|---|---|
| Quadrant D | 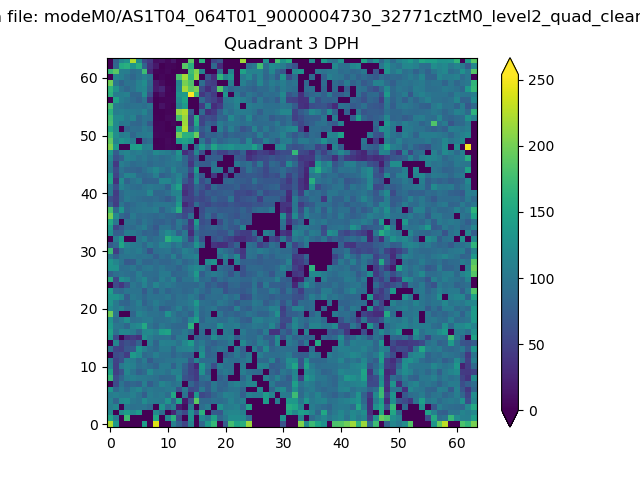 |
 |
Quadrant C |
| Plot type | Count rate plots | Images |
|---|---|---|
| Comparison with Poisson distribution Blue bars denote a histogram of data divided into 1 sec bins. Red curve is a Poisson curve with rate = median count rate of data. |
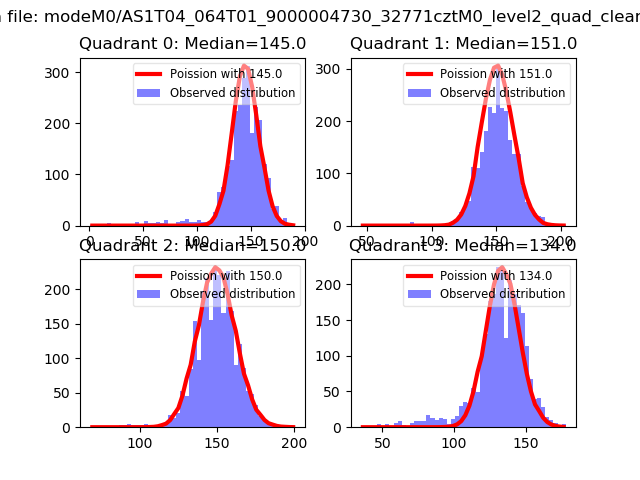 |
 |
| Quadrant-wise count rates Data is divided into 100 sec bins |
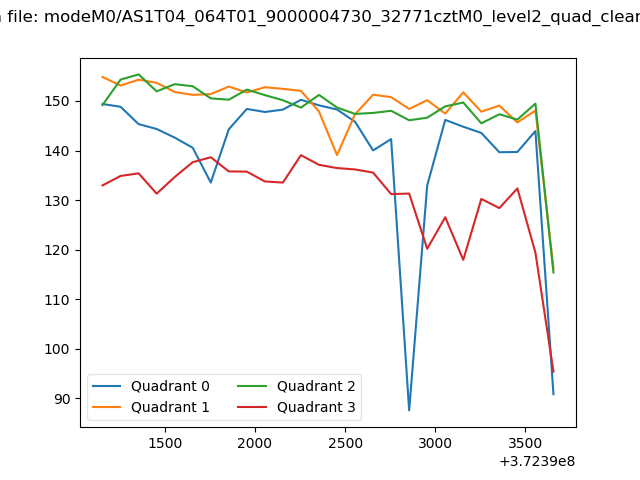 |
|
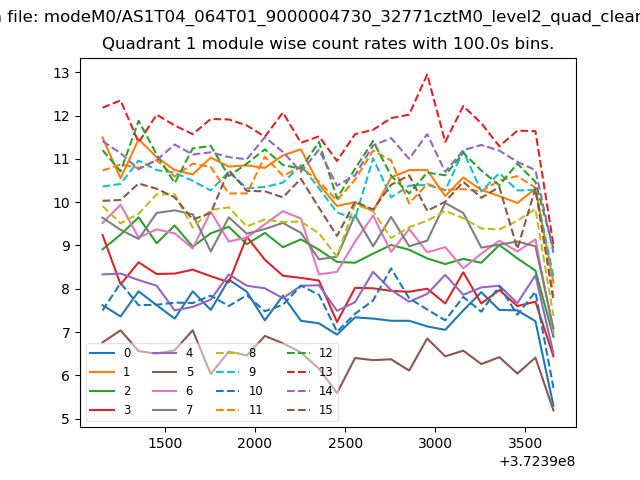
| Module-wise count rates for Quadrant A Data is divided into 100 sec bins |
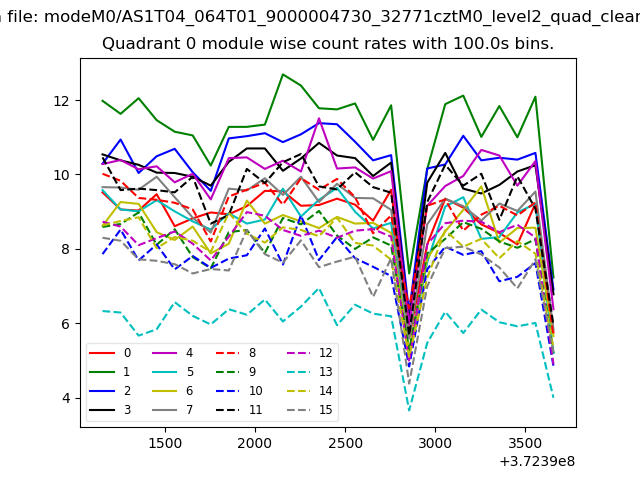 |
 |
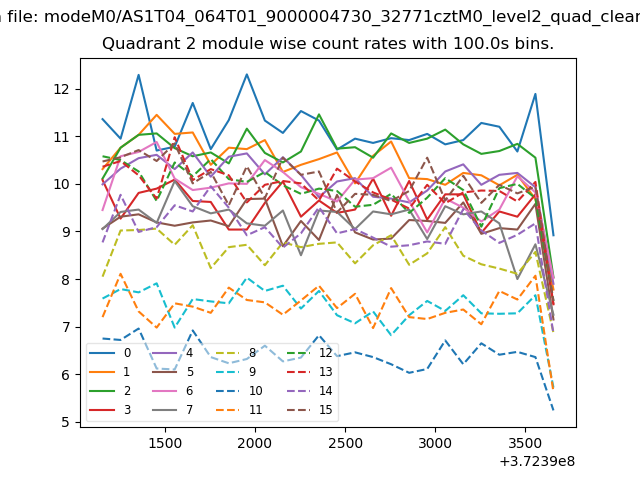
| Module-wise count rates for Quadrant B Data is divided into 100 sec bins |
 |
 |
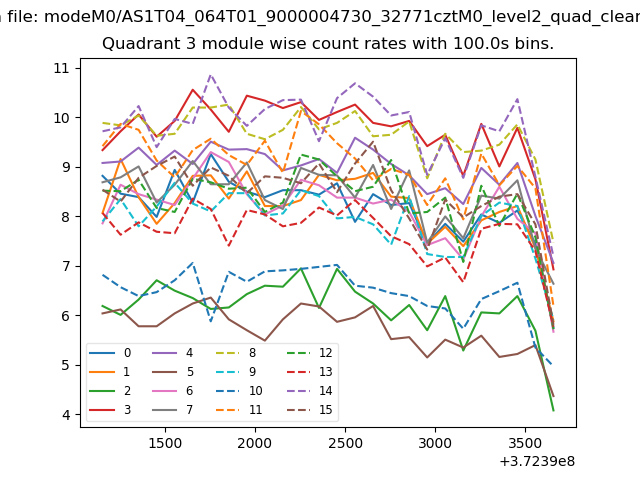
| Module-wise count rates for Quadrant C Data is divided into 100 sec bins |
 |
 |
| Module-wise count rates for Quadrant D Data is divided into 100 sec bins |
 |
 |
| Parameter | Plot |
|---|---|
| CZT HV Monitor | 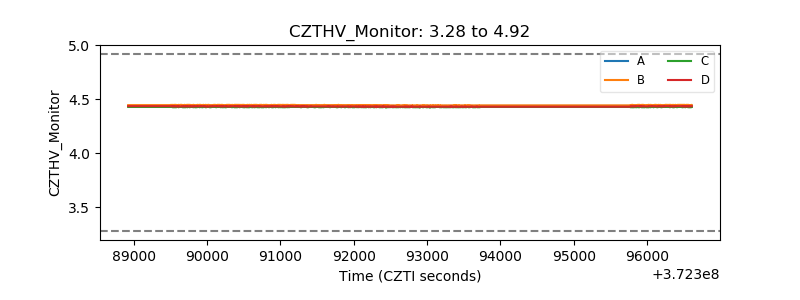 |
| D_VDD | 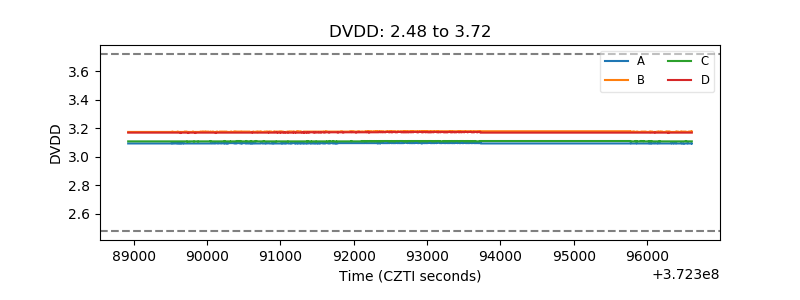 |
| Temperature 1 | 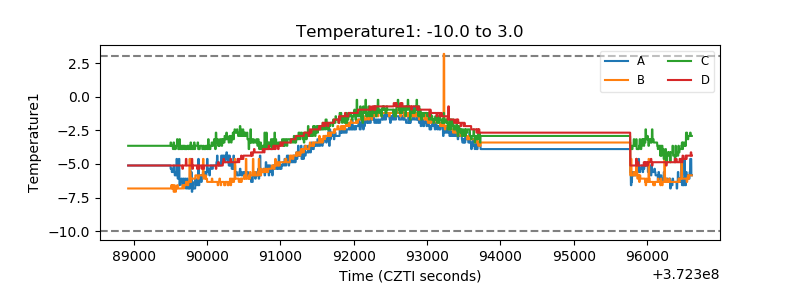 |
| Veto HV Monitor | 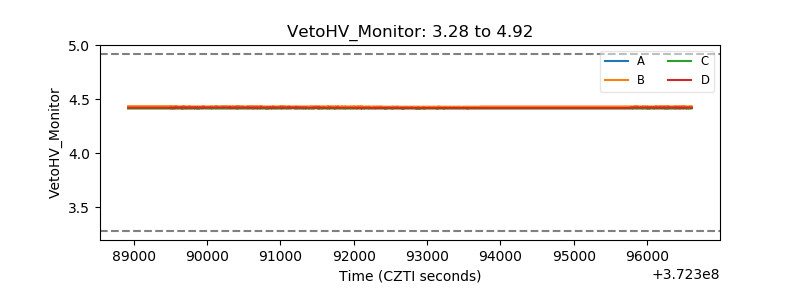 |
| Veto LLD | 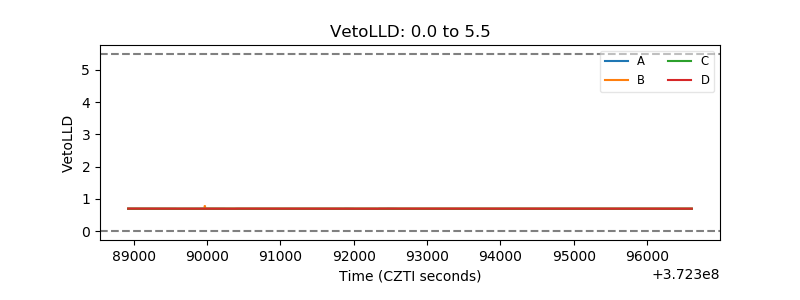 |
| Alpha Counter | 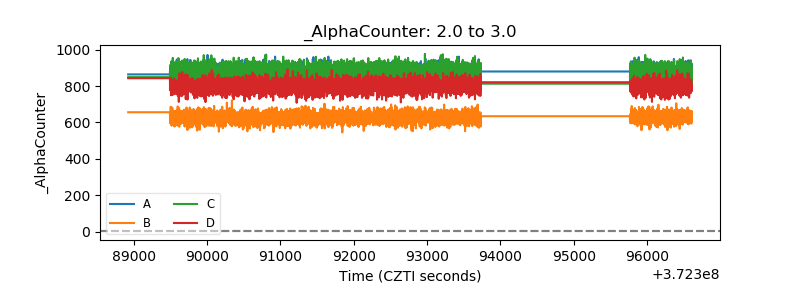 |
| _CPM_Rate |  |
| CZT Counter | 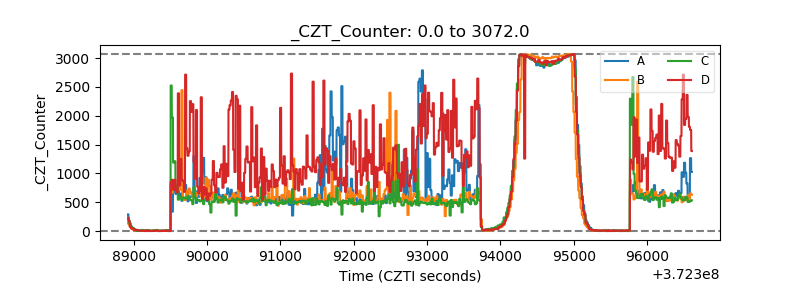 |
| +2.5 Volts monitor |  |
| +5 Volts monitor | 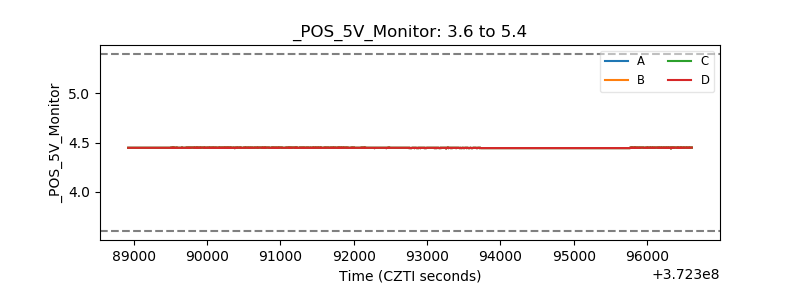 |
| _ROLL_ROT | 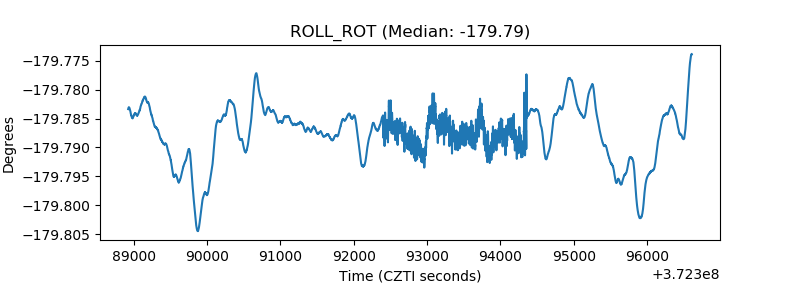 |
| _Roll_DEC | 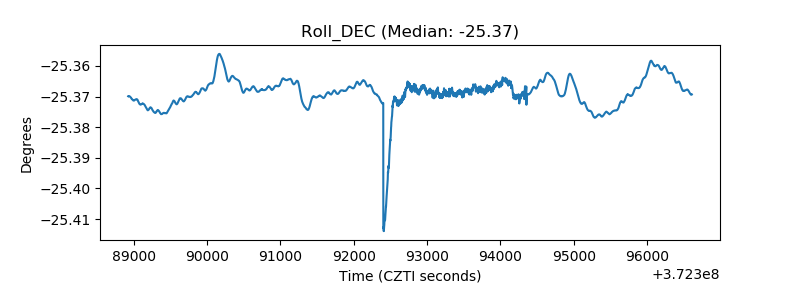 |
| _Roll_RA | 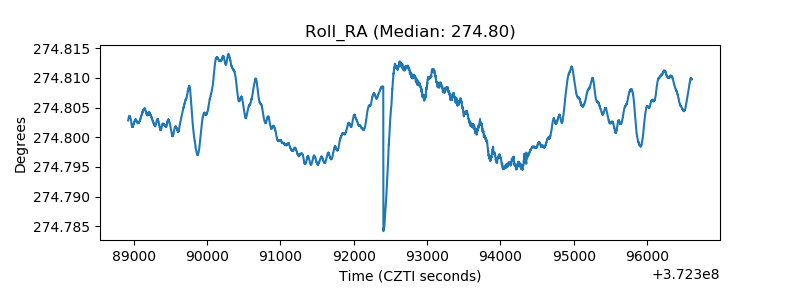 |
| Veto Counter | 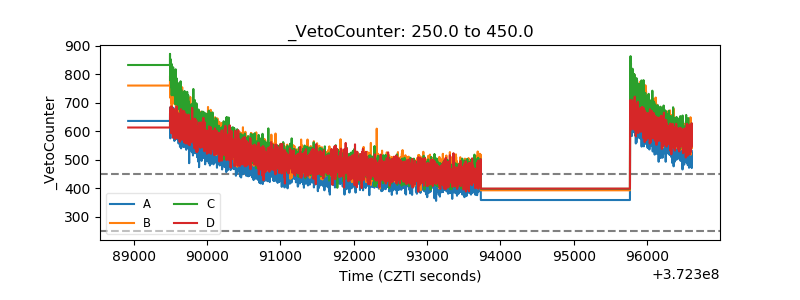 |