| Param | Original file | Final file |
|---|---|---|
| Filename | modeM0/AS1T04_064T01_9000004730_32772cztM0_level2.evt | modeM0/AS1T04_064T01_9000004730_32772cztM0_level2_quad_clean.evt |
| Size (bytes) | 628,151,040 | 65,963,520 |
| Size | 599.1 MB | 62.9 MB |
| Events in quadrant A | 4,052,620 | 413,356 |
| Events in quadrant B | 2,925,639 | 450,306 |
| Events in quadrant C | 2,904,924 | 447,321 |
| Events in quadrant D | 8,804,250 | 336,144 |
| Mode M9 | |||
|---|---|---|---|
| Quadrant | BADHDUFLAG | Total packets | Discarded packets |
| A | 0 | 26 | 0 |
| B | 0 | 26 | 0 |
| C | 0 | 26 | 0 |
| D | 0 | 27 | 0 |
| Mode SS | |||
|---|---|---|---|
| Quadrant | BADHDUFLAG | Total packets | Discarded packets |
| A | 0 | 102 | 0 |
| B | 0 | 102 | 0 |
| C | 0 | 102 | 0 |
| D | 0 | 102 | 0 |
| Mode M0 | |||
|---|---|---|---|
| Quadrant | BADHDUFLAG | Total packets | Discarded packets |
| A | 0 | 15397 | 3 |
| B | 0 | 11781 | 2 |
| C | 0 | 11452 | 2 |
| D | 0 | 29578 | 2 |
| Quadrant | Total seconds | Saturated seconds | Saturation percentage |
|---|---|---|---|
| A | 4981 | 350 | 7.026701% |
| B | 4981 | 31 | 0.622365% |
| C | 4981 | 71 | 1.425417% |
| D | 4981 | 1623 | 32.583819% |
Noise dominated data is calculated using 1-second bins in cleaned event files. If a bin has >2000 counts, and if more than 50% of those come from <1% of pixels, then it is considered to be noise-dominated and hence unusable.
| Quadrant | # 1 sec bins | Bins with >0 counts | Bins with >2000 counts | High rate bins dominated by noise | Noise dominated (total time) | Noise dominated (detector-on time) | Marked lightcurve |
|---|---|---|---|---|---|---|---|
| A | 7074 | 4982 | 246 | 246 | 3.48% | 4.94% | 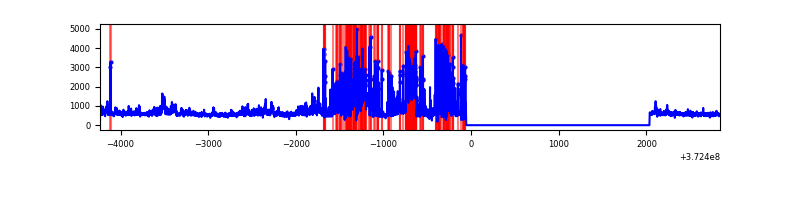 |
| B | 7074 | 4982 | 17 | 17 | 0.24% | 0.34% | 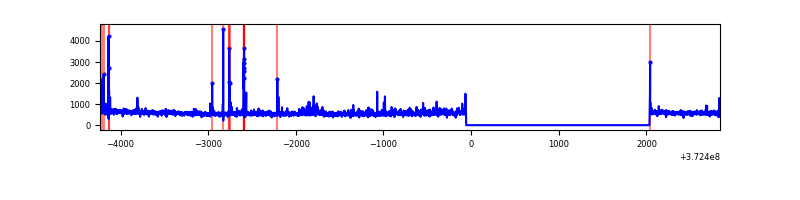 |
| C | 7074 | 4982 | 50 | 50 | 0.71% | 1.00% | 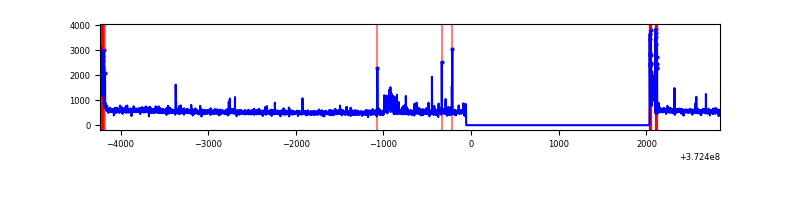 |
| D | 7074 | 4982 | 1737 | 1737 | 24.55% | 34.87% | 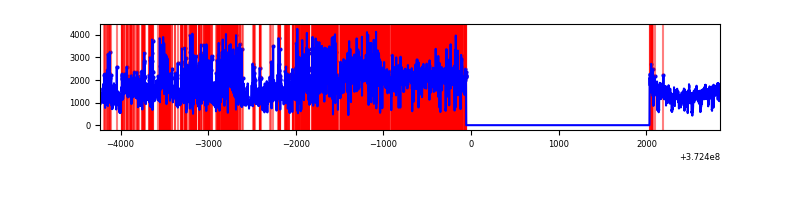 |
Top three noisy pixels from each quadrant. If the there are fewer than three noisy pixels in the level2.evt file, extra rows are filled as -1
| Pixel properties | Quadrant properties | ||||||
|---|---|---|---|---|---|---|---|
| Quadrant | DetID | PixID | Counts | Sigma | Mean | Median | Sigma |
| A | 15 | 237 | 877791 | 6678.25 | 661 | 651 | 131.3 |
| A | 12 | 16 | 496803 | 3777.54 | 661 | 651 | 131.3 |
| A | 12 | 194 | 77165 | 582.55 | 661 | 651 | 131.3 |
| B | 0 | 219 | 94917 | 744.51 | 680 | 667 | 126.6 |
| B | 5 | 172 | 81645 | 639.67 | 680 | 667 | 126.6 |
| B | 10 | 246 | 18171 | 138.27 | 680 | 667 | 126.6 |
| C | 0 | 10 | 215660 | 1442.25 | 654 | 663 | 149.1 |
| C | 4 | 254 | 48630 | 321.77 | 654 | 663 | 149.1 |
| C | 3 | 233 | 29919 | 196.26 | 654 | 663 | 149.1 |
| D | 8 | 195 | 4252862 | 28128.53 | 587 | 577 | 151.2 |
| D | 2 | 249 | 1539248 | 10178.19 | 587 | 577 | 151.2 |
| D | 7 | 80 | 147424 | 971.38 | 587 | 577 | 151.2 |
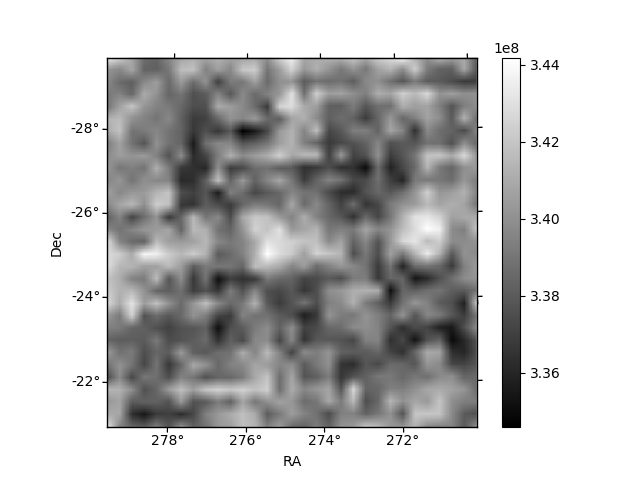
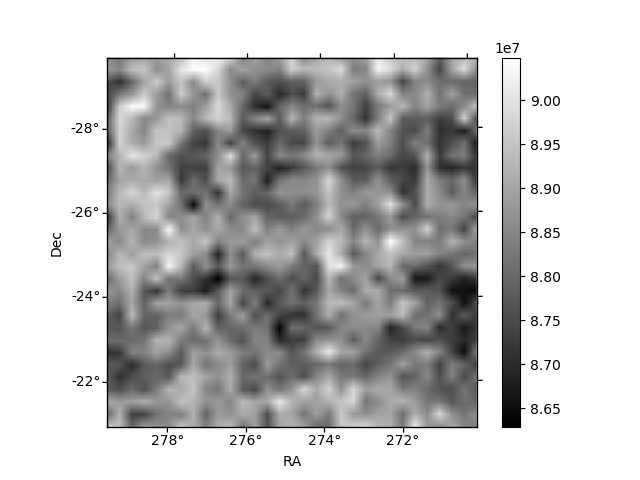
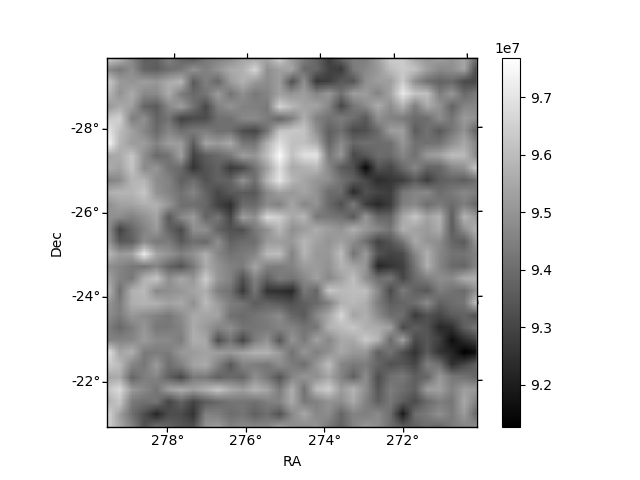
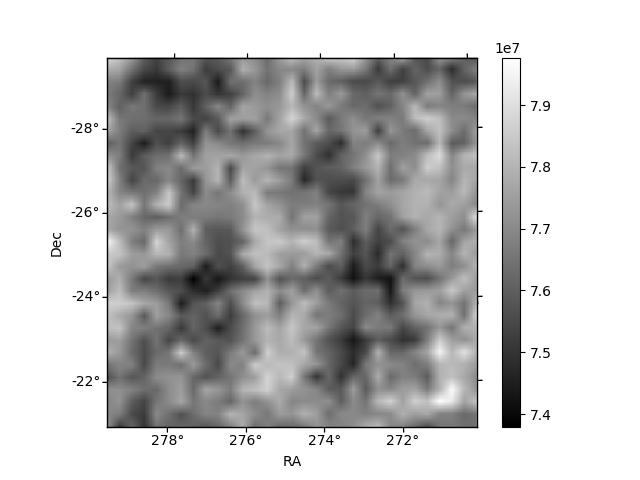
Histogram calculated using DETX and DETY for each event in the final _common_clean file
| Quadrant A | 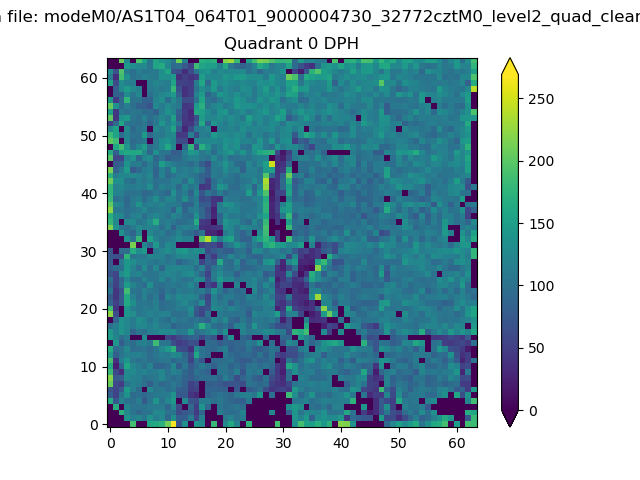 |
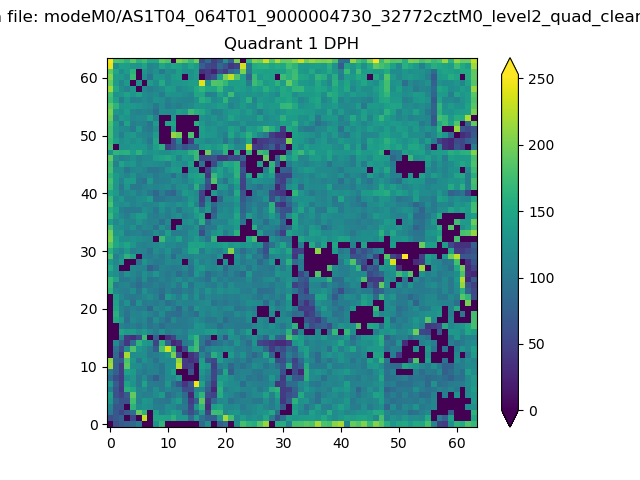 |
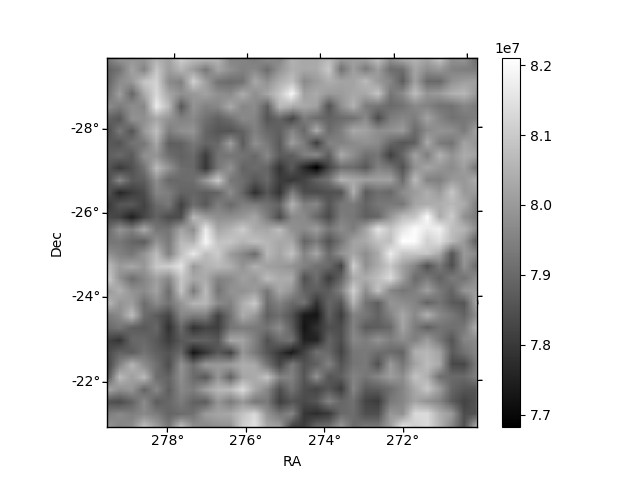
Quadrant B |
|---|---|---|---|
| Quadrant D | 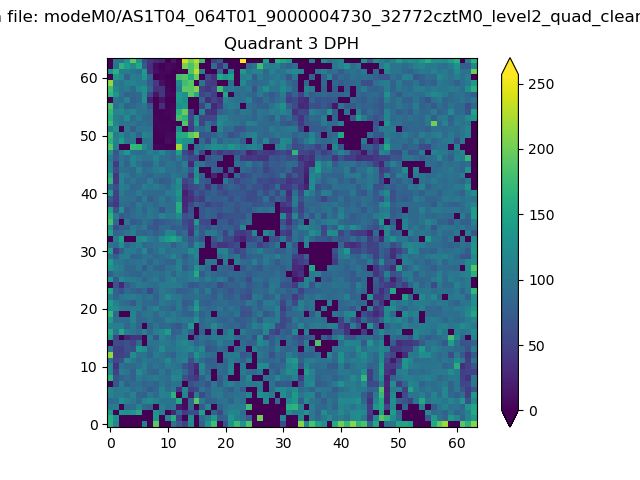 |
 |
Quadrant C |
| Plot type | Count rate plots | Images |
|---|---|---|
| Comparison with Poisson distribution Blue bars denote a histogram of data divided into 1 sec bins. Red curve is a Poisson curve with rate = median count rate of data. |
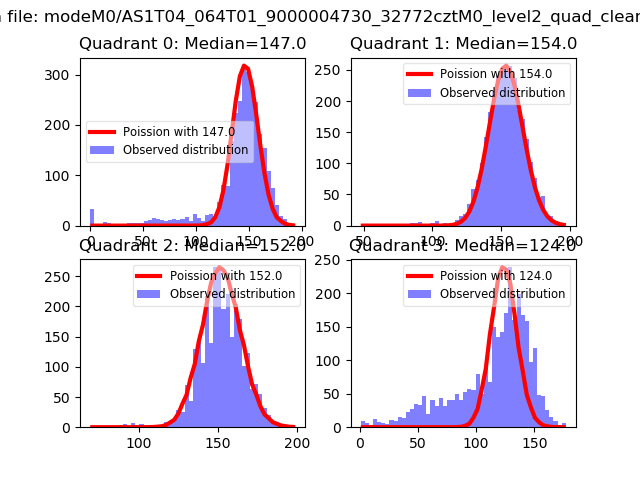 |
 |
| Quadrant-wise count rates Data is divided into 100 sec bins |
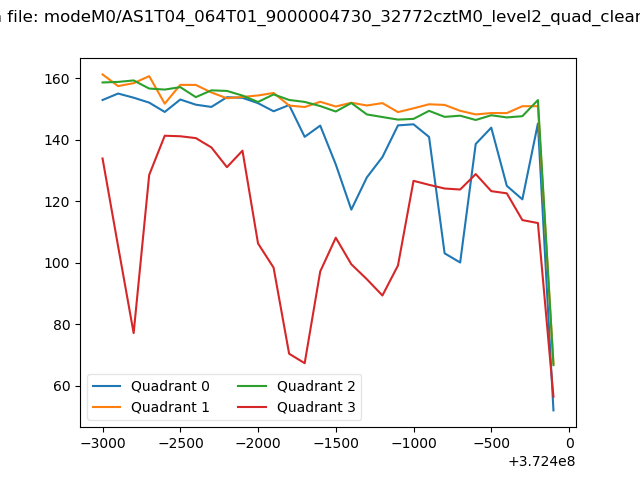 |
|
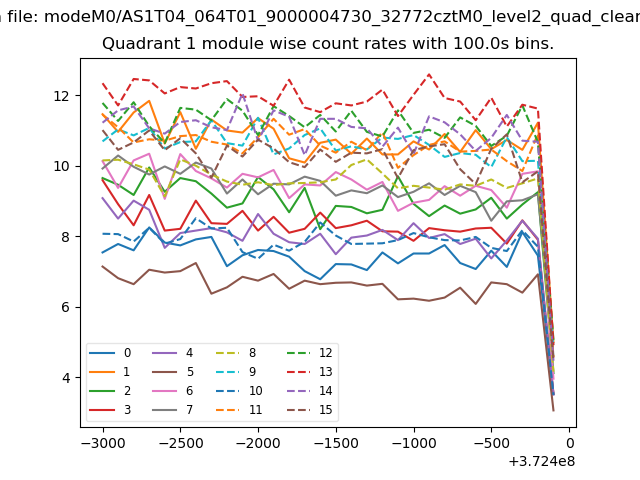
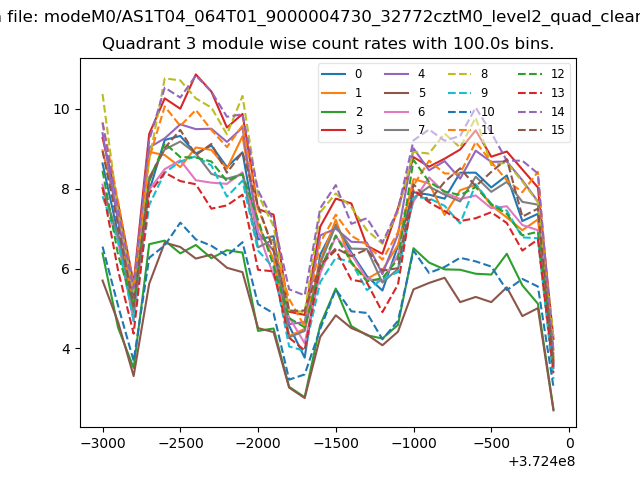
| Module-wise count rates for Quadrant A Data is divided into 100 sec bins |
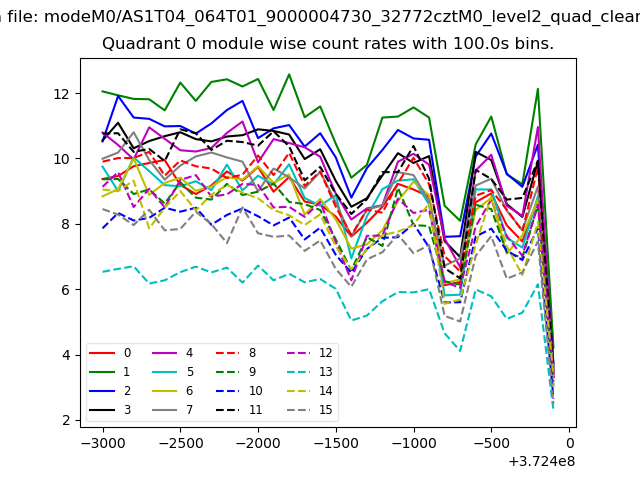 |
 |
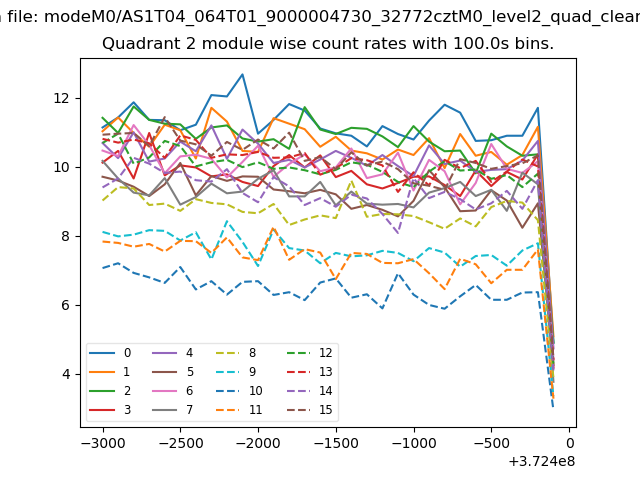
| Module-wise count rates for Quadrant B Data is divided into 100 sec bins |
 |
 |
| Module-wise count rates for Quadrant C Data is divided into 100 sec bins |
 |
 |
| Module-wise count rates for Quadrant D Data is divided into 100 sec bins |
 |
 |
| Parameter | Plot |
|---|---|
| CZT HV Monitor | 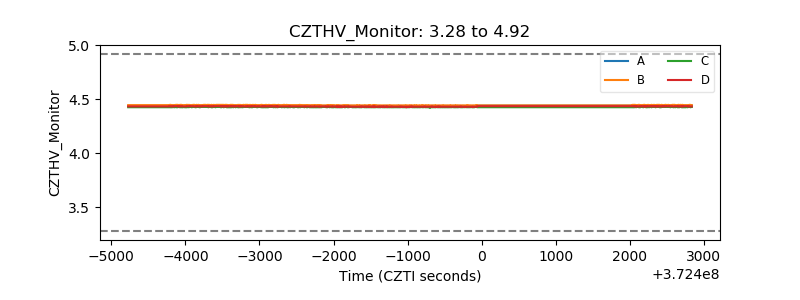 |
| D_VDD | 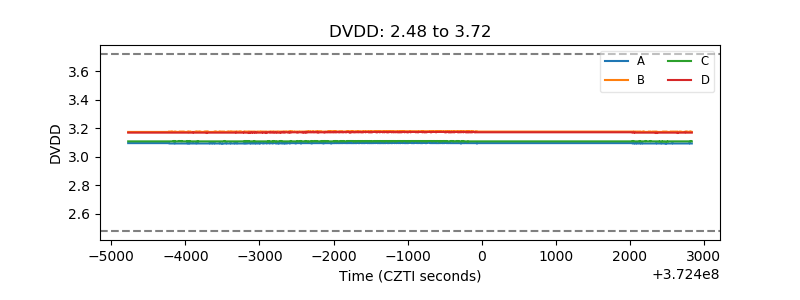 |
| Temperature 1 | 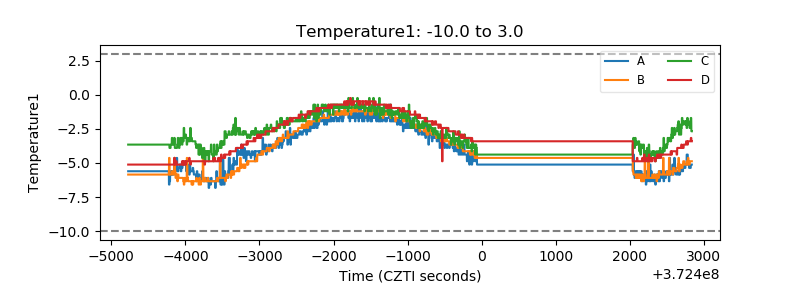 |
| Veto HV Monitor | 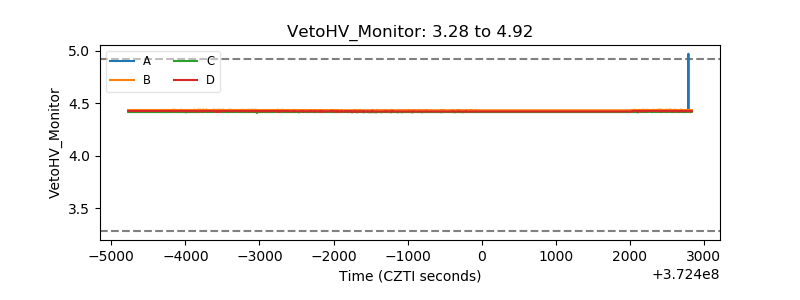 |
| Veto LLD | 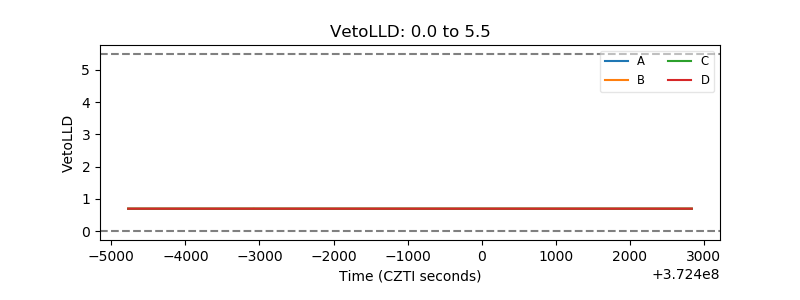 |
| Alpha Counter | 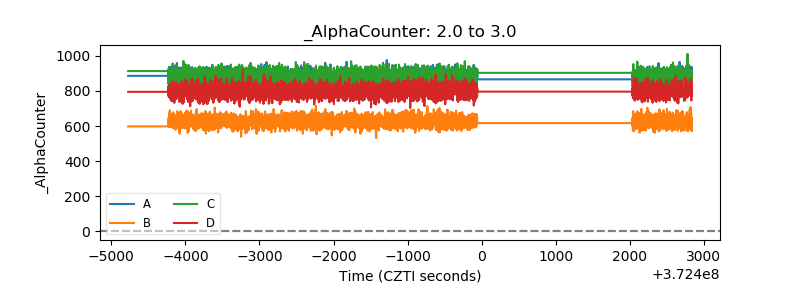 |
| _CPM_Rate | 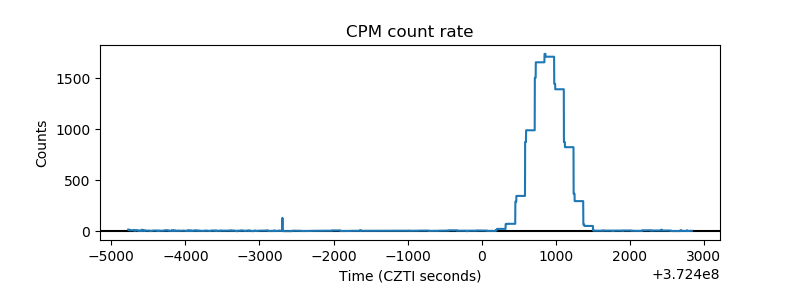 |
| CZT Counter | 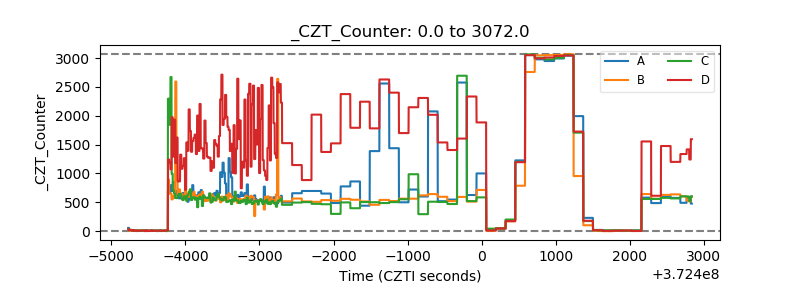 |
| +2.5 Volts monitor |  |
| +5 Volts monitor |  |
| _ROLL_ROT | 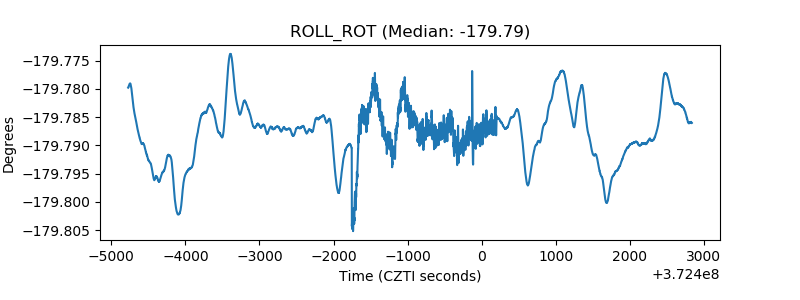 |
| _Roll_DEC | 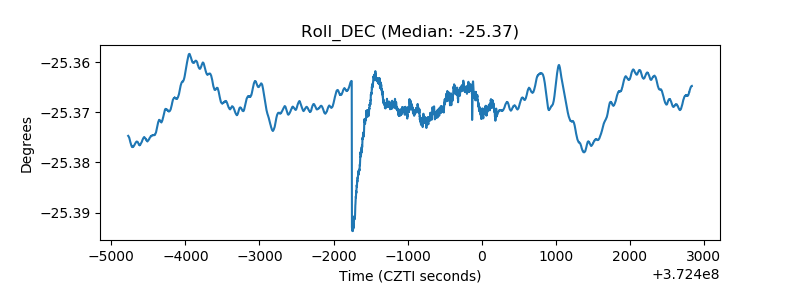 |
| _Roll_RA | 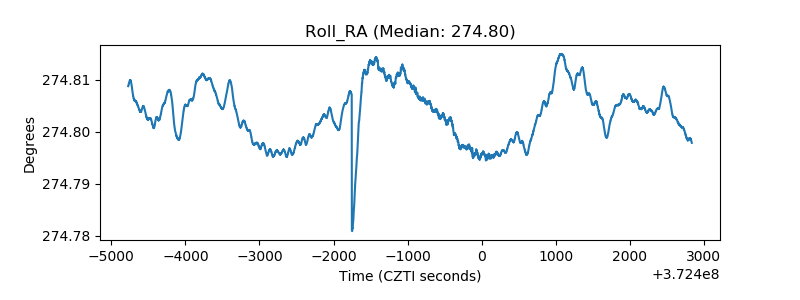 |
| Veto Counter | 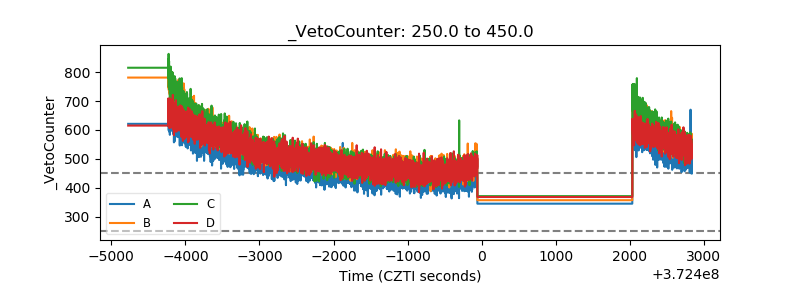 |