| Param | Original file | Final file |
|---|---|---|
| Filename | modeM0/AS1T04_064T01_9000004730_32774cztM0_level2.evt | modeM0/AS1T04_064T01_9000004730_32774cztM0_level2_quad_clean.evt |
| Size (bytes) | 612,832,320 | 89,150,400 |
| Size | 584.4 MB | 85.0 MB |
| Events in quadrant A | 3,908,401 | 593,478 |
| Events in quadrant B | 3,162,189 | 620,336 |
| Events in quadrant C | 2,618,784 | 617,890 |
| Events in quadrant D | 8,530,584 | 514,539 |
| Mode M9 | |||
|---|---|---|---|
| Quadrant | BADHDUFLAG | Total packets | Discarded packets |
| A | 0 | 30 | 0 |
| B | 0 | 30 | 0 |
| C | 0 | 30 | 0 |
| D | 0 | 31 | 0 |
| Mode SS | |||
|---|---|---|---|
| Quadrant | BADHDUFLAG | Total packets | Discarded packets |
| A | 0 | 104 | 0 |
| B | 0 | 104 | 0 |
| C | 0 | 104 | 0 |
| D | 0 | 104 | 0 |
| Mode M0 | |||
|---|---|---|---|
| Quadrant | BADHDUFLAG | Total packets | Discarded packets |
| A | 0 | 14709 | 3 |
| B | 0 | 12543 | 2 |
| C | 0 | 10828 | 2 |
| D | 0 | 28859 | 2 |
| Quadrant | Total seconds | Saturated seconds | Saturation percentage |
|---|---|---|---|
| A | 5031 | 316 | 6.281057% |
| B | 5031 | 53 | 1.053468% |
| C | 5031 | 63 | 1.252236% |
| D | 5031 | 1233 | 24.508050% |
Noise dominated data is calculated using 1-second bins in cleaned event files. If a bin has >2000 counts, and if more than 50% of those come from <1% of pixels, then it is considered to be noise-dominated and hence unusable.
| Quadrant | # 1 sec bins | Bins with >0 counts | Bins with >2000 counts | High rate bins dominated by noise | Noise dominated (total time) | Noise dominated (detector-on time) | Marked lightcurve |
|---|---|---|---|---|---|---|---|
| A | 7033 | 5032 | 288 | 288 | 4.09% | 5.72% | 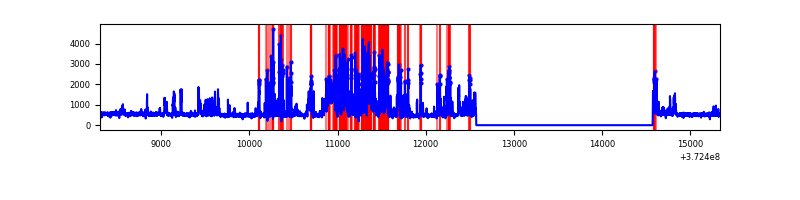 |
| B | 7033 | 5032 | 29 | 29 | 0.41% | 0.58% | 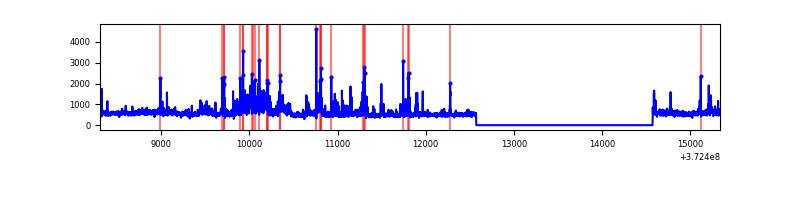 |
| C | 7033 | 5032 | 40 | 40 | 0.57% | 0.79% | 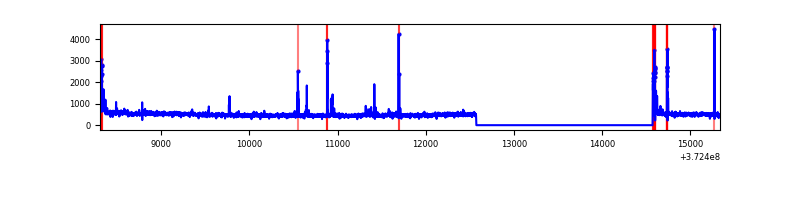 |
| D | 7033 | 5032 | 1461 | 1461 | 20.77% | 29.03% | 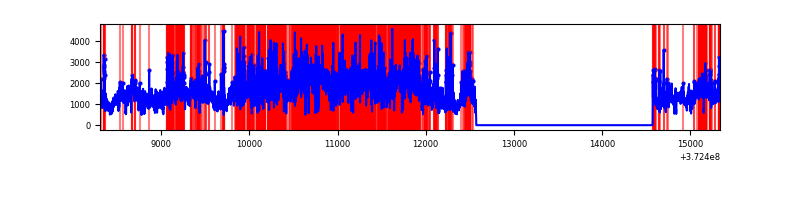 |
Top three noisy pixels from each quadrant. If the there are fewer than three noisy pixels in the level2.evt file, extra rows are filled as -1
| Pixel properties | Quadrant properties | ||||||
|---|---|---|---|---|---|---|---|
| Quadrant | DetID | PixID | Counts | Sigma | Mean | Median | Sigma |
| A | 12 | 16 | 826788 | 6596.75 | 618 | 607 | 125.2 |
| A | 15 | 237 | 495938 | 3955.04 | 618 | 607 | 125.2 |
| A | 12 | 194 | 121828 | 967.91 | 618 | 607 | 125.2 |
| B | 0 | 219 | 357233 | 2997.39 | 628 | 615 | 119.0 |
| B | 5 | 172 | 61254 | 509.67 | 628 | 615 | 119.0 |
| B | 12 | 1 | 56510 | 469.8 | 628 | 615 | 119.0 |
| C | 0 | 10 | 126134 | 911.36 | 603 | 610 | 137.7 |
| C | 0 | 207 | 51422 | 368.92 | 603 | 610 | 137.7 |
| C | 3 | 233 | 22608 | 159.72 | 603 | 610 | 137.7 |
| D | 8 | 195 | 4309463 | 29461.89 | 567 | 556 | 146.3 |
| D | 7 | 80 | 616933 | 4214.44 | 567 | 556 | 146.3 |
| D | 13 | 153 | 307847 | 2101.08 | 567 | 556 | 146.3 |
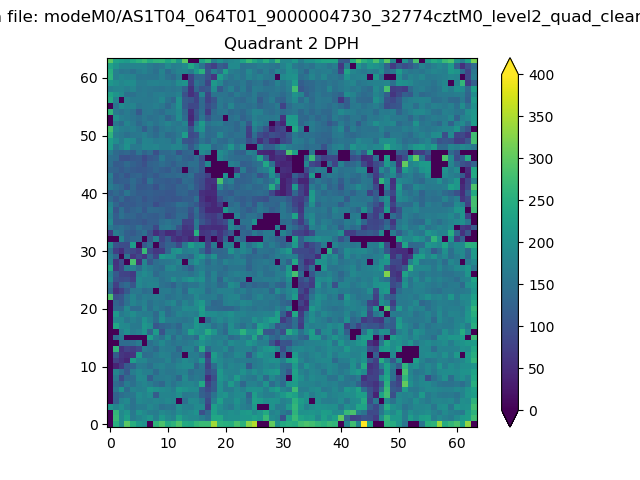
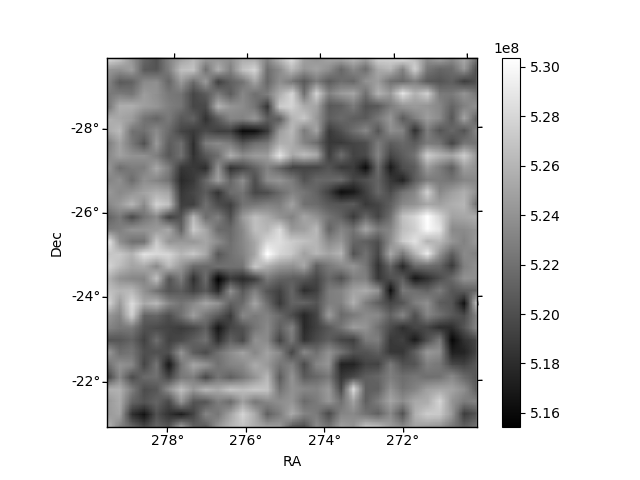
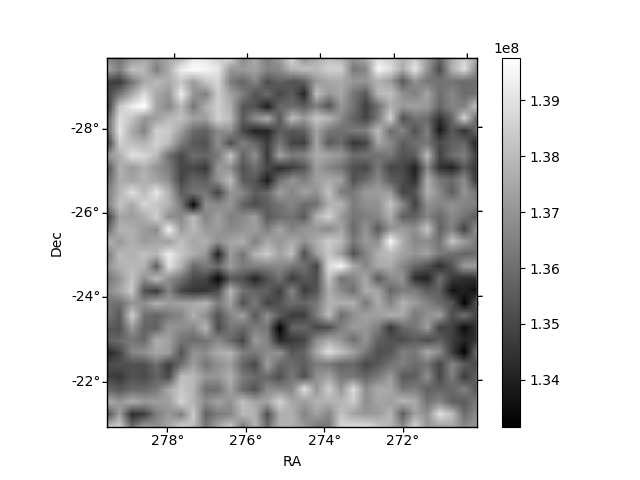
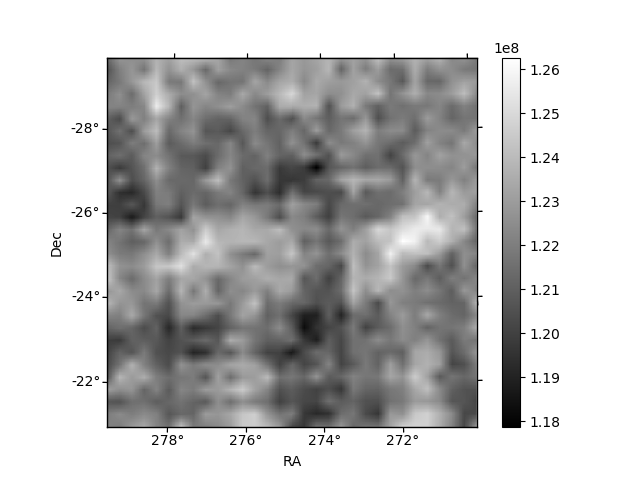
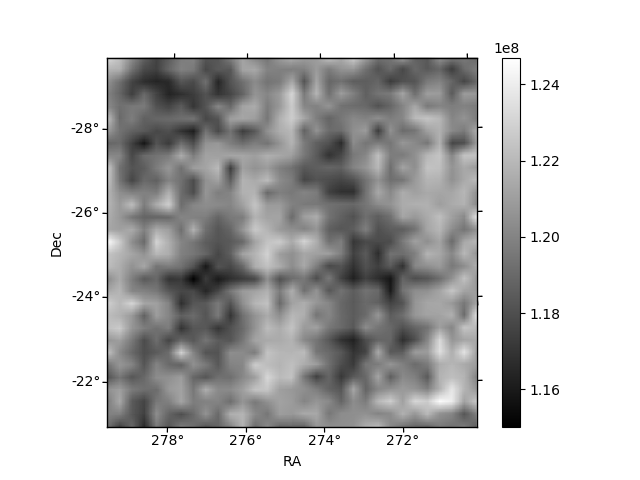
Histogram calculated using DETX and DETY for each event in the final _common_clean file
| Quadrant A | 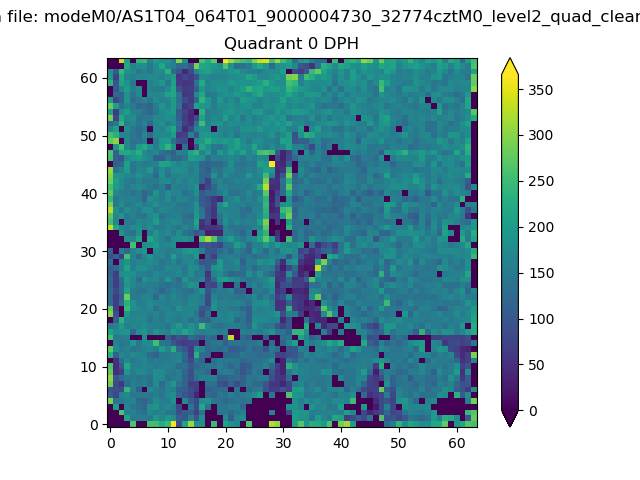 |
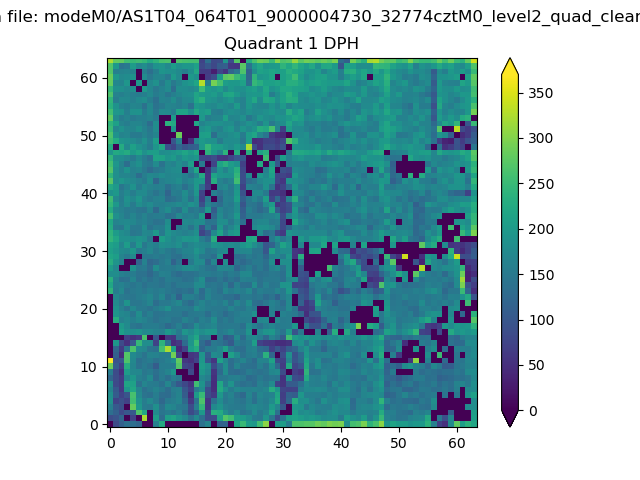 |
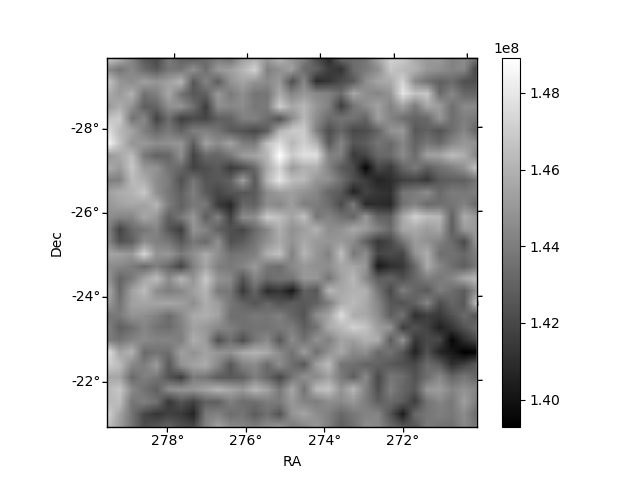
Quadrant B |
|---|---|---|---|
| Quadrant D | 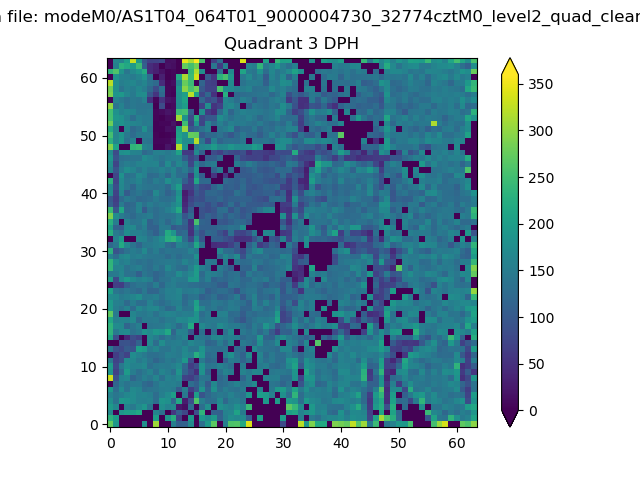 |
 |
Quadrant C |
| Plot type | Count rate plots | Images |
|---|---|---|
| Comparison with Poisson distribution Blue bars denote a histogram of data divided into 1 sec bins. Red curve is a Poisson curve with rate = median count rate of data. |
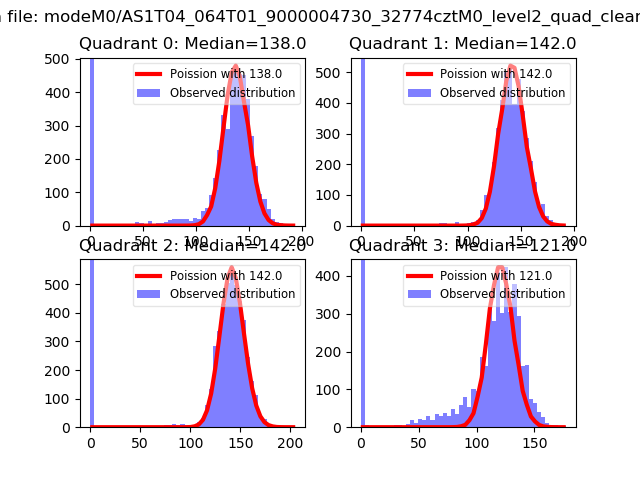 |
 |
| Quadrant-wise count rates Data is divided into 100 sec bins |
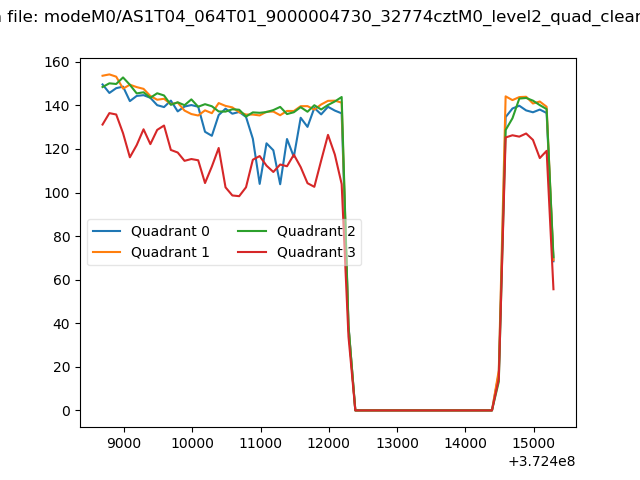 |
|
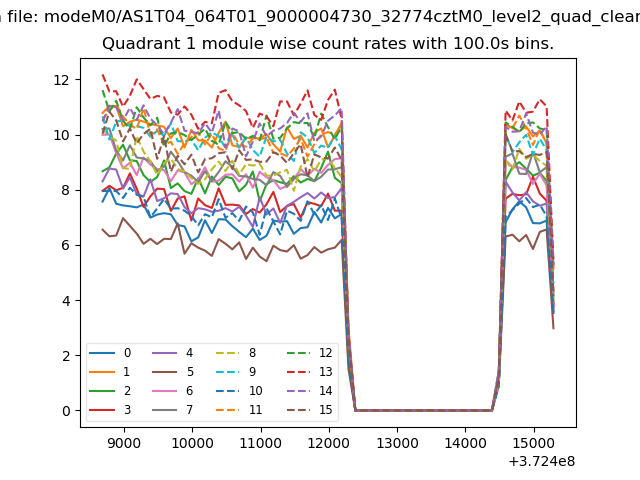
| Module-wise count rates for Quadrant A Data is divided into 100 sec bins |
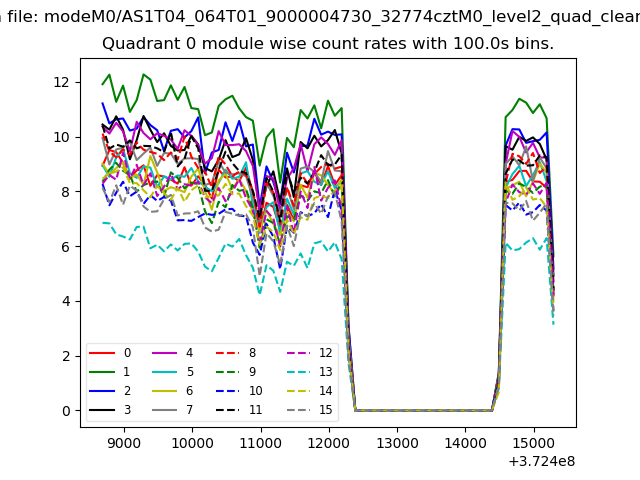 |
 |
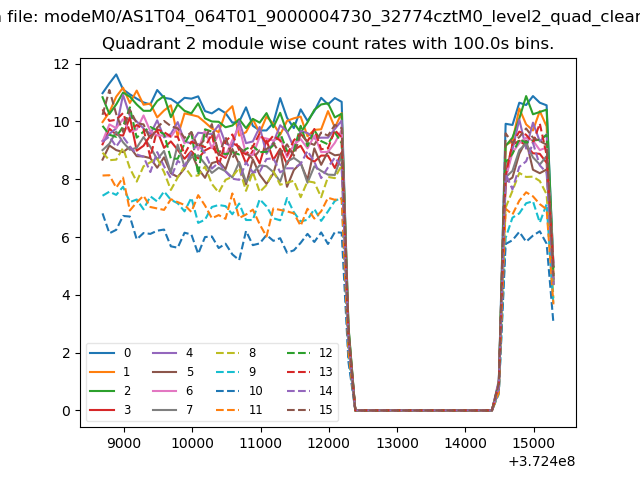
| Module-wise count rates for Quadrant B Data is divided into 100 sec bins |
 |
 |
| Module-wise count rates for Quadrant C Data is divided into 100 sec bins |
 |
 |
| Module-wise count rates for Quadrant D Data is divided into 100 sec bins |
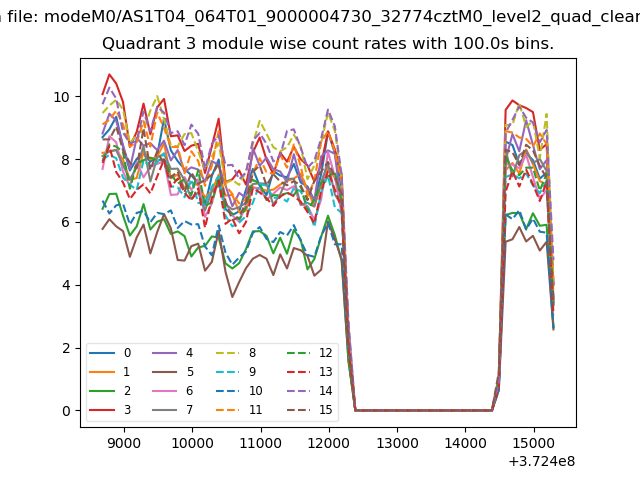 |
 |
| Parameter | Plot |
|---|---|
| CZT HV Monitor |  |
| D_VDD | 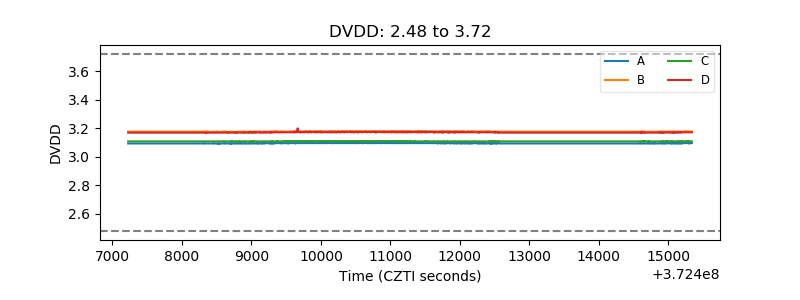 |
| Temperature 1 | 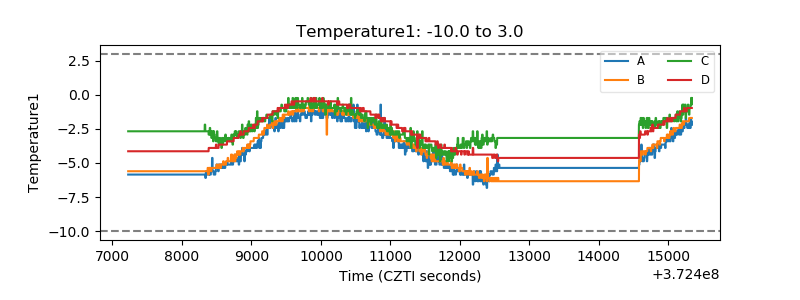 |
| Veto HV Monitor | 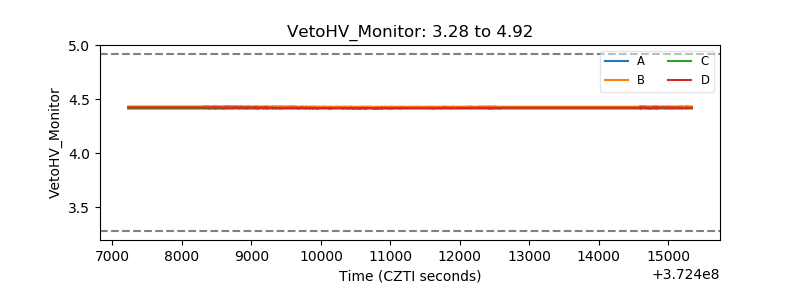 |
| Veto LLD | 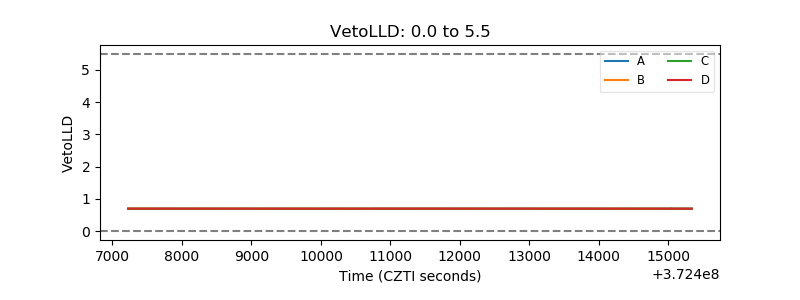 |
| Alpha Counter | 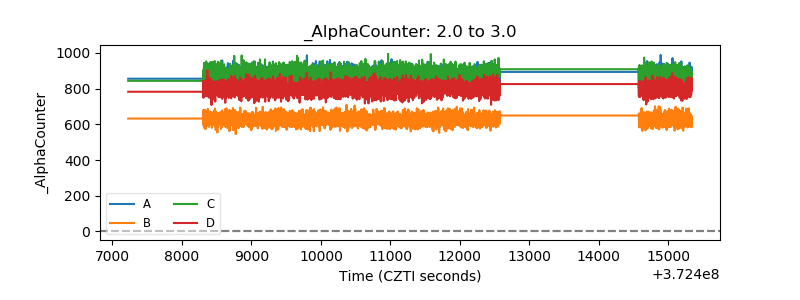 |
| _CPM_Rate | 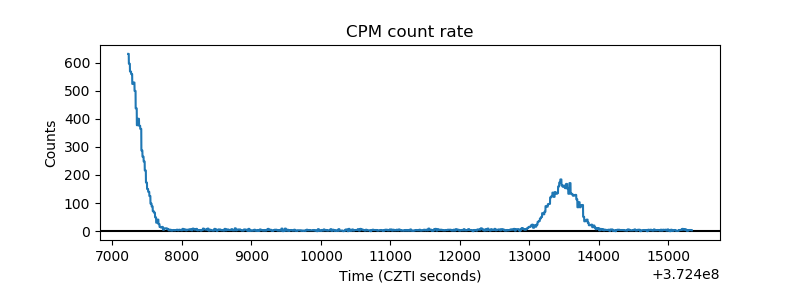 |
| CZT Counter | 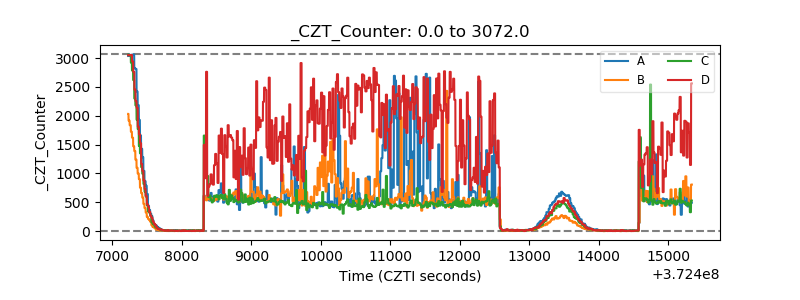 |
| +2.5 Volts monitor |  |
| +5 Volts monitor |  |
| _ROLL_ROT | 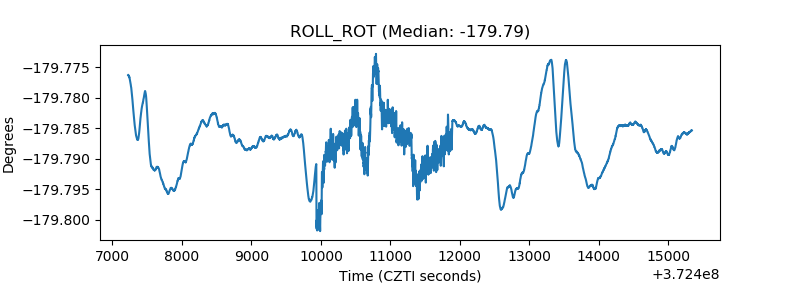 |
| _Roll_DEC | 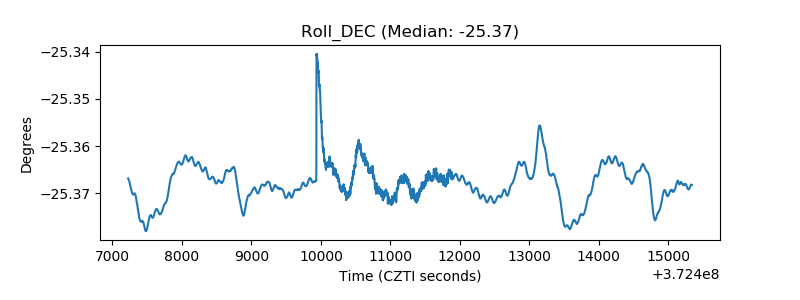 |
| _Roll_RA | 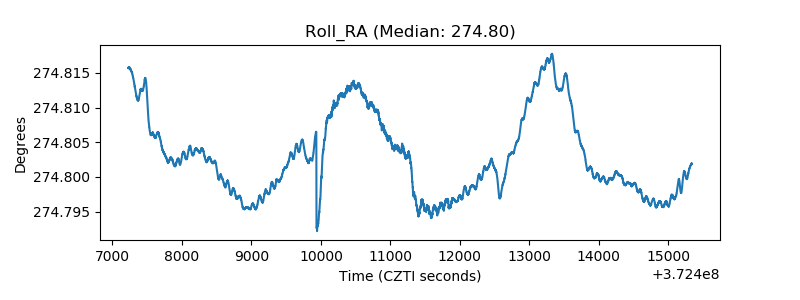 |
| Veto Counter | 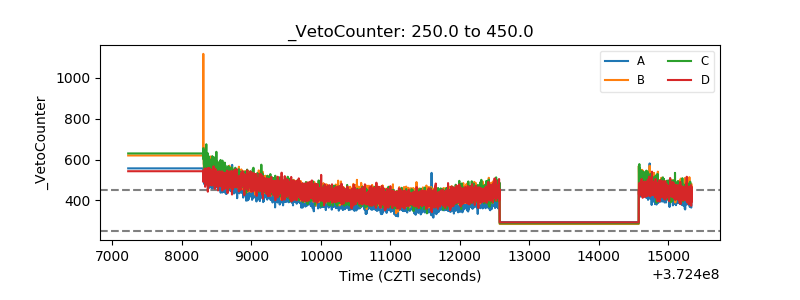 |