| Param | Original file | Final file |
|---|---|---|
| Filename | modeM0/AS1T04_064T01_9000004730_32775cztM0_level2.evt | modeM0/AS1T04_064T01_9000004730_32775cztM0_level2_quad_clean.evt |
| Size (bytes) | 1,094,650,560 | 143,605,440 |
| Size | 1.0 GB | 137.0 MB |
| Events in quadrant A | 7,386,800 | 946,417 |
| Events in quadrant B | 5,574,594 | 1,008,796 |
| Events in quadrant C | 4,402,777 | 1,011,045 |
| Events in quadrant D | 15,217,071 | 791,534 |
| Mode M9 | |||
|---|---|---|---|
| Quadrant | BADHDUFLAG | Total packets | Discarded packets |
| A | 0 | 28 | 0 |
| B | 0 | 28 | 0 |
| C | 0 | 28 | 0 |
| D | 0 | 28 | 0 |
| Mode SS | |||
|---|---|---|---|
| Quadrant | BADHDUFLAG | Total packets | Discarded packets |
| A | 0 | 170 | 0 |
| B | 0 | 170 | 0 |
| C | 0 | 170 | 0 |
| D | 0 | 170 | 0 |
| Mode M0 | |||
|---|---|---|---|
| Quadrant | BADHDUFLAG | Total packets | Discarded packets |
| A | 0 | 27304 | 3 |
| B | 0 | 21979 | 2 |
| C | 0 | 18527 | 2 |
| D | 0 | 51109 | 2 |
| Quadrant | Total seconds | Saturated seconds | Saturation percentage |
|---|---|---|---|
| A | 8505 | 890 | 10.464433% |
| B | 8505 | 215 | 2.527925% |
| C | 8505 | 90 | 1.058201% |
| D | 8505 | 2608 | 30.664315% |
Noise dominated data is calculated using 1-second bins in cleaned event files. If a bin has >2000 counts, and if more than 50% of those come from <1% of pixels, then it is considered to be noise-dominated and hence unusable.
| Quadrant | # 1 sec bins | Bins with >0 counts | Bins with >2000 counts | High rate bins dominated by noise | Noise dominated (total time) | Noise dominated (detector-on time) | Marked lightcurve |
|---|---|---|---|---|---|---|---|
| A | 13093 | 8507 | 781 | 781 | 5.97% | 9.18% | 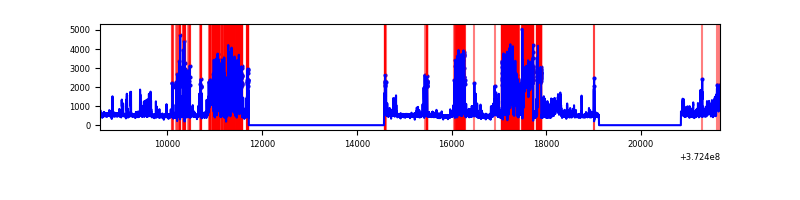 |
| B | 13093 | 8507 | 146 | 146 | 1.12% | 1.72% | 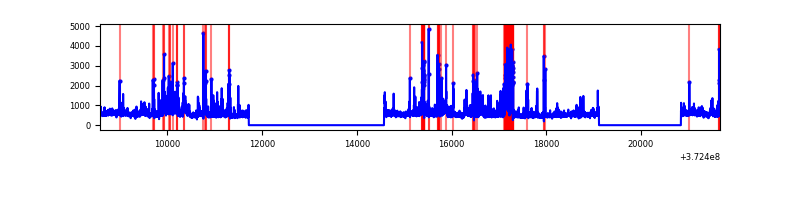 |
| C | 13093 | 8507 | 63 | 63 | 0.48% | 0.74% | 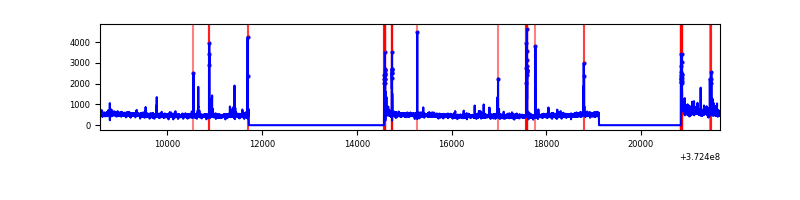 |
| D | 13093 | 8507 | 2977 | 2977 | 22.74% | 34.99% | 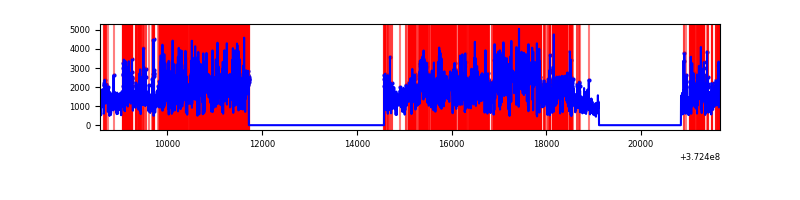 |
Top three noisy pixels from each quadrant. If the there are fewer than three noisy pixels in the level2.evt file, extra rows are filled as -1
| Pixel properties | Quadrant properties | ||||||
|---|---|---|---|---|---|---|---|
| Quadrant | DetID | PixID | Counts | Sigma | Mean | Median | Sigma |
| A | 12 | 16 | 1422747 | 7173.48 | 992 | 976 | 198.2 |
| A | 15 | 237 | 1088497 | 5487.04 | 992 | 976 | 198.2 |
| A | 14 | 63 | 742475 | 3741.2 | 992 | 976 | 198.2 |
| B | 0 | 219 | 490576 | 2563.11 | 1021 | 1000 | 191.0 |
| B | 12 | 1 | 334202 | 1744.43 | 1021 | 1000 | 191.0 |
| B | 5 | 172 | 266863 | 1391.89 | 1021 | 1000 | 191.0 |
| C | 7 | 221 | 151415 | 658.47 | 988 | 998 | 228.4 |
| C | 0 | 10 | 137229 | 596.37 | 988 | 998 | 228.4 |
| C | 0 | 207 | 62731 | 270.24 | 988 | 998 | 228.4 |
| D | 8 | 195 | 7714123 | 34193.24 | 884 | 868 | 225.6 |
| D | 7 | 80 | 2241416 | 9932.46 | 884 | 868 | 225.6 |
| D | 2 | 250 | 456586 | 2020.22 | 884 | 868 | 225.6 |
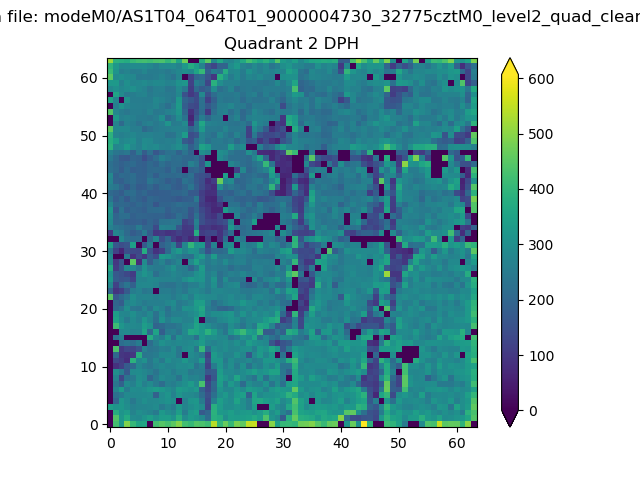
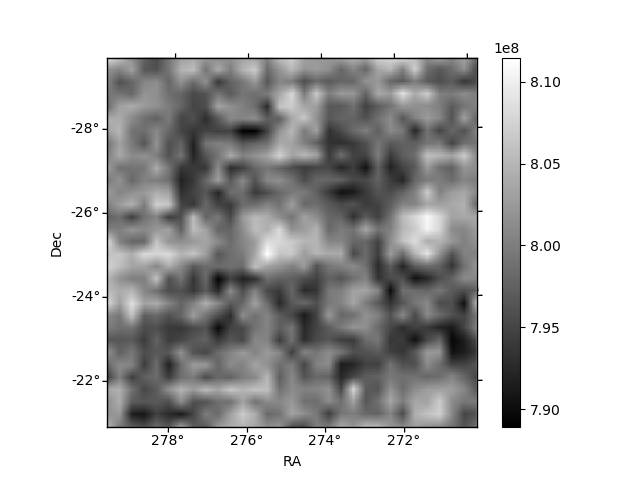
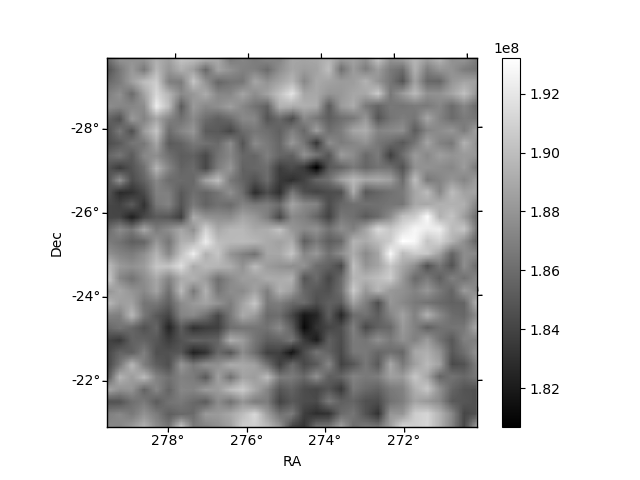
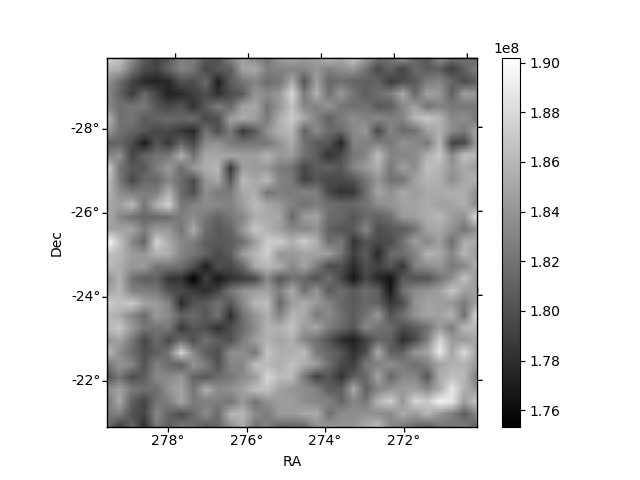
Histogram calculated using DETX and DETY for each event in the final _common_clean file
| Quadrant A | 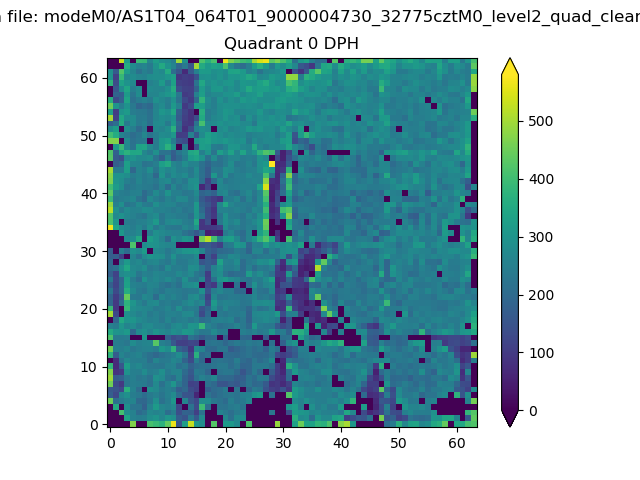 |
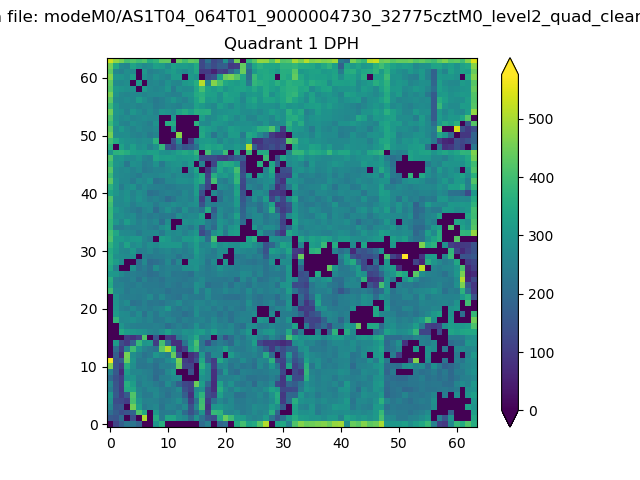 |
Quadrant B |
|---|---|---|---|
| Quadrant D | 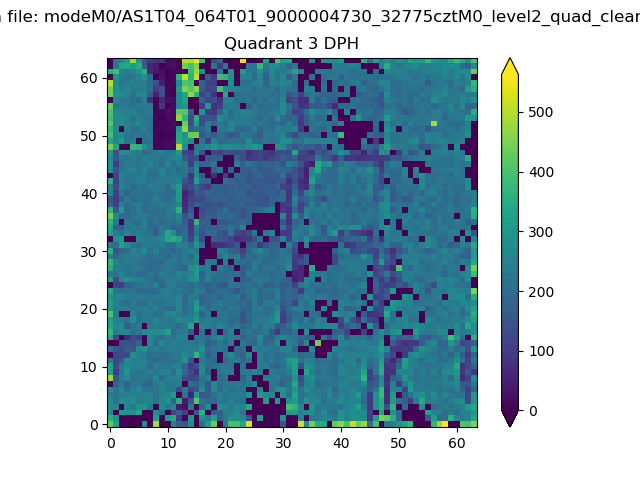 |
 |
Quadrant C |
| Plot type | Count rate plots | Images |
|---|---|---|
| Comparison with Poisson distribution Blue bars denote a histogram of data divided into 1 sec bins. Red curve is a Poisson curve with rate = median count rate of data. |
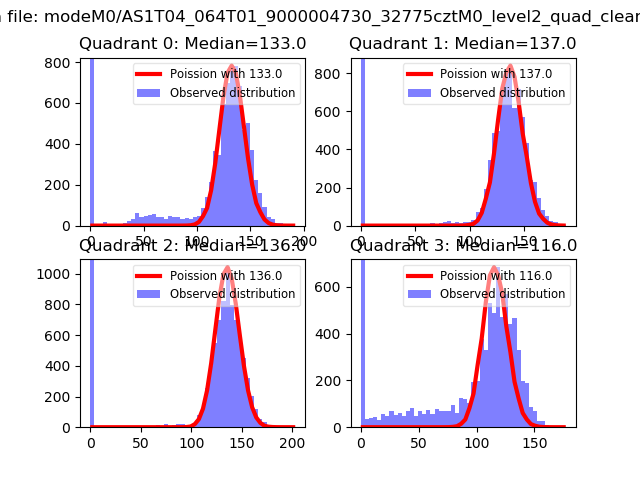 |
 |
| Quadrant-wise count rates Data is divided into 100 sec bins |
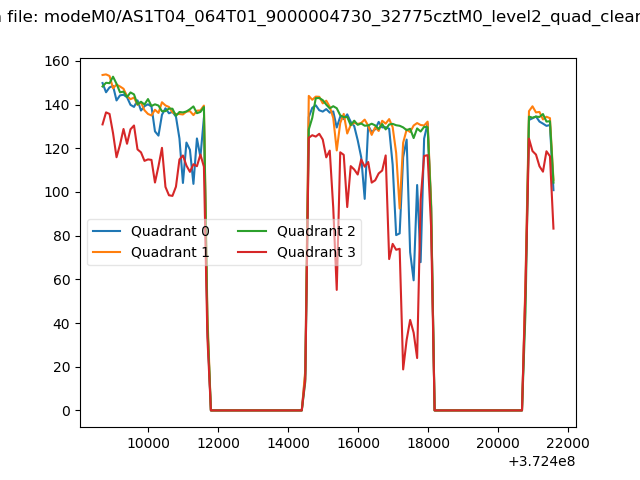 |
|
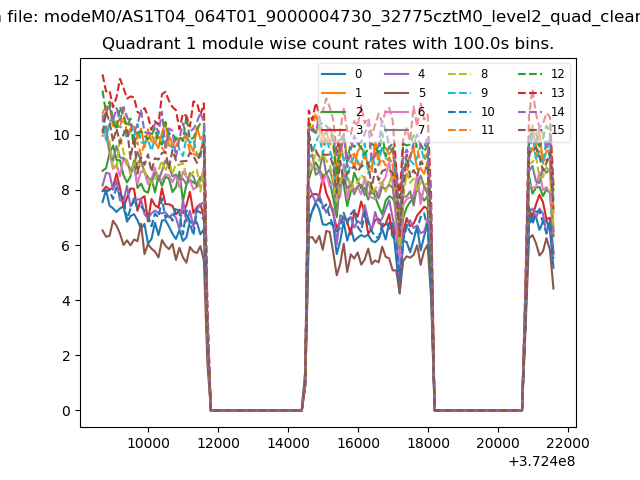
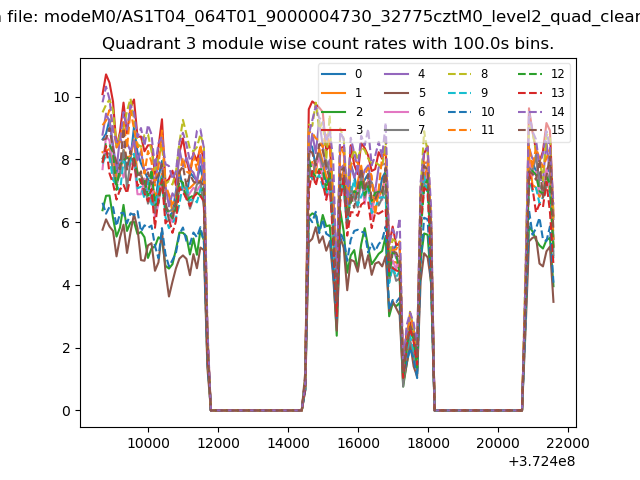
| Module-wise count rates for Quadrant A Data is divided into 100 sec bins |
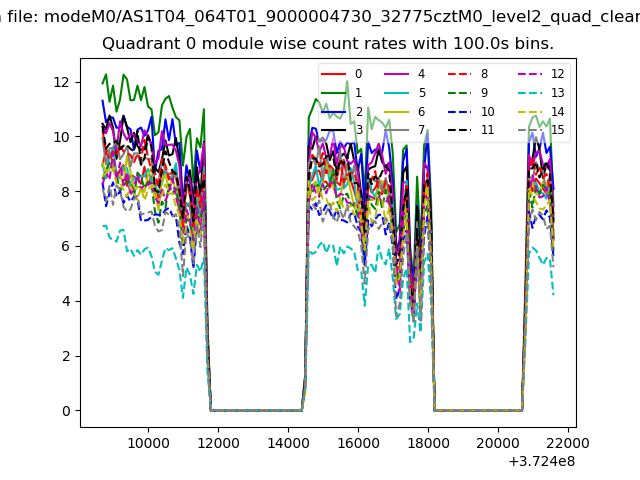 |
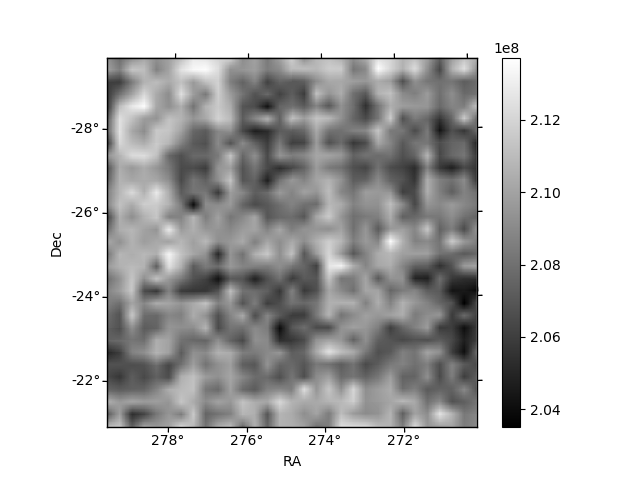 |
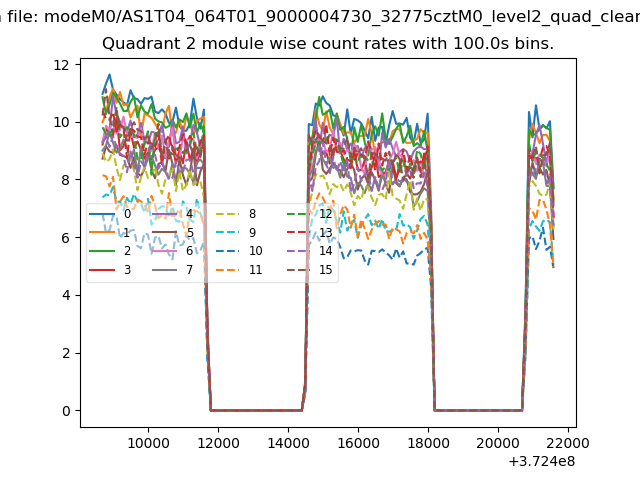
| Module-wise count rates for Quadrant B Data is divided into 100 sec bins |
 |
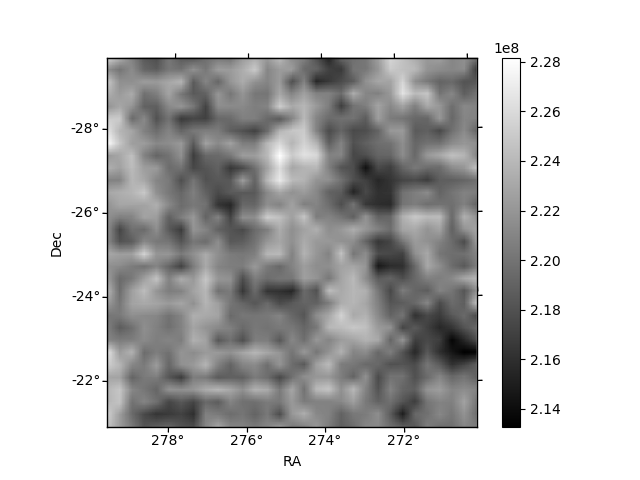 |
| Module-wise count rates for Quadrant C Data is divided into 100 sec bins |
 |
 |
| Module-wise count rates for Quadrant D Data is divided into 100 sec bins |
 |
 |
| Parameter | Plot |
|---|---|
| CZT HV Monitor | 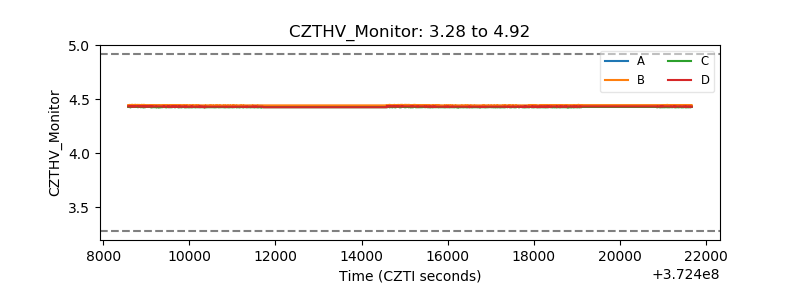 |
| D_VDD | 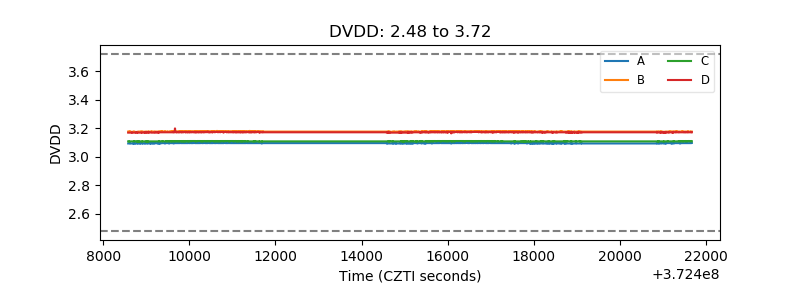 |
| Temperature 1 | 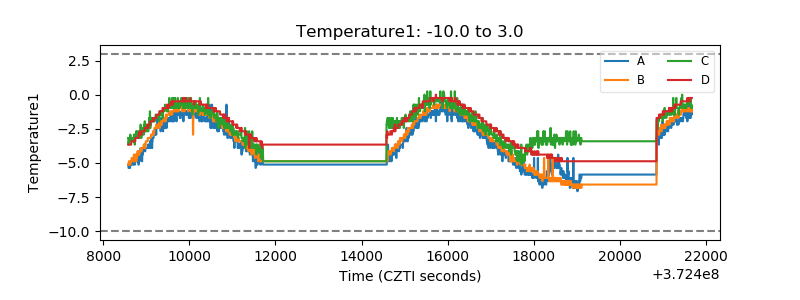 |
| Veto HV Monitor | 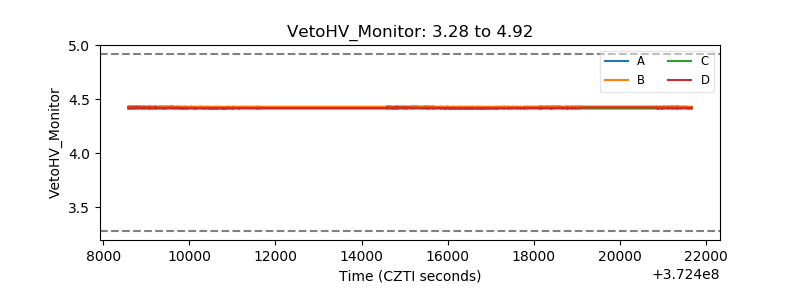 |
| Veto LLD | 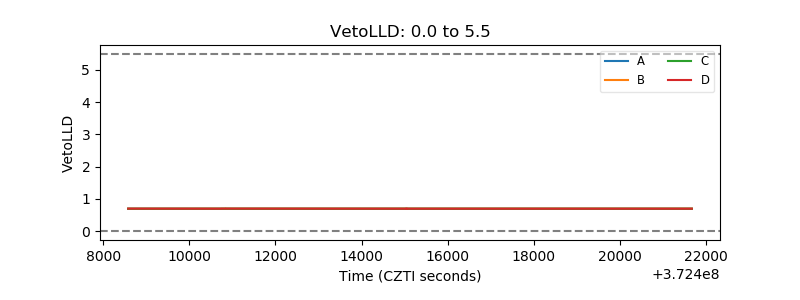 |
| Alpha Counter | 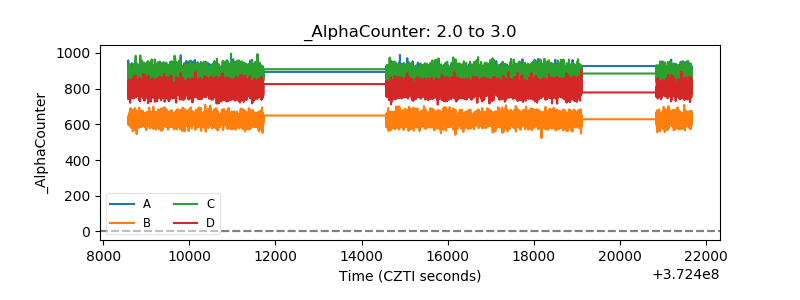 |
| _CPM_Rate | 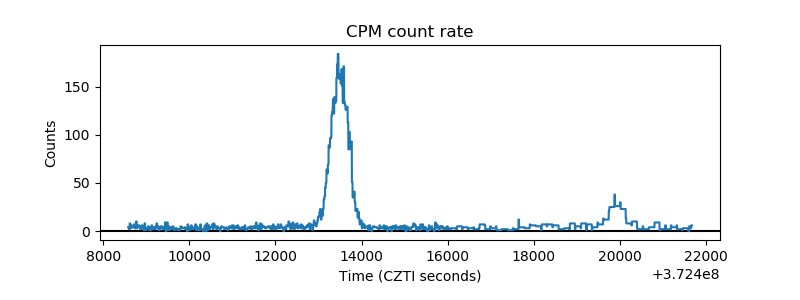 |
| CZT Counter | 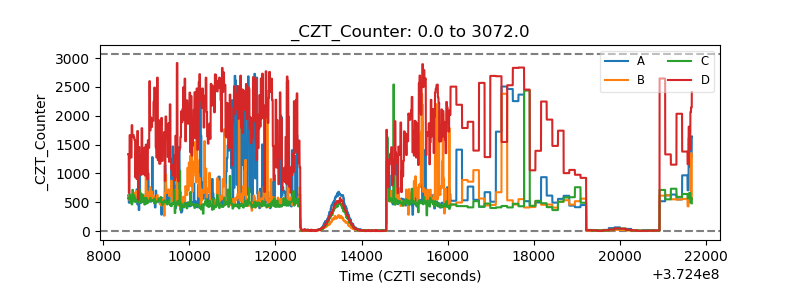 |
| +2.5 Volts monitor | 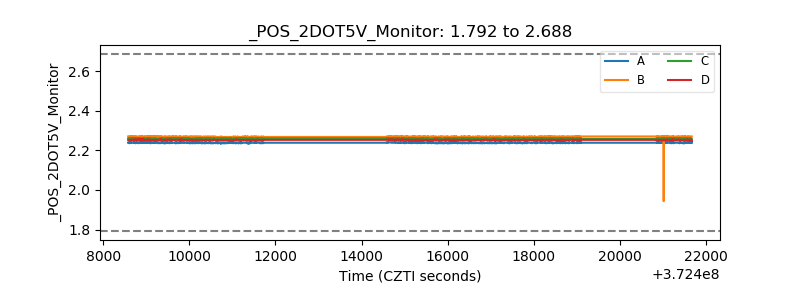 |
| +5 Volts monitor | 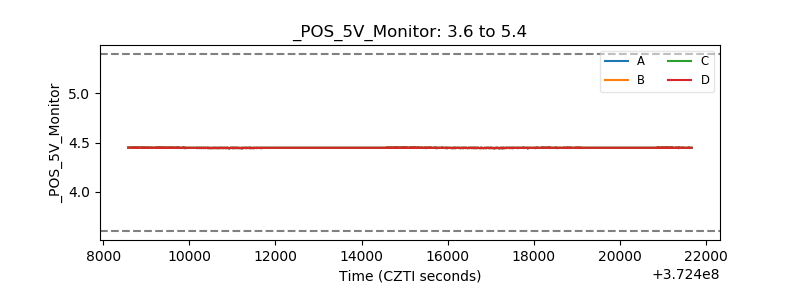 |
| _ROLL_ROT | 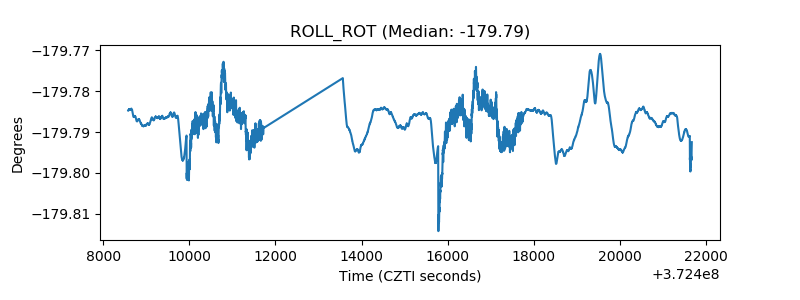 |
| _Roll_DEC |  |
| _Roll_RA | 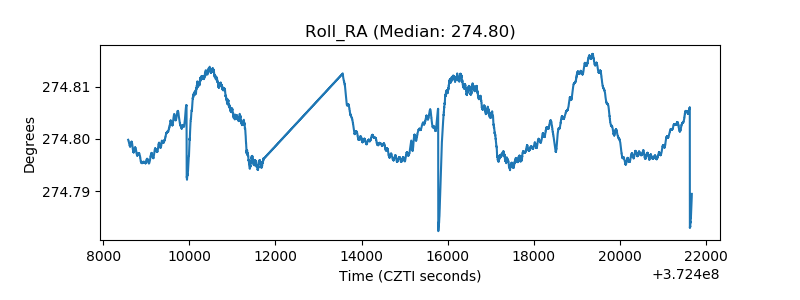 |
| Veto Counter | 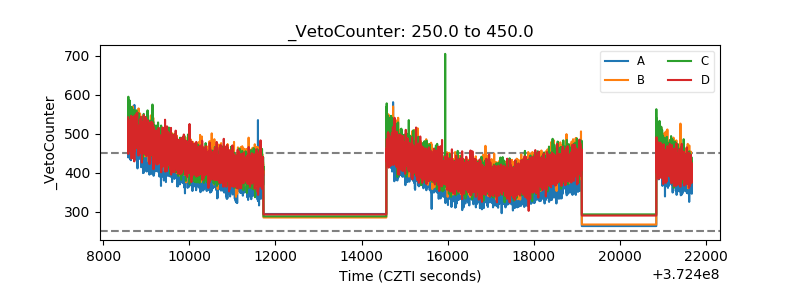 |