| Param | Original file | Final file |
|---|---|---|
| Filename | modeM0/AS1T04_064T01_9000004730_32776cztM0_level2.evt | modeM0/AS1T04_064T01_9000004730_32776cztM0_level2_quad_clean.evt |
| Size (bytes) | 832,959,360 | 78,482,880 |
| Size | 794.4 MB | 74.8 MB |
| Events in quadrant A | 5,615,202 | 479,148 |
| Events in quadrant B | 4,516,765 | 526,168 |
| Events in quadrant C | 3,776,298 | 542,252 |
| Events in quadrant D | 10,918,486 | 412,305 |
| Mode M9 | |||
|---|---|---|---|
| Quadrant | BADHDUFLAG | Total packets | Discarded packets |
| A | 0 | 18 | 0 |
| B | 0 | 18 | 0 |
| C | 0 | 18 | 0 |
| D | 0 | 19 | 0 |
| Mode SS | |||
|---|---|---|---|
| Quadrant | BADHDUFLAG | Total packets | Discarded packets |
| A | 0 | 120 | 0 |
| B | 0 | 120 | 0 |
| C | 0 | 120 | 0 |
| D | 0 | 120 | 0 |
| Mode M0 | |||
|---|---|---|---|
| Quadrant | BADHDUFLAG | Total packets | Discarded packets |
| A | 0 | 20597 | 3 |
| B | 0 | 17134 | 2 |
| C | 0 | 15134 | 2 |
| D | 0 | 36570 | 2 |
| Quadrant | Total seconds | Saturated seconds | Saturation percentage |
|---|---|---|---|
| A | 5944 | 914 | 15.376851% |
| B | 5944 | 456 | 7.671602% |
| C | 5944 | 85 | 1.430013% |
| D | 5944 | 2250 | 37.853297% |
Noise dominated data is calculated using 1-second bins in cleaned event files. If a bin has >2000 counts, and if more than 50% of those come from <1% of pixels, then it is considered to be noise-dominated and hence unusable.
| Quadrant | # 1 sec bins | Bins with >0 counts | Bins with >2000 counts | High rate bins dominated by noise | Noise dominated (total time) | Noise dominated (detector-on time) | Marked lightcurve |
|---|---|---|---|---|---|---|---|
| A | 7377 | 5945 | 621 | 621 | 8.42% | 10.45% | 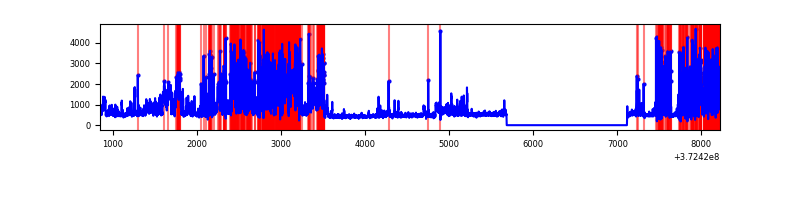 |
| B | 7377 | 5945 | 332 | 332 | 4.50% | 5.58% | 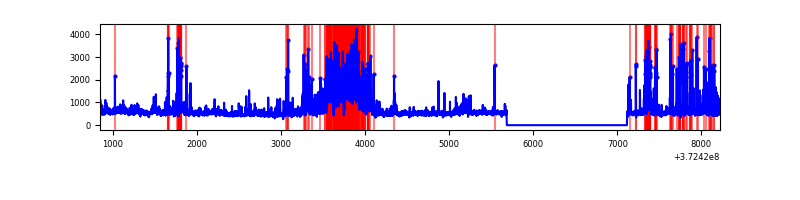 |
| C | 7377 | 5945 | 67 | 67 | 0.91% | 1.13% | 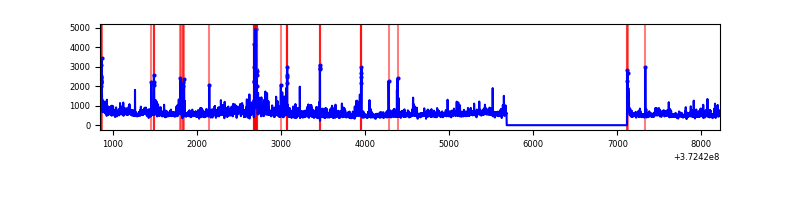 |
| D | 7377 | 5945 | 2427 | 2427 | 32.90% | 40.82% | 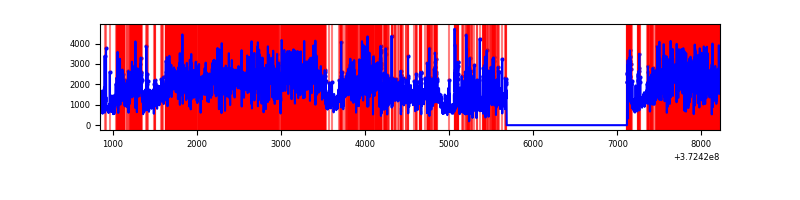 |
Top three noisy pixels from each quadrant. If the there are fewer than three noisy pixels in the level2.evt file, extra rows are filled as -1
| Pixel properties | Quadrant properties | ||||||
|---|---|---|---|---|---|---|---|
| Quadrant | DetID | PixID | Counts | Sigma | Mean | Median | Sigma |
| A | 15 | 237 | 1874959 | 14125.78 | 653 | 640 | 132.7 |
| A | 12 | 16 | 697080 | 5248.71 | 653 | 640 | 132.7 |
| A | 14 | 63 | 378822 | 2850.16 | 653 | 640 | 132.7 |
| B | 12 | 1 | 1068301 | 8178.18 | 685 | 669 | 130.5 |
| B | 5 | 172 | 409240 | 3129.7 | 685 | 669 | 130.5 |
| B | 0 | 219 | 104874 | 798.22 | 685 | 669 | 130.5 |
| C | 7 | 221 | 759992 | 4834.04 | 674 | 681 | 157.1 |
| C | 0 | 10 | 243877 | 1548.27 | 674 | 681 | 157.1 |
| C | 8 | 79 | 46858 | 293.98 | 674 | 681 | 157.1 |
| D | 8 | 195 | 4898578 | 32585.17 | 588 | 577 | 150.3 |
| D | 2 | 250 | 1651357 | 10982.22 | 588 | 577 | 150.3 |
| D | 7 | 80 | 1053246 | 7003.14 | 588 | 577 | 150.3 |
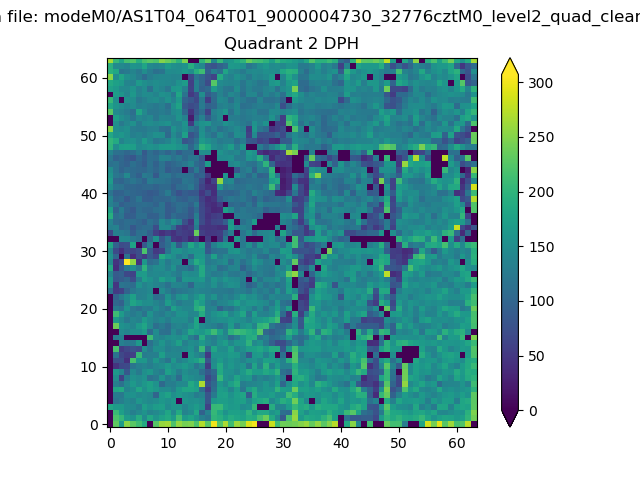
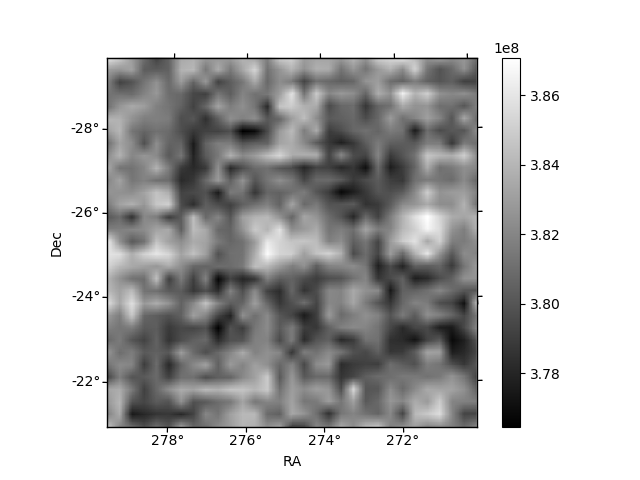
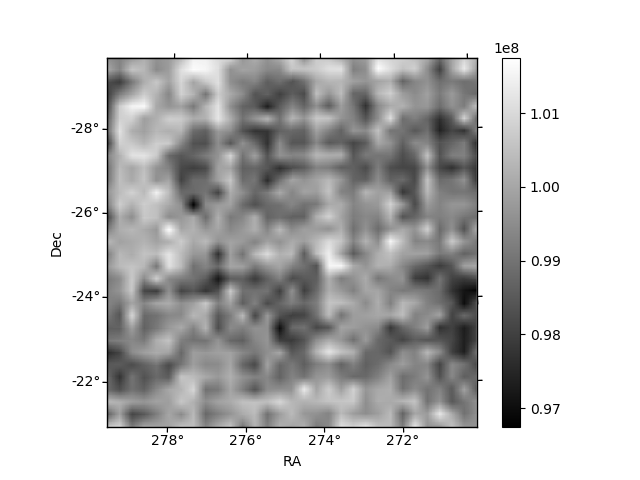
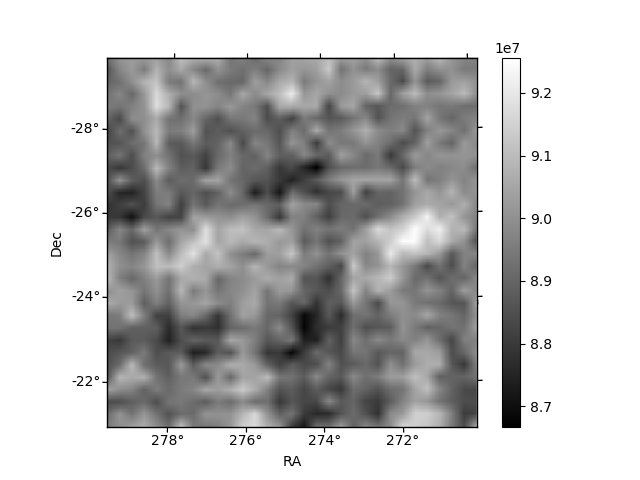
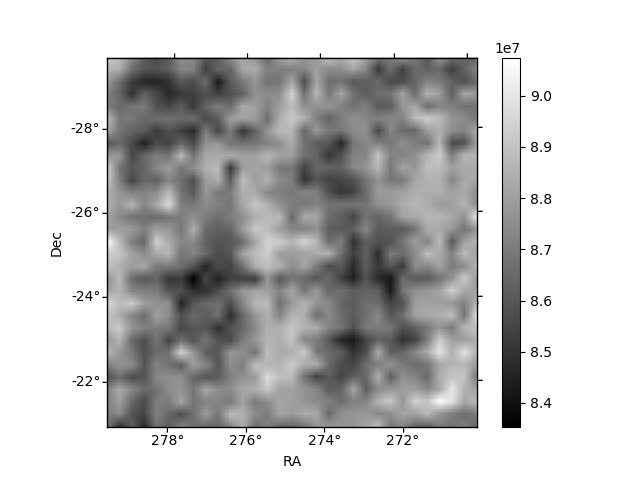
Histogram calculated using DETX and DETY for each event in the final _common_clean file
| Quadrant A | 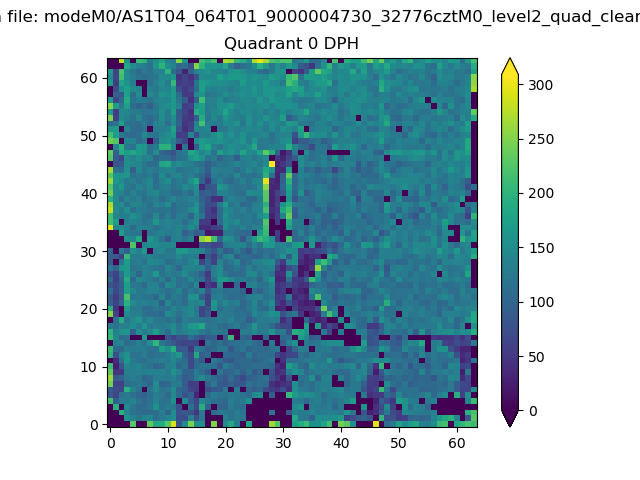 |
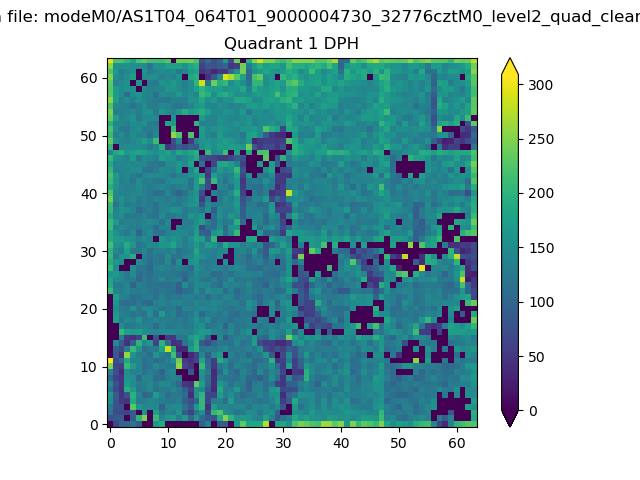 |
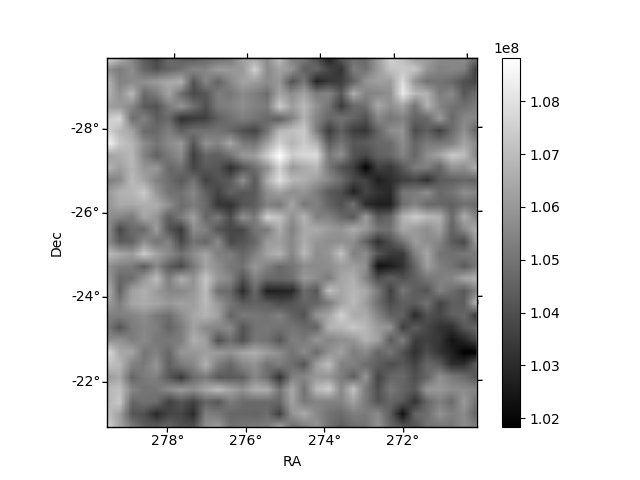
Quadrant B |
|---|---|---|---|
| Quadrant D | 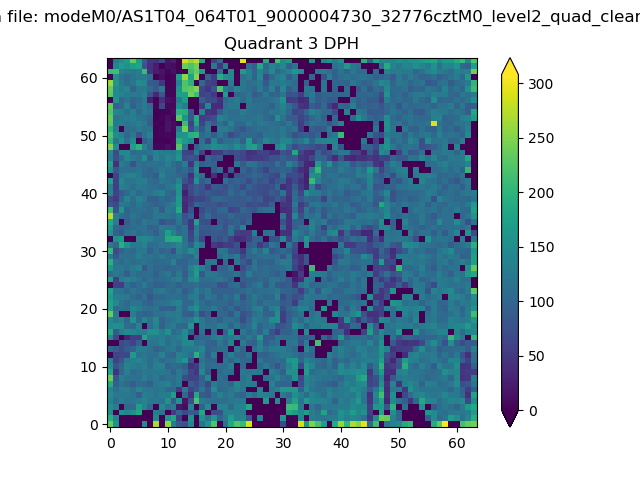 |
 |
Quadrant C |
| Plot type | Count rate plots | Images |
|---|---|---|
| Comparison with Poisson distribution Blue bars denote a histogram of data divided into 1 sec bins. Red curve is a Poisson curve with rate = median count rate of data. |
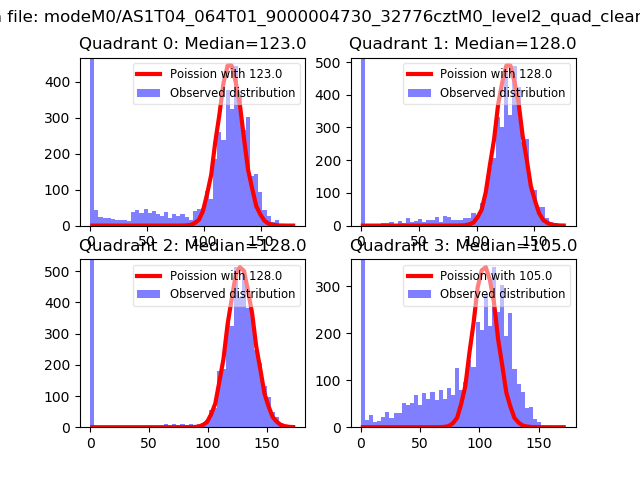 |
 |
| Quadrant-wise count rates Data is divided into 100 sec bins |
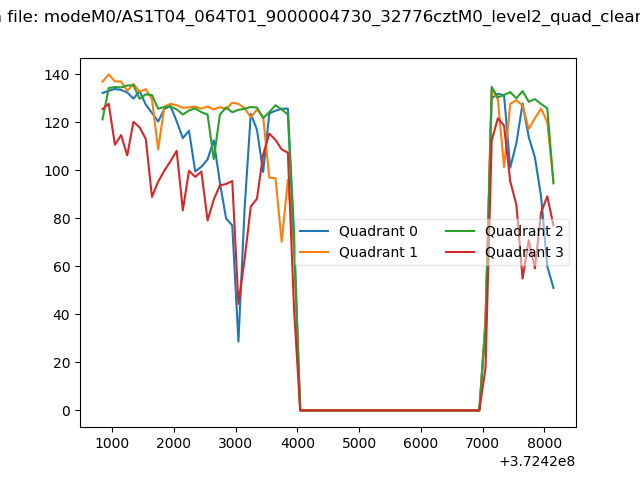 |
|
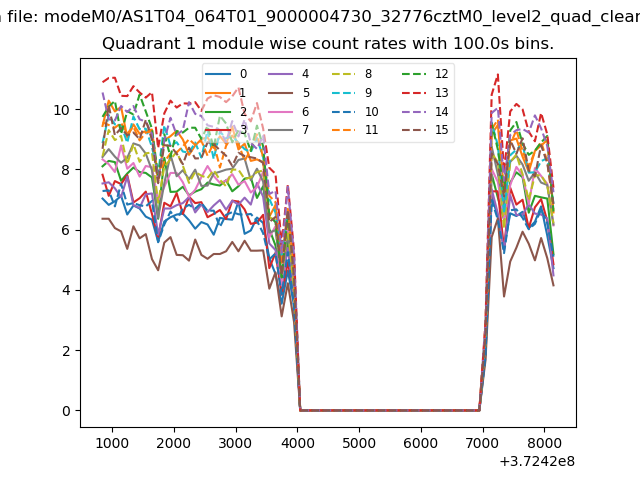
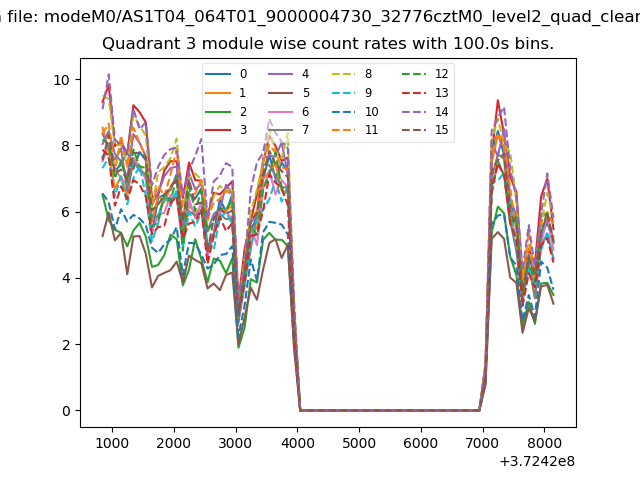
| Module-wise count rates for Quadrant A Data is divided into 100 sec bins |
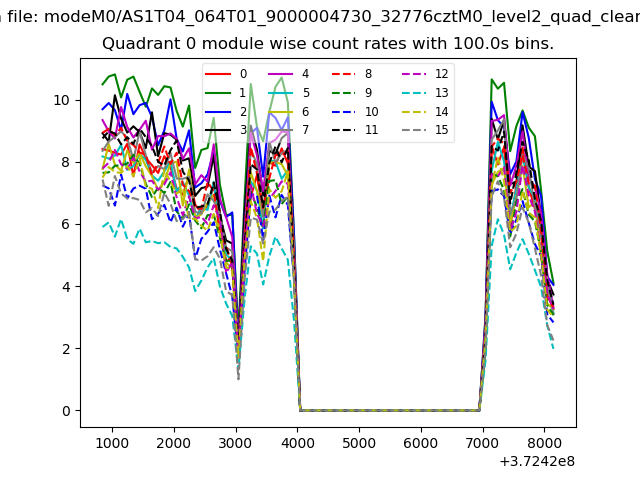 |
 |
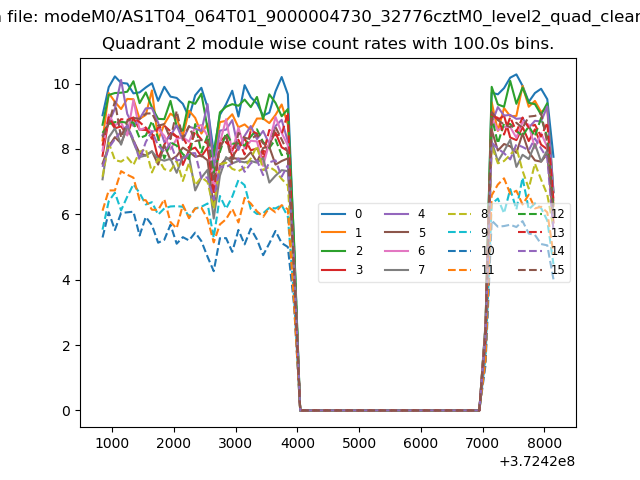
| Module-wise count rates for Quadrant B Data is divided into 100 sec bins |
 |
 |
| Module-wise count rates for Quadrant C Data is divided into 100 sec bins |
 |
 |
| Module-wise count rates for Quadrant D Data is divided into 100 sec bins |
 |
 |
| Parameter | Plot |
|---|---|
| CZT HV Monitor | 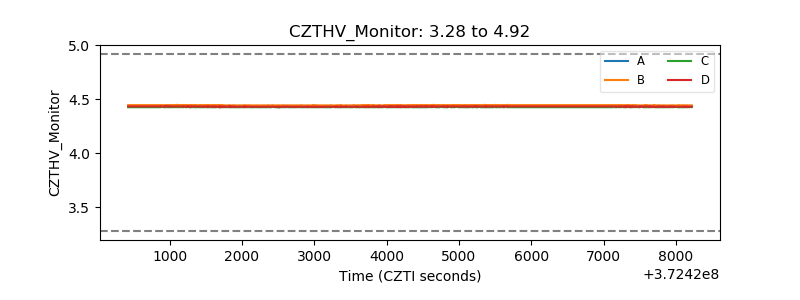 |
| D_VDD | 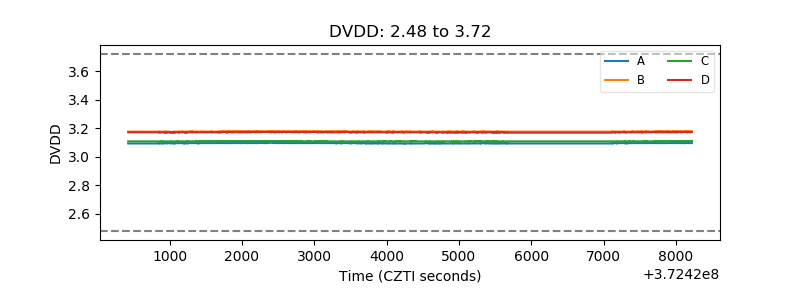 |
| Temperature 1 | 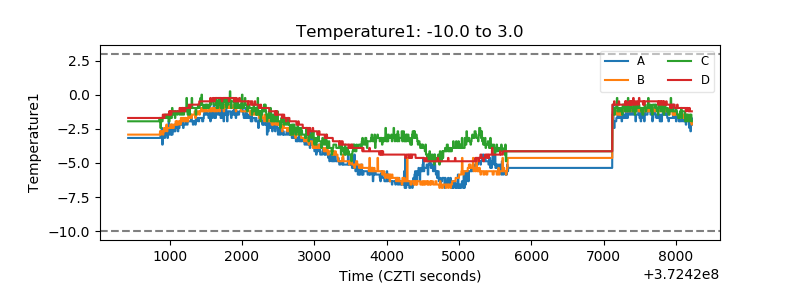 |
| Veto HV Monitor | 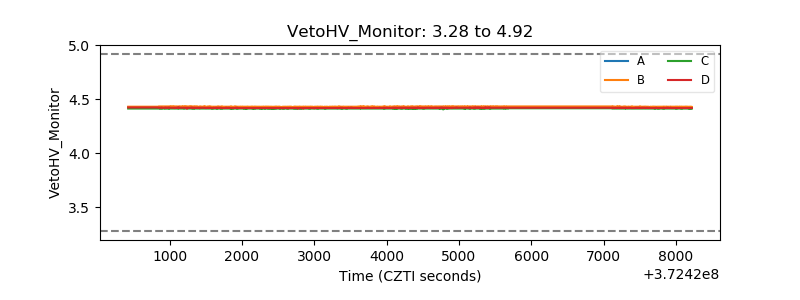 |
| Veto LLD | 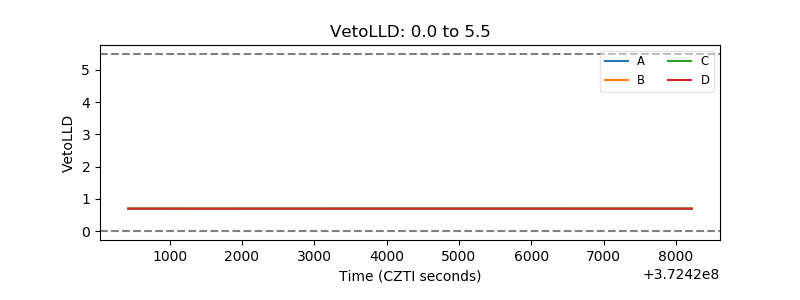 |
| Alpha Counter | 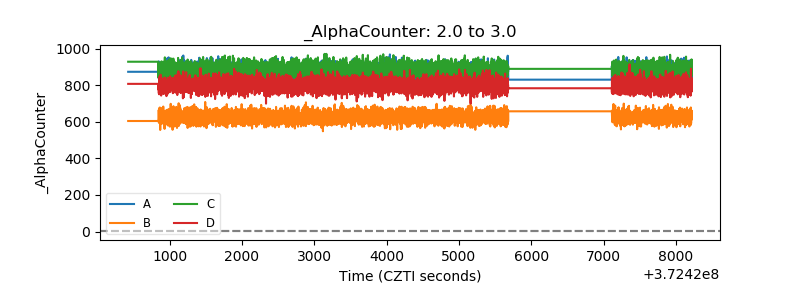 |
| _CPM_Rate | 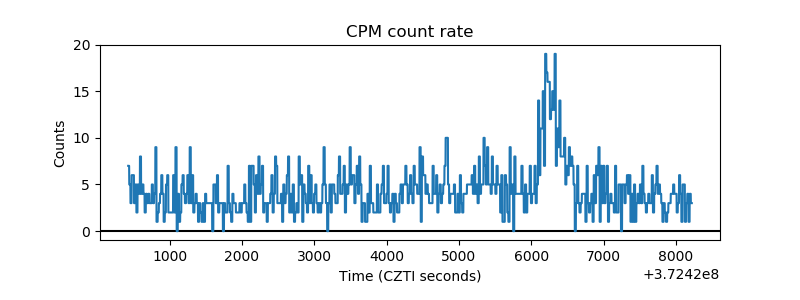 |
| CZT Counter | 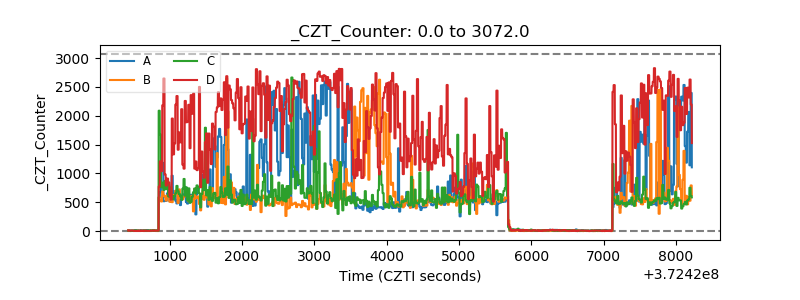 |
| +2.5 Volts monitor | 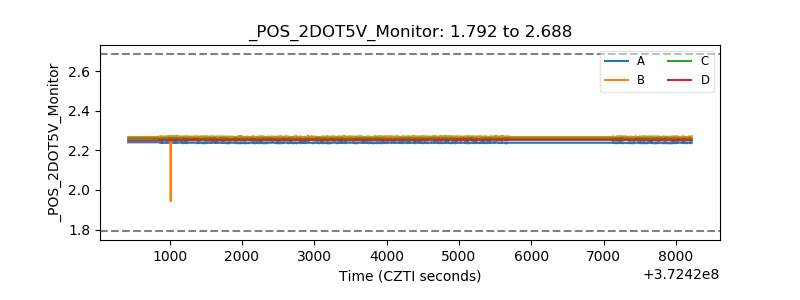 |
| +5 Volts monitor | 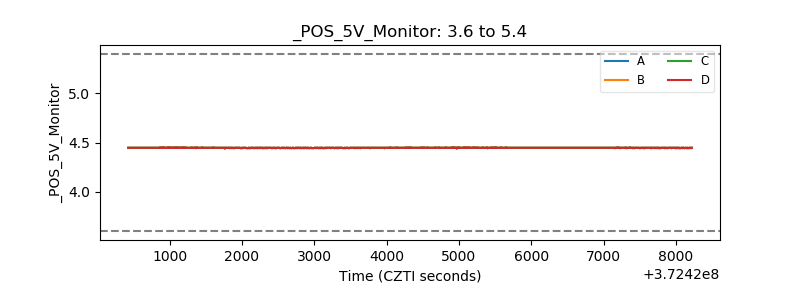 |
| _ROLL_ROT | 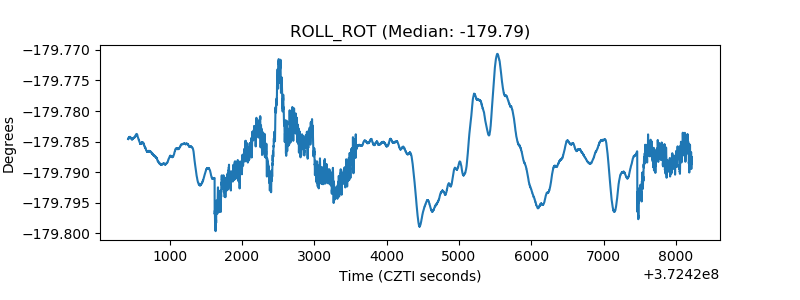 |
| _Roll_DEC | 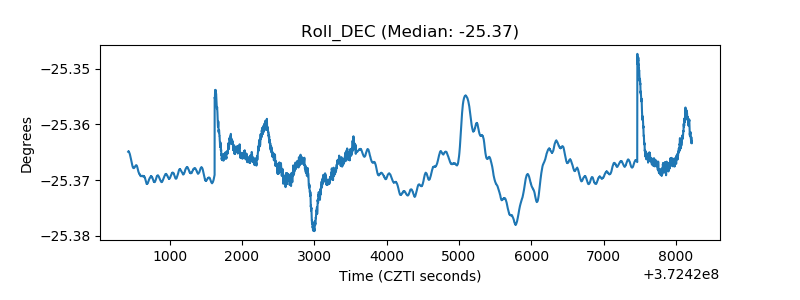 |
| _Roll_RA | 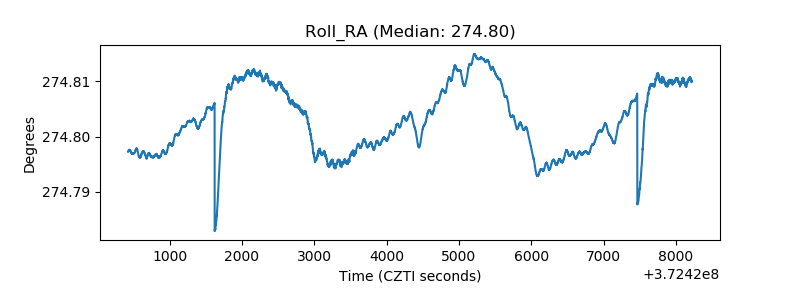 |
| Veto Counter | 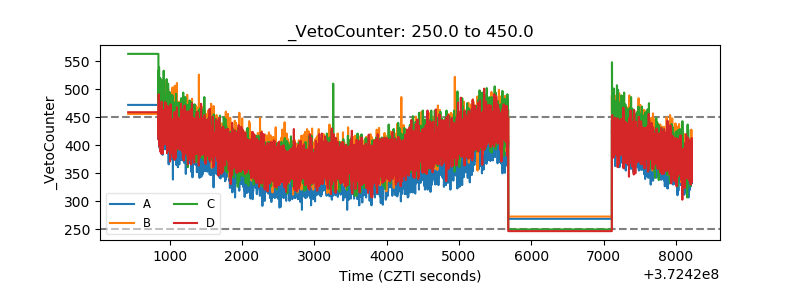 |