| Param | Original file | Final file |
|---|---|---|
| Filename | modeM0/AS1T04_064T01_9000004730_32780cztM0_level2.evt | modeM0/AS1T04_064T01_9000004730_32780cztM0_level2_quad_clean.evt |
| Size (bytes) | 1,782,956,160 | 165,130,560 |
| Size | 1.7 GB | 157.5 MB |
| Events in quadrant A | 10,891,280 | 976,056 |
| Events in quadrant B | 9,443,051 | 1,081,443 |
| Events in quadrant C | 9,452,042 | 1,047,350 |
| Events in quadrant D | 23,194,927 | 849,136 |
| Mode M9 | |||
|---|---|---|---|
| Quadrant | BADHDUFLAG | Total packets | Discarded packets |
| A | 0 | 42 | 0 |
| B | 0 | 42 | 0 |
| C | 0 | 42 | 0 |
| D | 0 | 42 | 0 |
| Mode SS | |||
|---|---|---|---|
| Quadrant | BADHDUFLAG | Total packets | Discarded packets |
| A | 0 | 308 | 0 |
| B | 0 | 308 | 0 |
| C | 0 | 308 | 0 |
| D | 0 | 308 | 0 |
| Mode M0 | |||
|---|---|---|---|
| Quadrant | BADHDUFLAG | Total packets | Discarded packets |
| A | 0 | 42381 | 3 |
| B | 0 | 37915 | 2 |
| C | 0 | 38039 | 2 |
| D | 0 | 79531 | 2 |
| Quadrant | Total seconds | Saturated seconds | Saturation percentage |
|---|---|---|---|
| A | 15143 | 1408 | 9.298025% |
| B | 15143 | 269 | 1.776398% |
| C | 15143 | 496 | 3.275441% |
| D | 15143 | 3883 | 25.642211% |
Noise dominated data is calculated using 1-second bins in cleaned event files. If a bin has >2000 counts, and if more than 50% of those come from <1% of pixels, then it is considered to be noise-dominated and hence unusable.
| Quadrant | # 1 sec bins | Bins with >0 counts | Bins with >2000 counts | High rate bins dominated by noise | Noise dominated (total time) | Noise dominated (detector-on time) | Marked lightcurve |
|---|---|---|---|---|---|---|---|
| A | 19324 | 15145 | 943 | 943 | 4.88% | 6.23% | 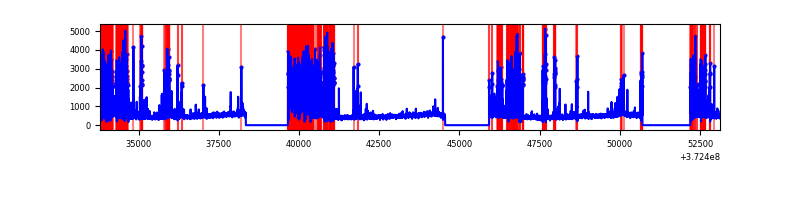 |
| B | 19324 | 15146 | 190 | 190 | 0.98% | 1.25% | 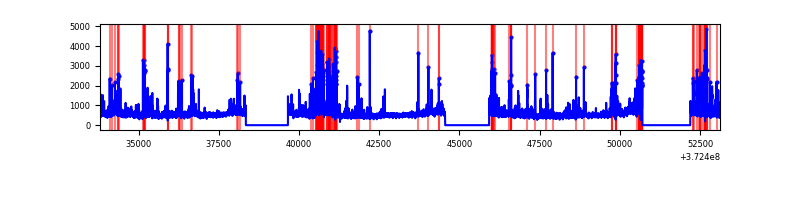 |
| C | 19323 | 15145 | 383 | 383 | 1.98% | 2.53% | 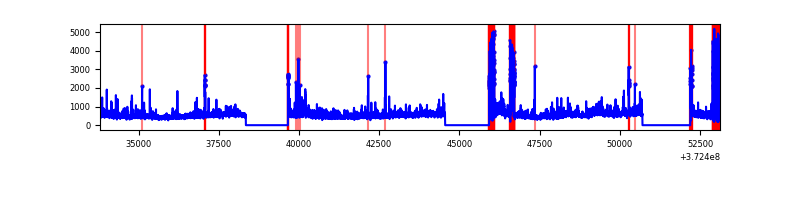 |
| D | 19324 | 15146 | 3842 | 3842 | 19.88% | 25.37% | 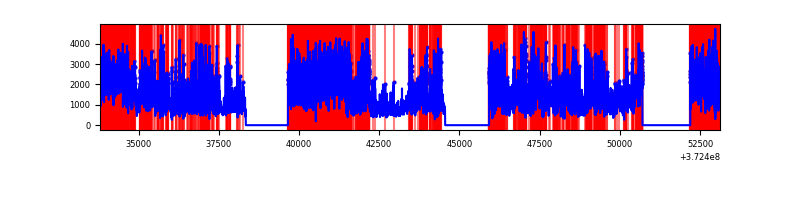 |
Top three noisy pixels from each quadrant. If the there are fewer than three noisy pixels in the level2.evt file, extra rows are filled as -1
| Pixel properties | Quadrant properties | ||||||
|---|---|---|---|---|---|---|---|
| Quadrant | DetID | PixID | Counts | Sigma | Mean | Median | Sigma |
| A | 15 | 237 | 3776445 | 11141.86 | 1690 | 1657 | 338.8 |
| A | 12 | 16 | 304117 | 892.76 | 1690 | 1657 | 338.8 |
| A | 7 | 16 | 110413 | 321.01 | 1690 | 1657 | 338.8 |
| B | 5 | 172 | 819652 | 2395.57 | 1790 | 1752 | 341.4 |
| B | 0 | 219 | 731531 | 2137.47 | 1790 | 1752 | 341.4 |
| B | 0 | 189 | 181810 | 527.38 | 1790 | 1752 | 341.4 |
| C | 0 | 10 | 1295029 | 3284.88 | 1700 | 1717 | 393.7 |
| C | 7 | 221 | 613079 | 1552.8 | 1700 | 1717 | 393.7 |
| C | 4 | 254 | 469775 | 1188.82 | 1700 | 1717 | 393.7 |
| D | 8 | 195 | 8023785 | 19965.13 | 1557 | 1527 | 401.8 |
| D | 12 | 227 | 3195186 | 7948.11 | 1557 | 1527 | 401.8 |
| D | 2 | 250 | 2488264 | 6188.78 | 1557 | 1527 | 401.8 |
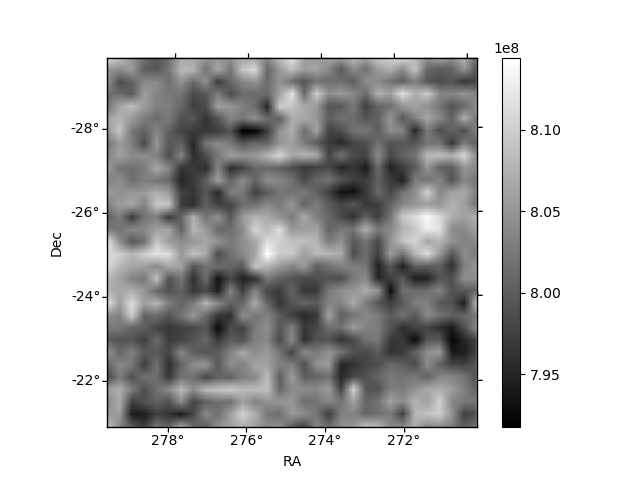
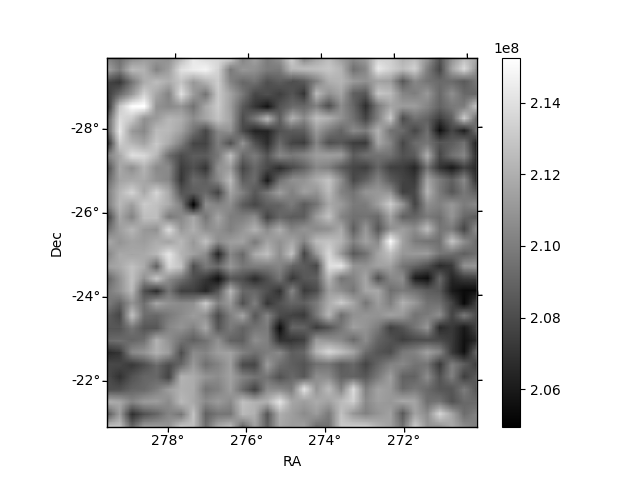
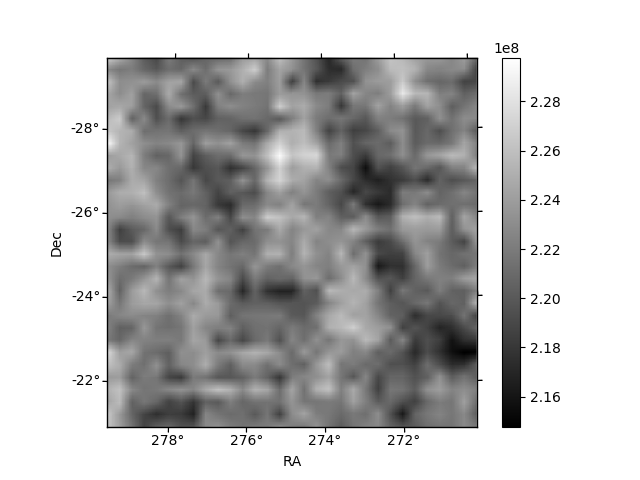
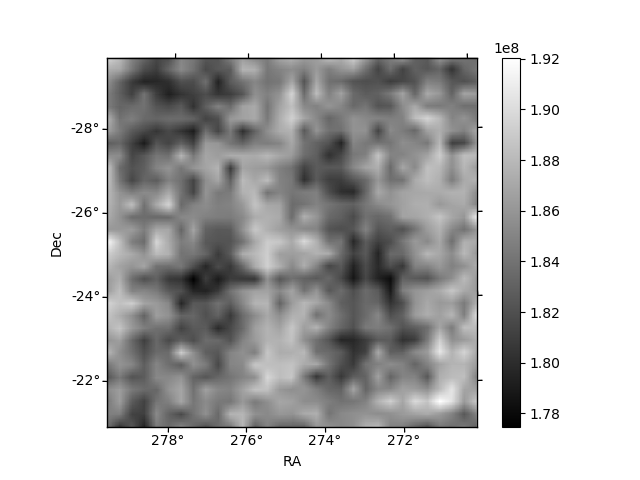
Histogram calculated using DETX and DETY for each event in the final _common_clean file
| Quadrant A | 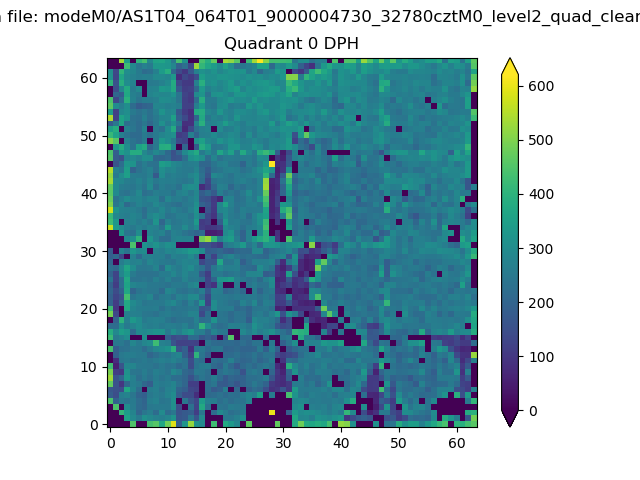 |
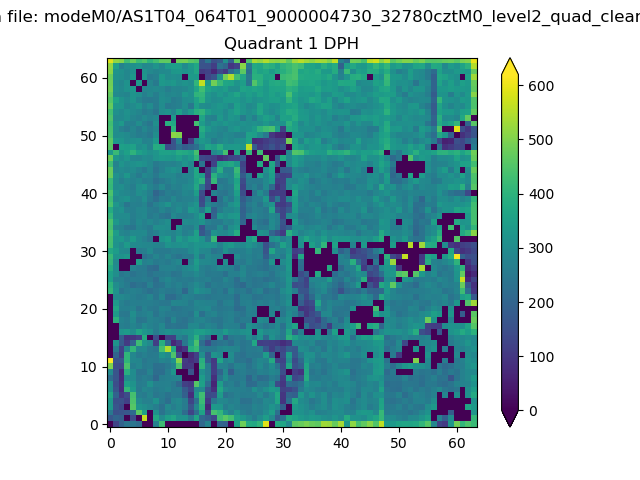 |
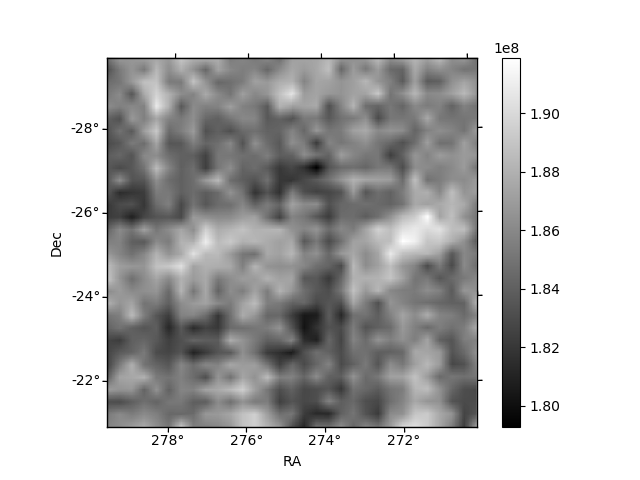
Quadrant B |
|---|---|---|---|
| Quadrant D |  |
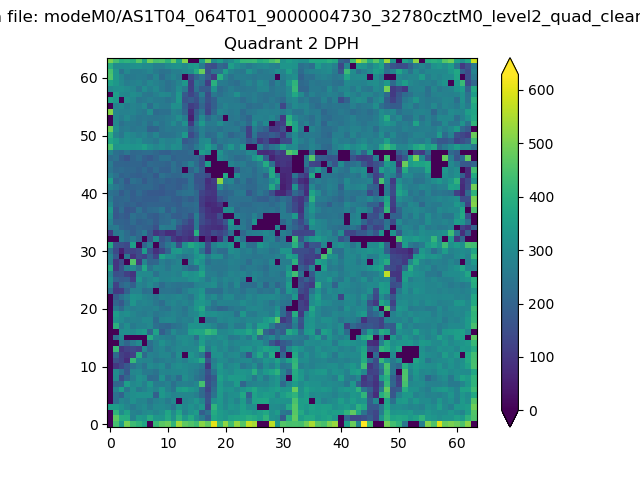 |
Quadrant C |
| Plot type | Count rate plots | Images |
|---|---|---|
| Comparison with Poisson distribution Blue bars denote a histogram of data divided into 1 sec bins. Red curve is a Poisson curve with rate = median count rate of data. |
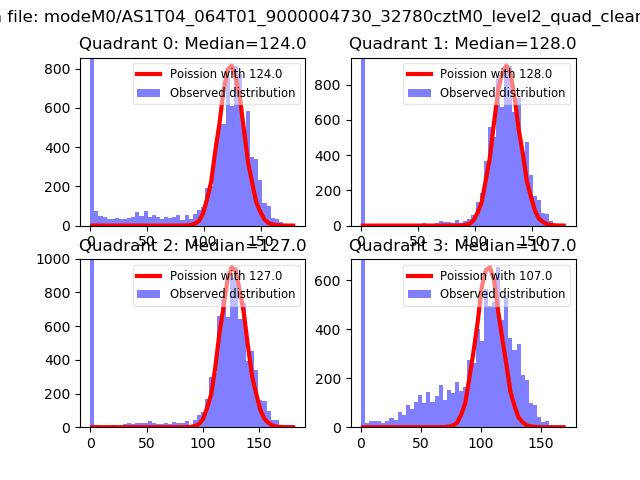 |
 |
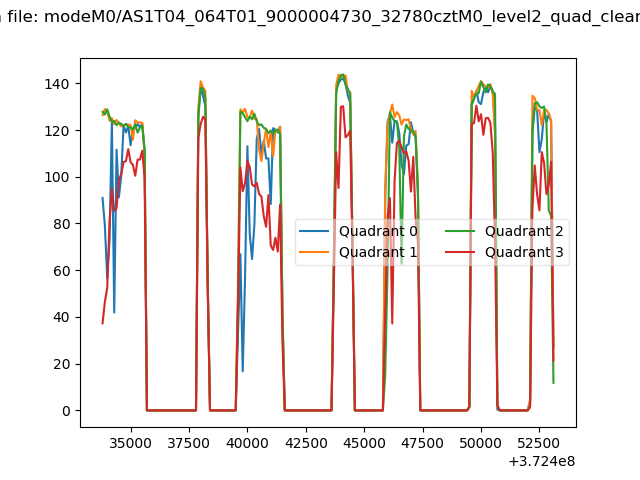
| Quadrant-wise count rates Data is divided into 100 sec bins |
 |
|
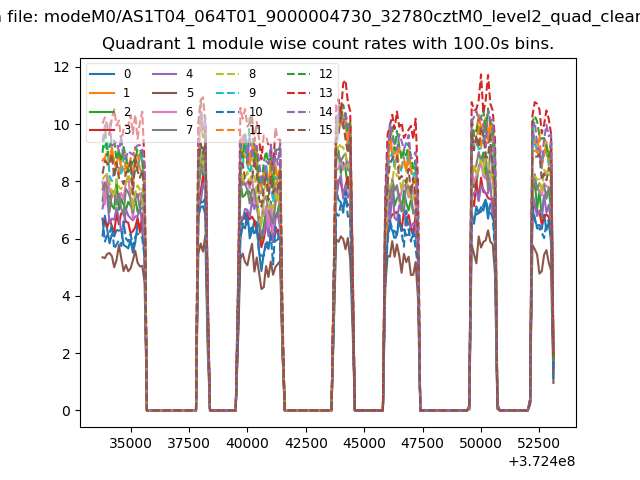
| Module-wise count rates for Quadrant A Data is divided into 100 sec bins |
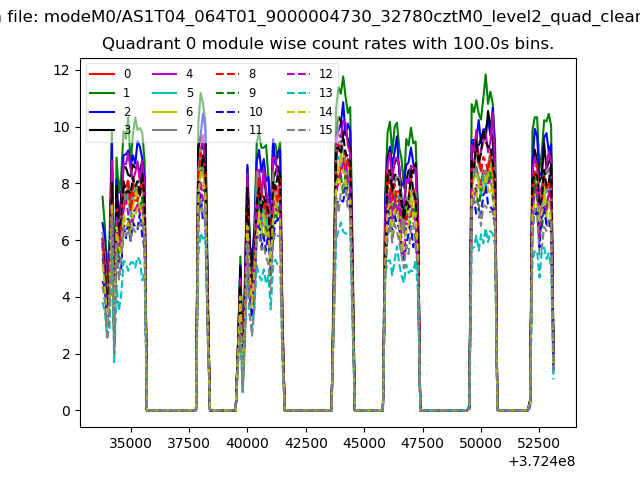 |
 |
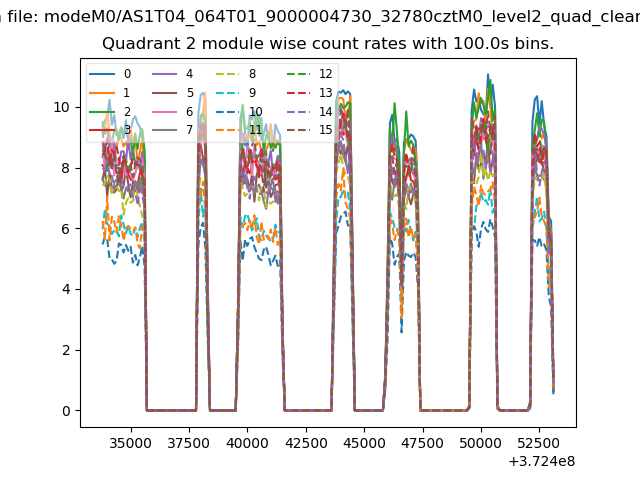
| Module-wise count rates for Quadrant B Data is divided into 100 sec bins |
 |
 |
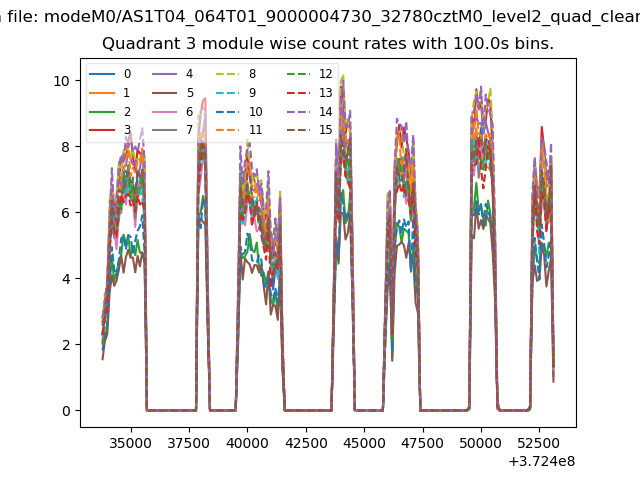
| Module-wise count rates for Quadrant C Data is divided into 100 sec bins |
 |
 |
| Module-wise count rates for Quadrant D Data is divided into 100 sec bins |
 |
 |
| Parameter | Plot |
|---|---|
| CZT HV Monitor | 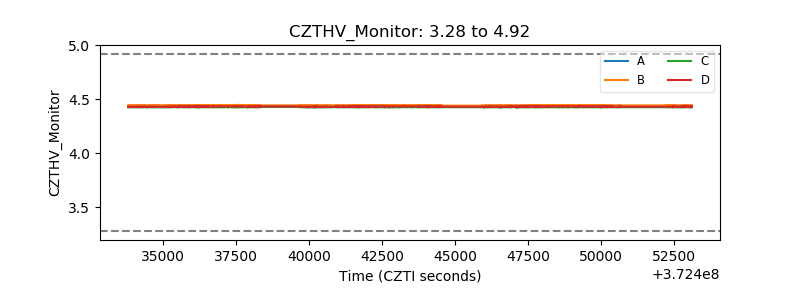 |
| D_VDD | 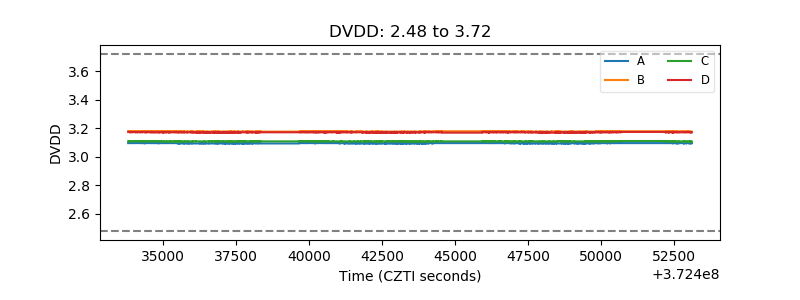 |
| Temperature 1 | 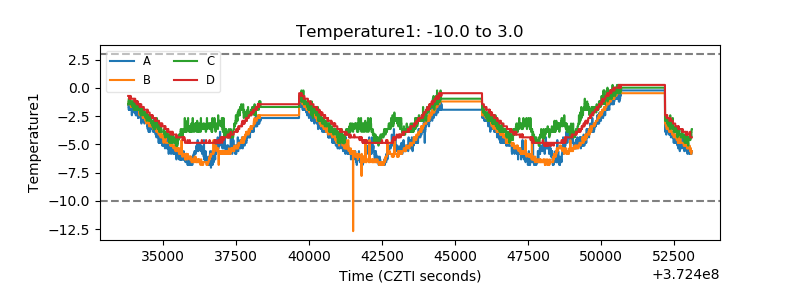 |
| Veto HV Monitor | 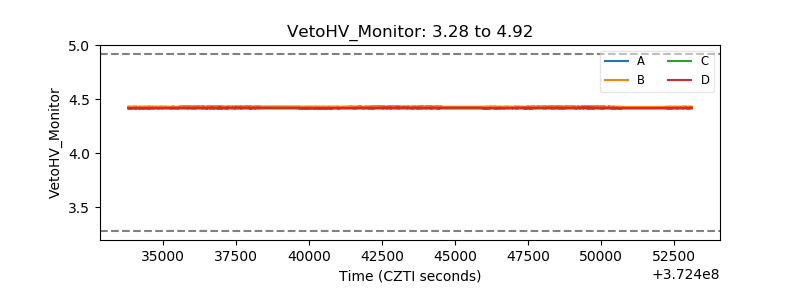 |
| Veto LLD | 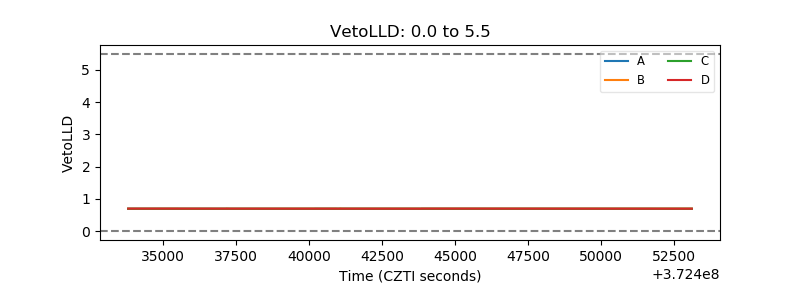 |
| Alpha Counter | 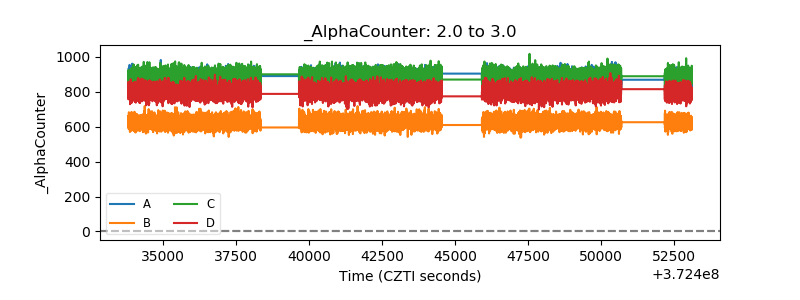 |
| _CPM_Rate | 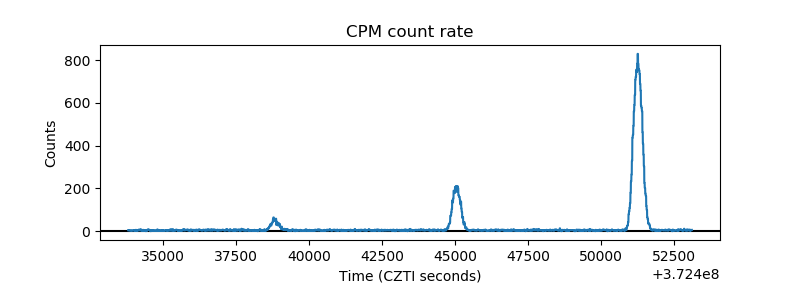 |
| CZT Counter | 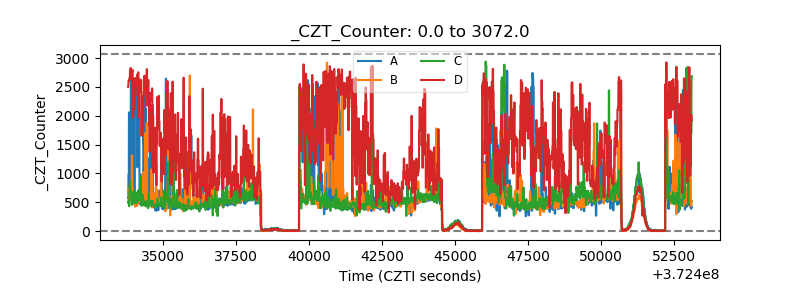 |
| +2.5 Volts monitor |  |
| +5 Volts monitor |  |
| _ROLL_ROT | 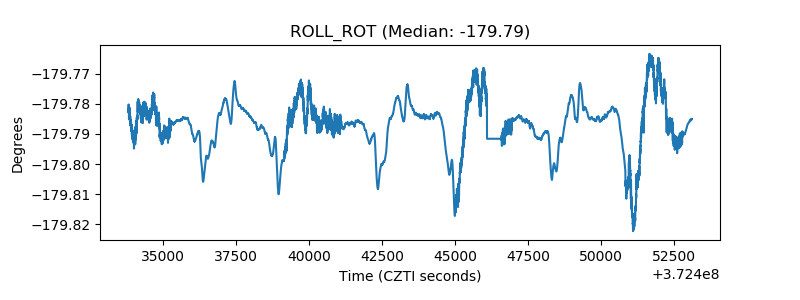 |
| _Roll_DEC | 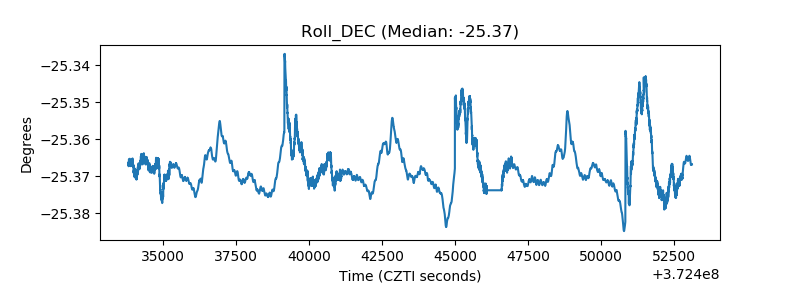 |
| _Roll_RA | 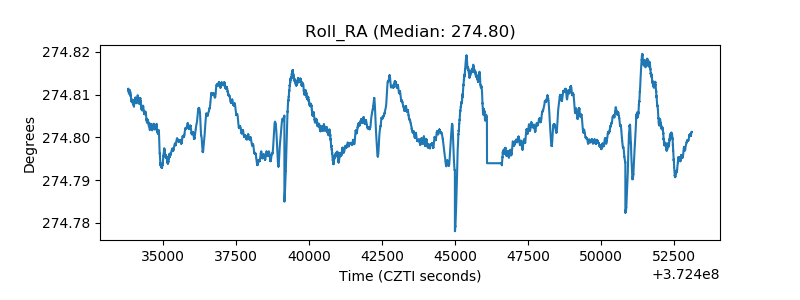 |
| Veto Counter | 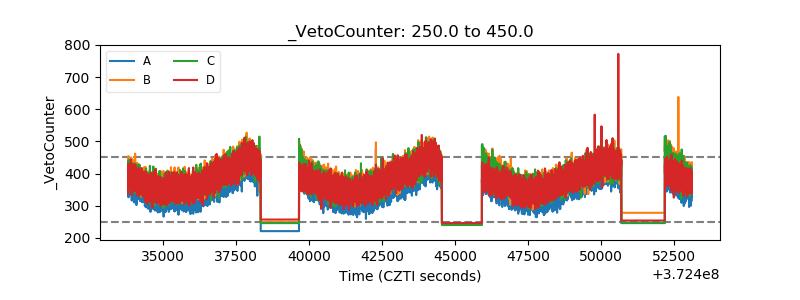 |