| Param | Original file | Final file |
|---|---|---|
| Filename | modeM0/AS1T04_064T01_9000004730_32781cztM0_level2.evt | modeM0/AS1T04_064T01_9000004730_32781cztM0_level2_quad_clean.evt |
| Size (bytes) | 1,029,237,120 | 88,810,560 |
| Size | 981.6 MB | 84.7 MB |
| Events in quadrant A | 5,205,190 | 559,639 |
| Events in quadrant B | 5,438,948 | 573,817 |
| Events in quadrant C | 7,972,419 | 515,079 |
| Events in quadrant D | 12,010,577 | 477,524 |
| Mode M9 | |||
|---|---|---|---|
| Quadrant | BADHDUFLAG | Total packets | Discarded packets |
| A | 0 | 33 | 0 |
| B | 0 | 33 | 0 |
| C | 0 | 33 | 0 |
| D | 0 | 34 | 0 |
| Mode SS | |||
|---|---|---|---|
| Quadrant | BADHDUFLAG | Total packets | Discarded packets |
| A | 0 | 164 | 0 |
| B | 0 | 164 | 0 |
| C | 0 | 164 | 0 |
| D | 0 | 164 | 0 |
| Mode M0 | |||
|---|---|---|---|
| Quadrant | BADHDUFLAG | Total packets | Discarded packets |
| A | 0 | 20869 | 5 |
| B | 0 | 21499 | 2 |
| C | 0 | 28921 | 2 |
| D | 0 | 41319 | 2 |
| Quadrant | Total seconds | Saturated seconds | Saturation percentage |
|---|---|---|---|
| A | 8085 | 378 | 4.675325% |
| B | 8085 | 358 | 4.427953% |
| C | 8085 | 1529 | 18.911565% |
| D | 8085 | 1652 | 20.432900% |
Noise dominated data is calculated using 1-second bins in cleaned event files. If a bin has >2000 counts, and if more than 50% of those come from <1% of pixels, then it is considered to be noise-dominated and hence unusable.
| Quadrant | # 1 sec bins | Bins with >0 counts | Bins with >2000 counts | High rate bins dominated by noise | Noise dominated (total time) | Noise dominated (detector-on time) | Marked lightcurve |
|---|---|---|---|---|---|---|---|
| A | 13466 | 8087 | 268 | 268 | 1.99% | 3.31% | 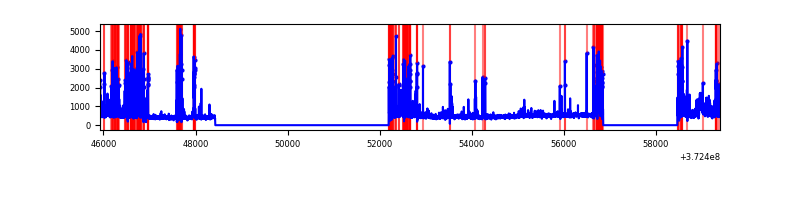 |
| B | 13466 | 8087 | 238 | 238 | 1.77% | 2.94% | 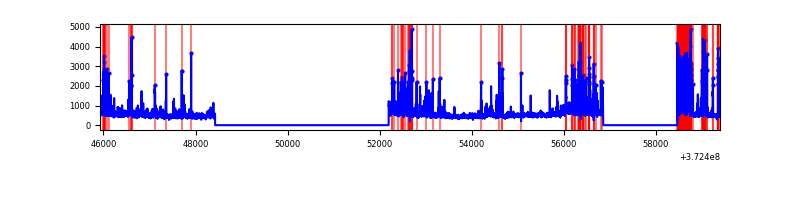 |
| C | 13466 | 8087 | 1221 | 1221 | 9.07% | 15.10% | 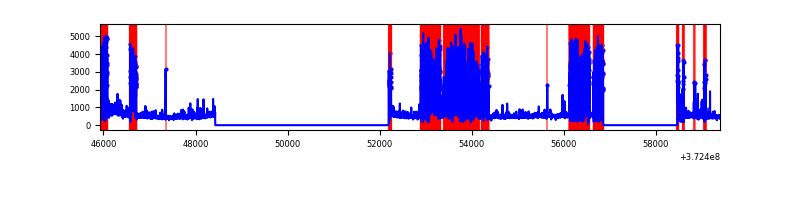 |
| D | 13466 | 8087 | 1637 | 1637 | 12.16% | 20.24% | 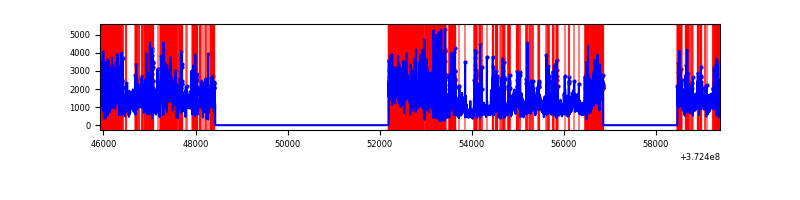 |
Top three noisy pixels from each quadrant. If the there are fewer than three noisy pixels in the level2.evt file, extra rows are filled as -1
| Pixel properties | Quadrant properties | ||||||
|---|---|---|---|---|---|---|---|
| Quadrant | DetID | PixID | Counts | Sigma | Mean | Median | Sigma |
| A | 15 | 237 | 1190885 | 6514.02 | 907 | 891 | 182.7 |
| A | 12 | 16 | 263987 | 1440.19 | 907 | 891 | 182.7 |
| A | 10 | 228 | 65926 | 356.0 | 907 | 891 | 182.7 |
| B | 5 | 172 | 1015866 | 5783.76 | 927 | 905 | 175.5 |
| B | 0 | 219 | 301869 | 1715.05 | 927 | 905 | 175.5 |
| B | 5 | 236 | 117478 | 664.29 | 927 | 905 | 175.5 |
| C | 0 | 10 | 4175335 | 21803.55 | 827 | 834 | 191.5 |
| C | 4 | 254 | 254831 | 1326.63 | 827 | 834 | 191.5 |
| C | 3 | 233 | 114155 | 591.88 | 827 | 834 | 191.5 |
| D | 8 | 195 | 5254831 | 24719.09 | 820 | 807 | 212.5 |
| D | 2 | 250 | 1208286 | 5680.94 | 820 | 807 | 212.5 |
| D | 7 | 80 | 958713 | 4506.75 | 820 | 807 | 212.5 |
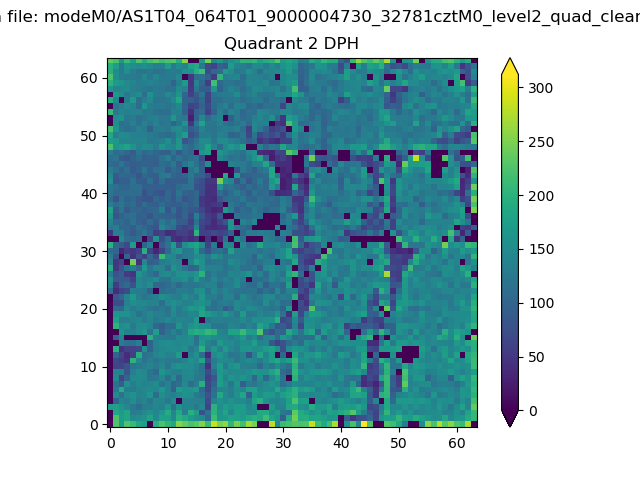
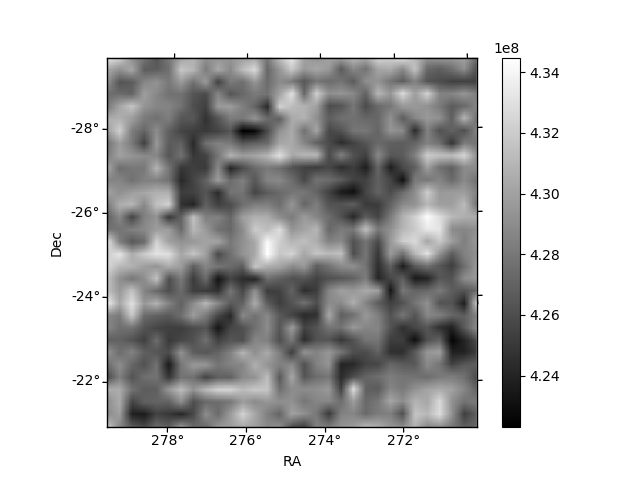
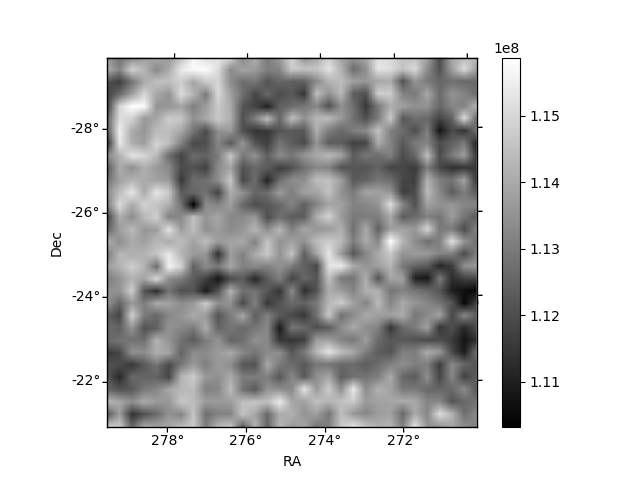
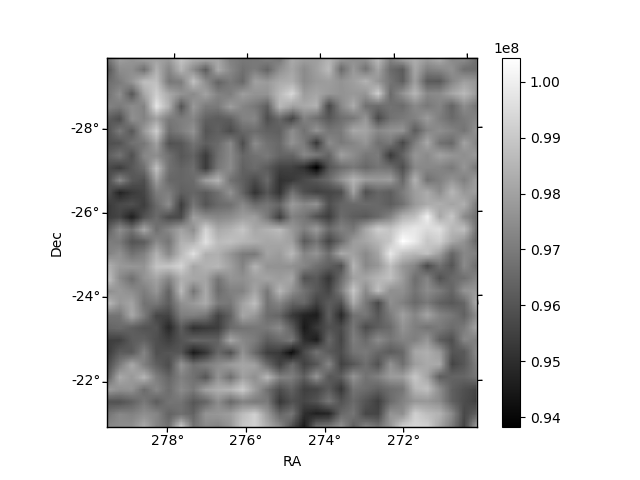
Histogram calculated using DETX and DETY for each event in the final _common_clean file
| Quadrant A | 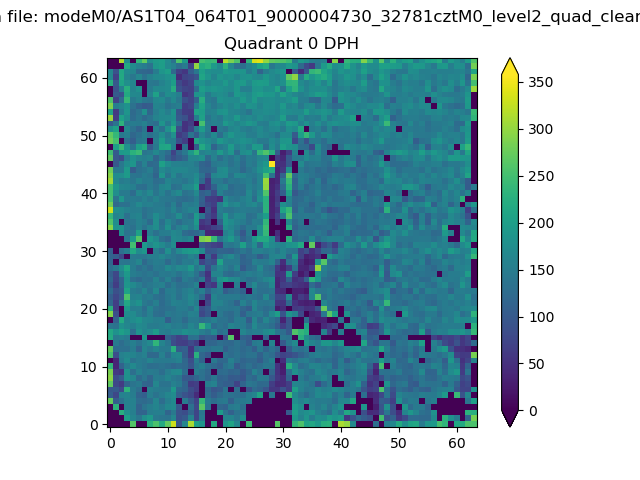 |
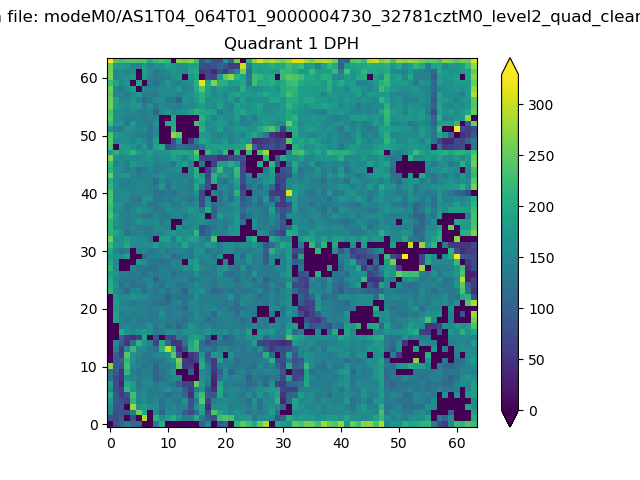 |
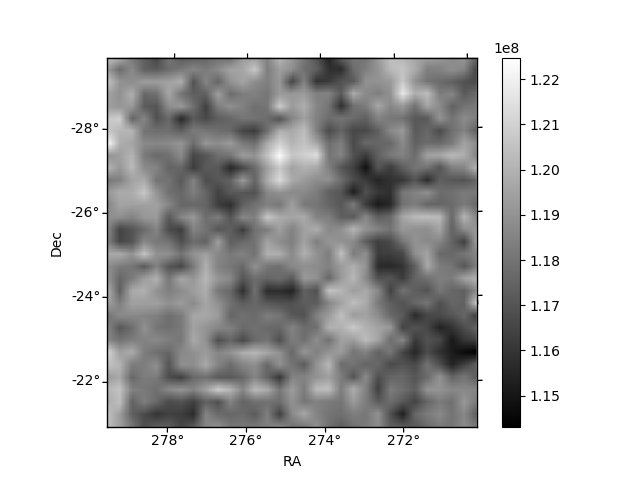
Quadrant B |
|---|---|---|---|
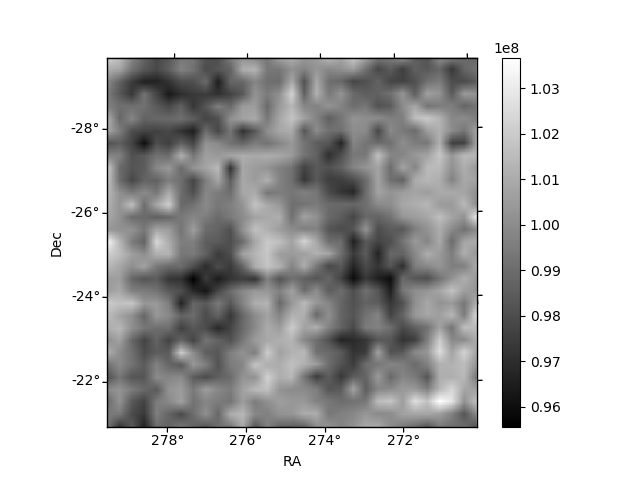
| Quadrant D | 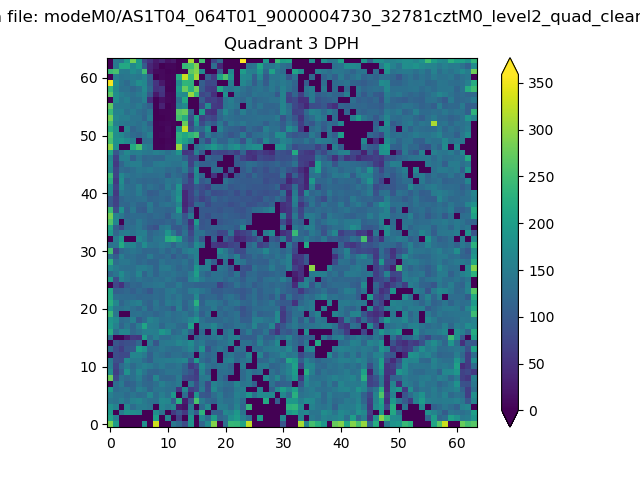 |
 |
Quadrant C |
| Plot type | Count rate plots | Images |
|---|---|---|
| Comparison with Poisson distribution Blue bars denote a histogram of data divided into 1 sec bins. Red curve is a Poisson curve with rate = median count rate of data. |
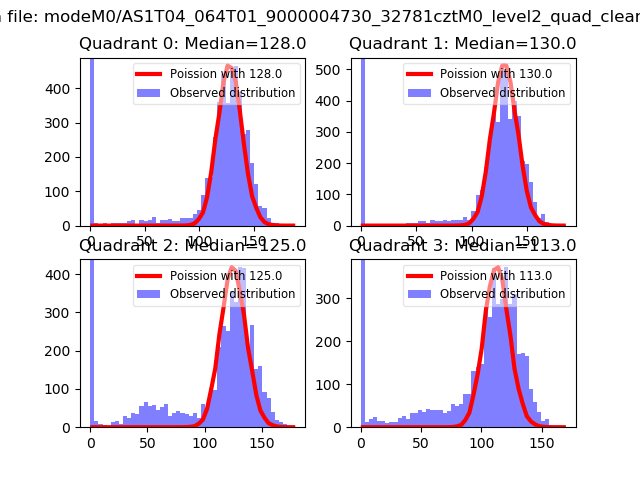 |
 |
| Quadrant-wise count rates Data is divided into 100 sec bins |
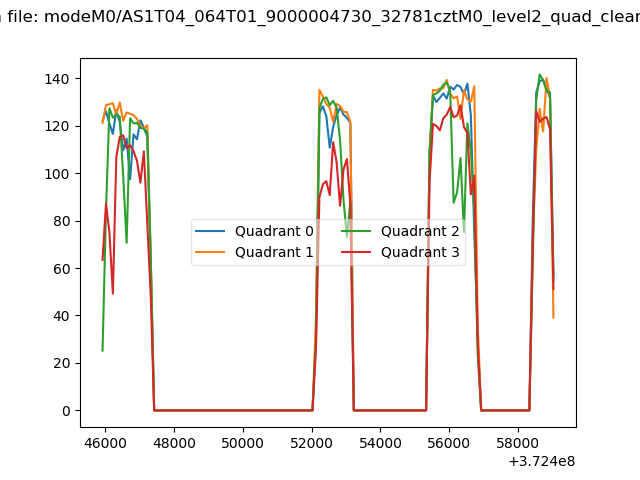 |
|
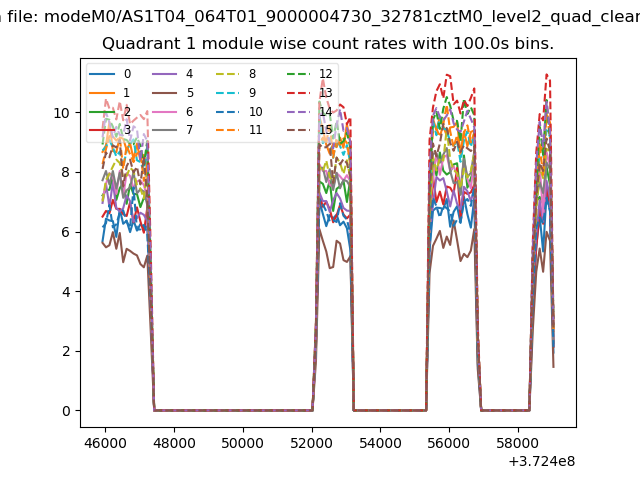
| Module-wise count rates for Quadrant A Data is divided into 100 sec bins |
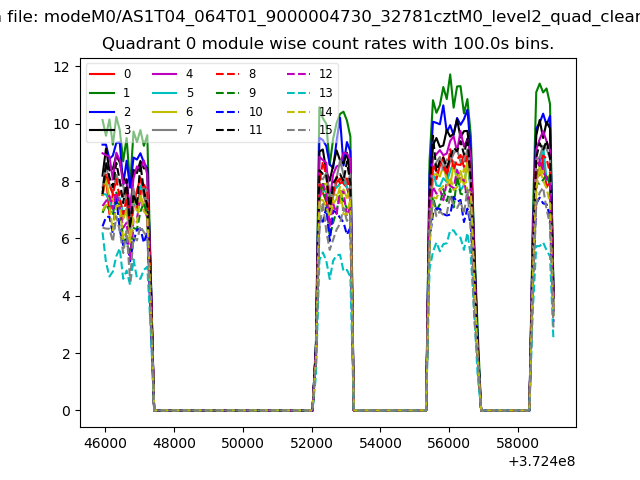 |
 |
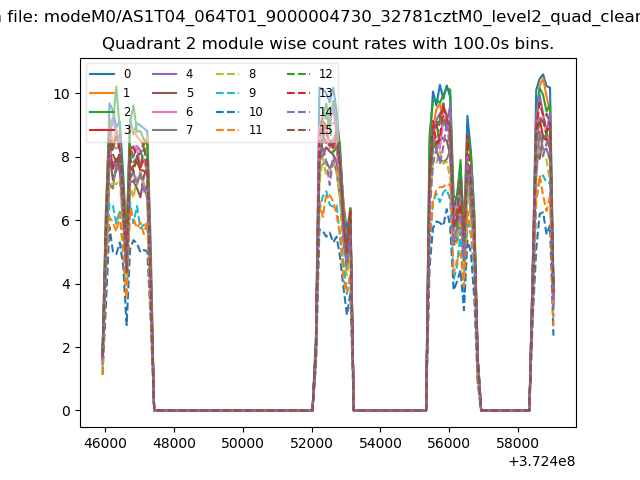
| Module-wise count rates for Quadrant B Data is divided into 100 sec bins |
 |
 |
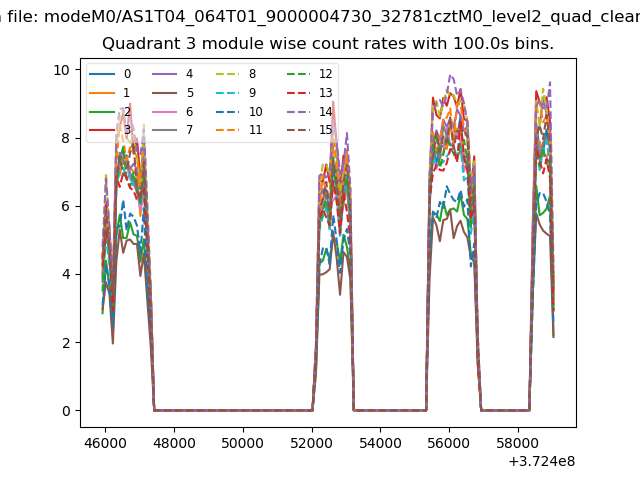
| Module-wise count rates for Quadrant C Data is divided into 100 sec bins |
 |
 |
| Module-wise count rates for Quadrant D Data is divided into 100 sec bins |
 |
 |
| Parameter | Plot |
|---|---|
| CZT HV Monitor | 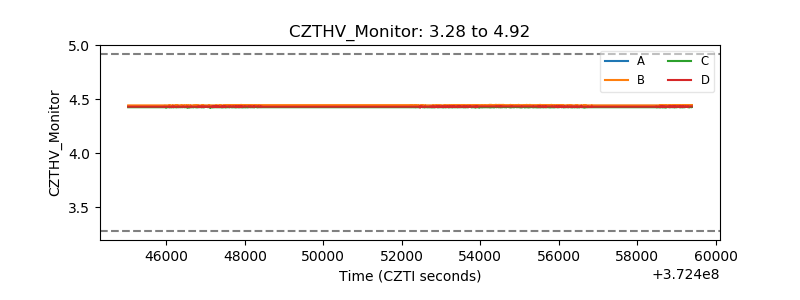 |
| D_VDD | 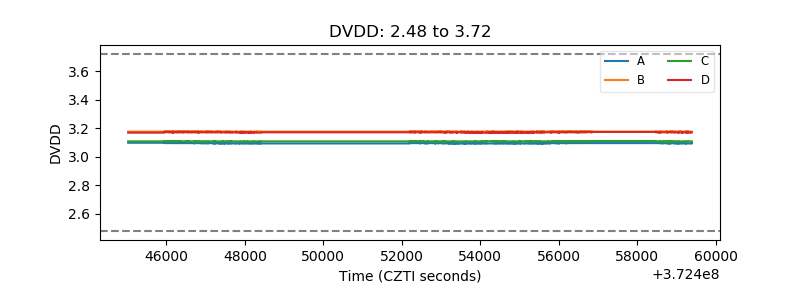 |
| Temperature 1 | 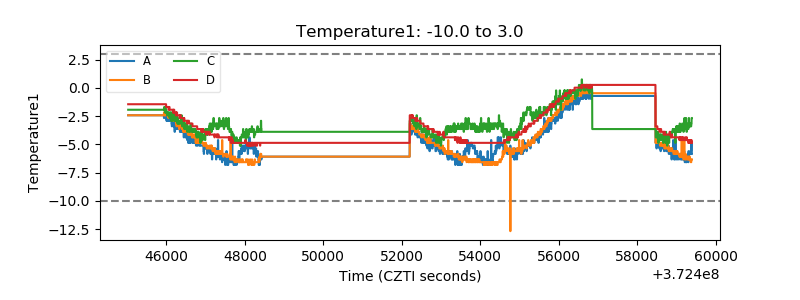 |
| Veto HV Monitor | 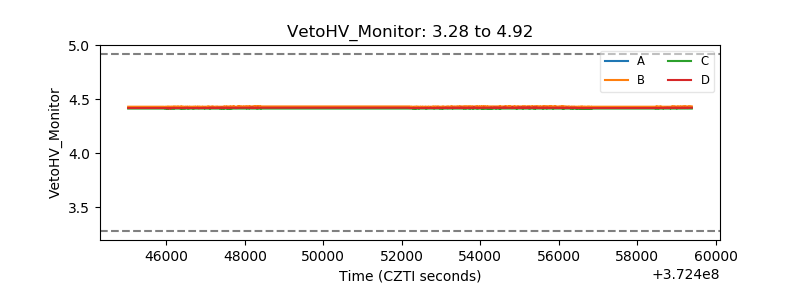 |
| Veto LLD | 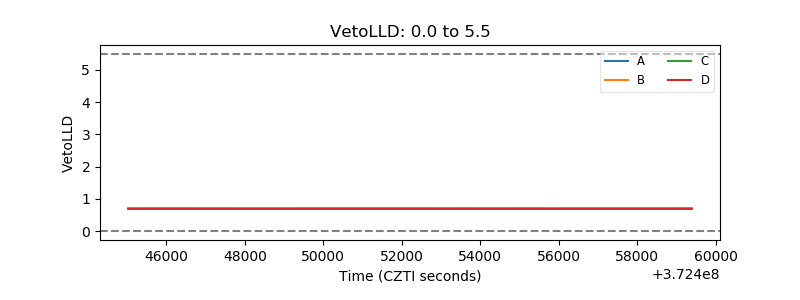 |
| Alpha Counter | 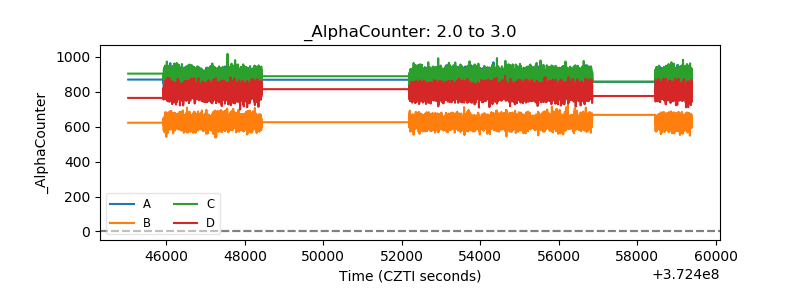 |
| _CPM_Rate | 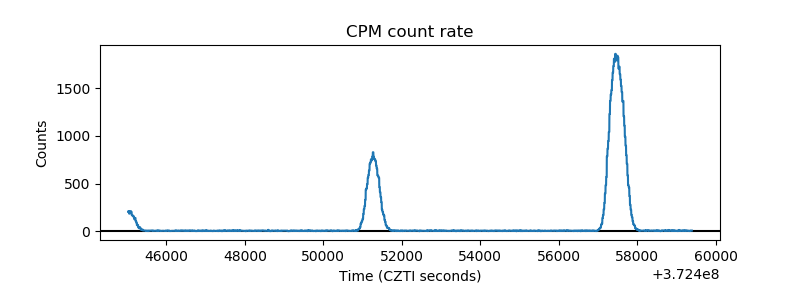 |
| CZT Counter | 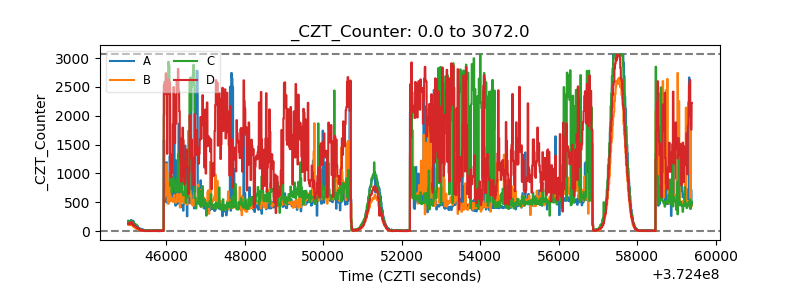 |
| +2.5 Volts monitor |  |
| +5 Volts monitor |  |
| _ROLL_ROT | 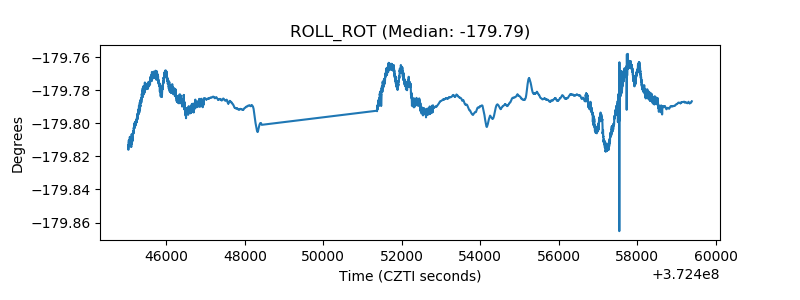 |
| _Roll_DEC | 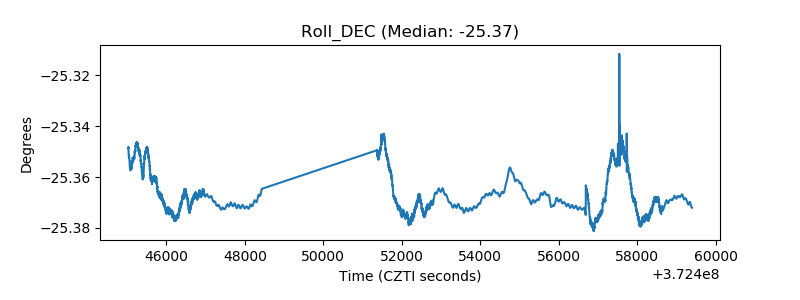 |
| _Roll_RA | 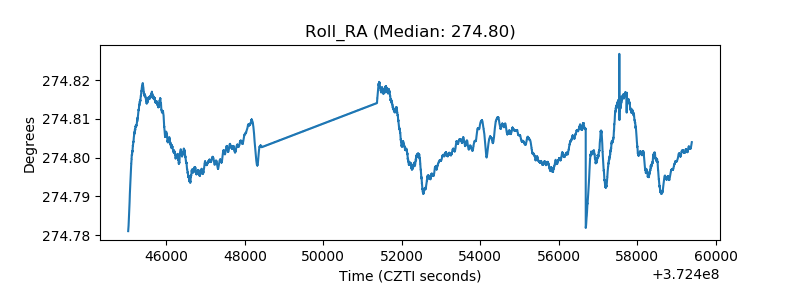 |
| Veto Counter | 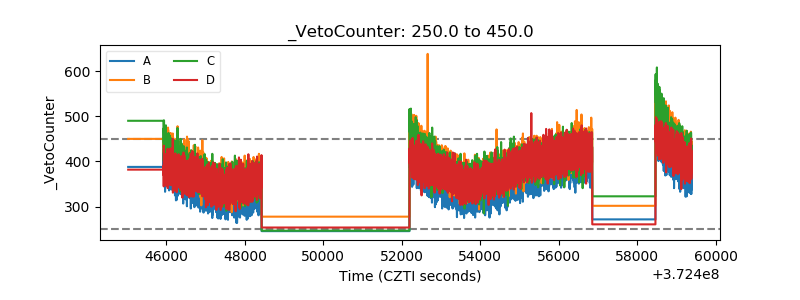 |