| Param | Original file | Final file |
|---|---|---|
| Filename | modeM0/AS1T04_064T01_9000004730_32783cztM0_level2.evt | modeM0/AS1T04_064T01_9000004730_32783cztM0_level2_quad_clean.evt |
| Size (bytes) | 660,075,840 | 55,621,440 |
| Size | 629.5 MB | 53.0 MB |
| Events in quadrant A | 4,049,674 | 330,068 |
| Events in quadrant B | 4,024,621 | 332,313 |
| Events in quadrant C | 3,949,049 | 334,428 |
| Events in quadrant D | 7,586,776 | 292,034 |
| Mode M9 | |||
|---|---|---|---|
| Quadrant | BADHDUFLAG | Total packets | Discarded packets |
| A | 0 | 26 | 0 |
| B | 0 | 26 | 0 |
| C | 0 | 26 | 0 |
| D | 0 | 27 | 0 |
| Mode SS | |||
|---|---|---|---|
| Quadrant | BADHDUFLAG | Total packets | Discarded packets |
| A | 0 | 114 | 0 |
| B | 0 | 114 | 0 |
| C | 0 | 114 | 0 |
| D | 0 | 114 | 0 |
| Mode M0 | |||
|---|---|---|---|
| Quadrant | BADHDUFLAG | Total packets | Discarded packets |
| A | 0 | 15860 | 3 |
| B | 0 | 15637 | 2 |
| C | 0 | 15304 | 2 |
| D | 0 | 26504 | 2 |
| Quadrant | Total seconds | Saturated seconds | Saturation percentage |
|---|---|---|---|
| A | 5642 | 259 | 4.590571% |
| B | 5642 | 311 | 5.512230% |
| C | 5642 | 324 | 5.742644% |
| D | 5642 | 819 | 14.516129% |
Noise dominated data is calculated using 1-second bins in cleaned event files. If a bin has >2000 counts, and if more than 50% of those come from <1% of pixels, then it is considered to be noise-dominated and hence unusable.
| Quadrant | # 1 sec bins | Bins with >0 counts | Bins with >2000 counts | High rate bins dominated by noise | Noise dominated (total time) | Noise dominated (detector-on time) | Marked lightcurve |
|---|---|---|---|---|---|---|---|
| A | 7375 | 5643 | 138 | 138 | 1.87% | 2.45% | 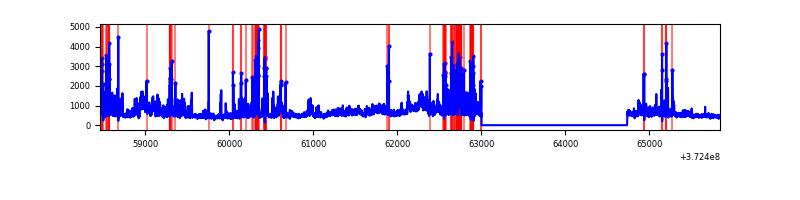 |
| B | 7375 | 5643 | 223 | 223 | 3.02% | 3.95% | 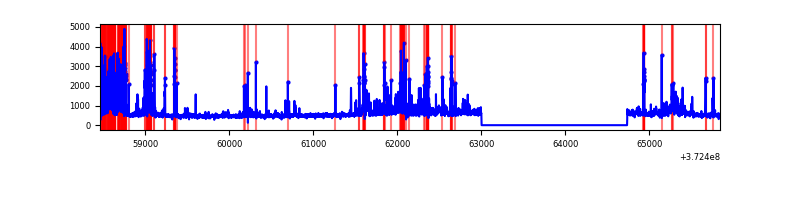 |
| C | 7375 | 5643 | 251 | 251 | 3.40% | 4.45% | 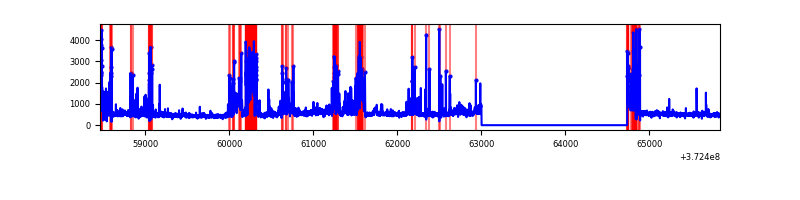 |
| D | 7375 | 5643 | 727 | 727 | 9.86% | 12.88% | 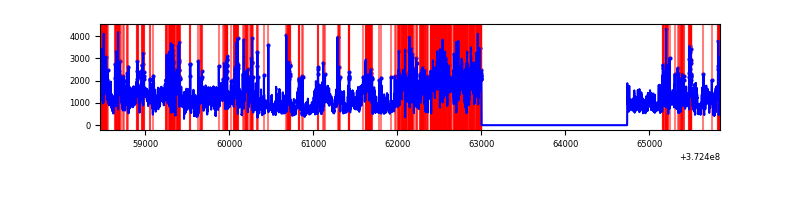 |
Top three noisy pixels from each quadrant. If the there are fewer than three noisy pixels in the level2.evt file, extra rows are filled as -1
| Pixel properties | Quadrant properties | ||||||
|---|---|---|---|---|---|---|---|
| Quadrant | DetID | PixID | Counts | Sigma | Mean | Median | Sigma |
| A | 15 | 237 | 612523 | 4547.95 | 671 | 659 | 134.5 |
| A | 12 | 16 | 591418 | 4391.08 | 671 | 659 | 134.5 |
| A | 10 | 228 | 87978 | 649.04 | 671 | 659 | 134.5 |
| B | 5 | 172 | 859039 | 6657.67 | 678 | 663 | 128.9 |
| B | 5 | 200 | 172382 | 1331.87 | 678 | 663 | 128.9 |
| B | 0 | 219 | 139905 | 1079.98 | 678 | 663 | 128.9 |
| C | 0 | 10 | 1249612 | 8249.53 | 651 | 657 | 151.4 |
| C | 3 | 233 | 57768 | 377.23 | 651 | 657 | 151.4 |
| C | 4 | 254 | 25903 | 166.75 | 651 | 657 | 151.4 |
| D | 8 | 195 | 3869667 | 23518.11 | 627 | 615 | 164.5 |
| D | 2 | 250 | 466453 | 2831.61 | 627 | 615 | 164.5 |
| D | 10 | 203 | 125124 | 756.83 | 627 | 615 | 164.5 |
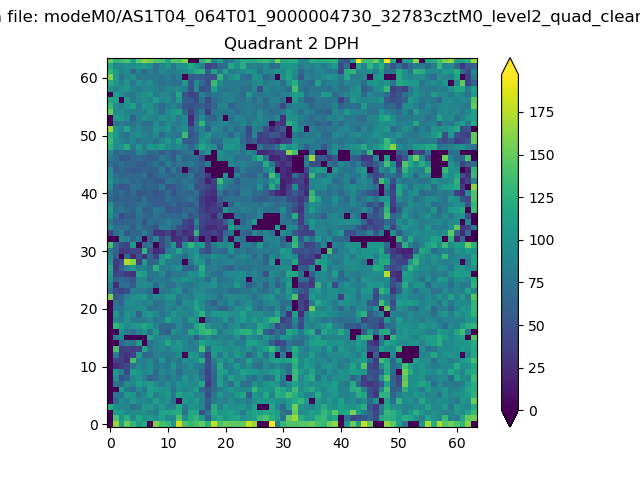
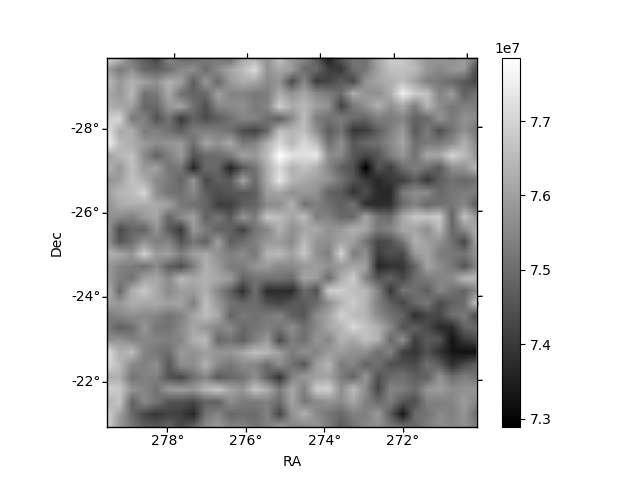
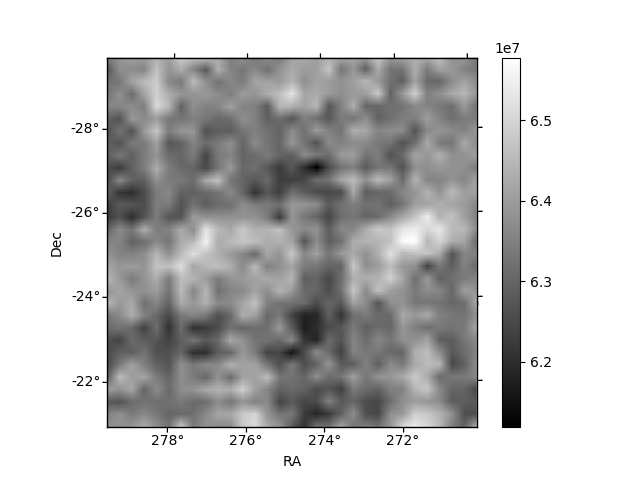
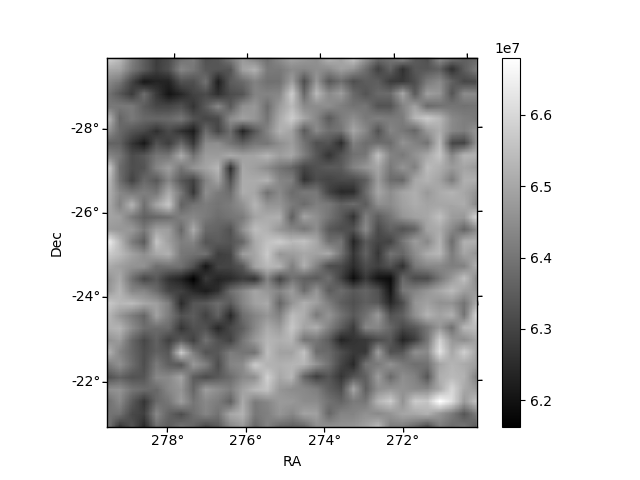
Histogram calculated using DETX and DETY for each event in the final _common_clean file
| Quadrant A | 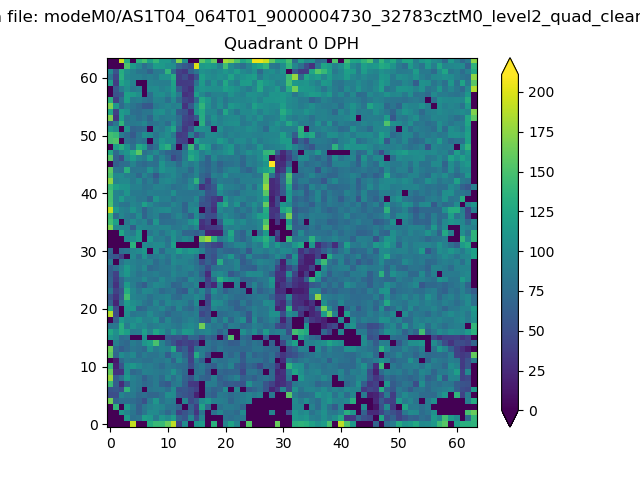 |
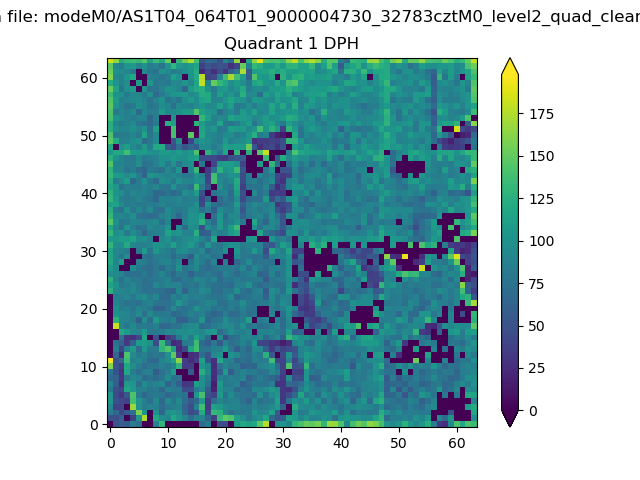 |
Quadrant B |
|---|---|---|---|
| Quadrant D | 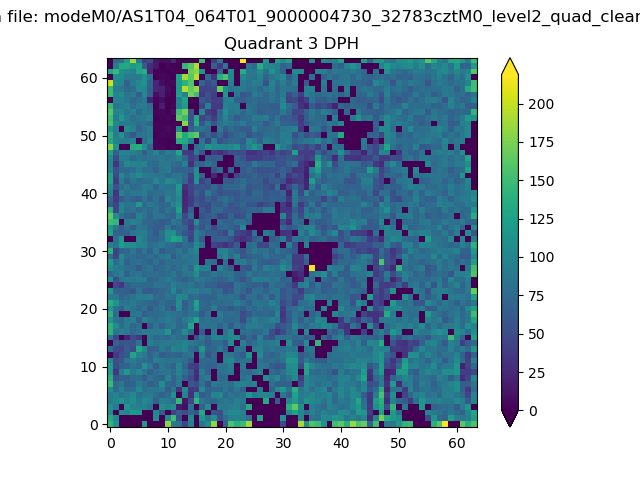 |
 |
Quadrant C |
| Plot type | Count rate plots | Images |
|---|---|---|
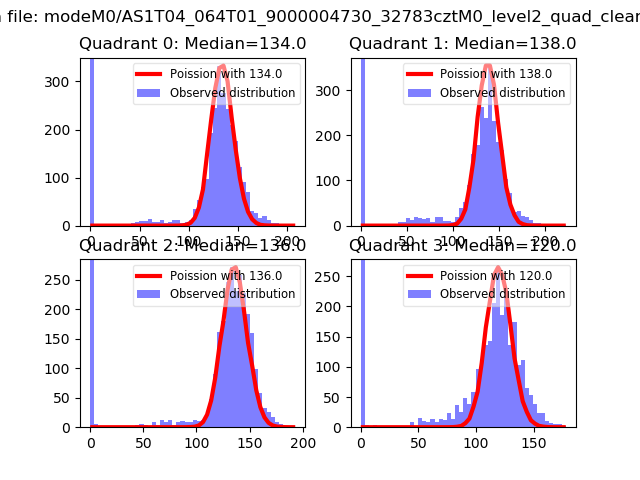
| Comparison with Poisson distribution Blue bars denote a histogram of data divided into 1 sec bins. Red curve is a Poisson curve with rate = median count rate of data. |
 |
 |
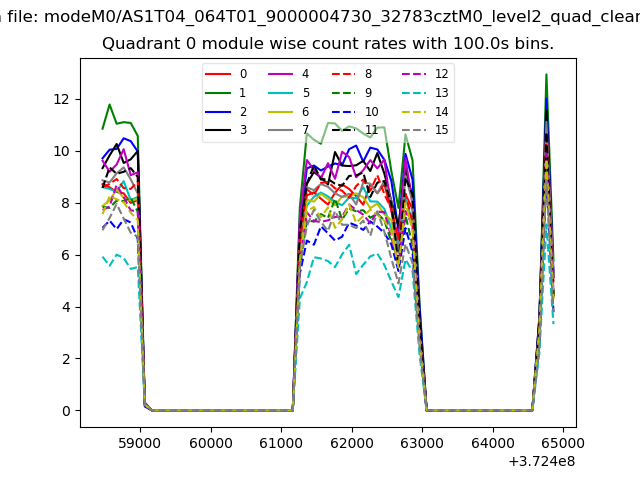
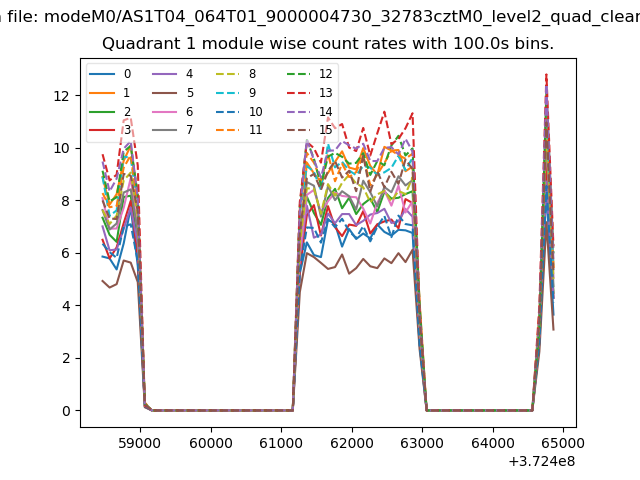
| Quadrant-wise count rates Data is divided into 100 sec bins |
 |
|
| Module-wise count rates for Quadrant A Data is divided into 100 sec bins |
 |
 |
| Module-wise count rates for Quadrant B Data is divided into 100 sec bins |
 |
 |
| Module-wise count rates for Quadrant C Data is divided into 100 sec bins |
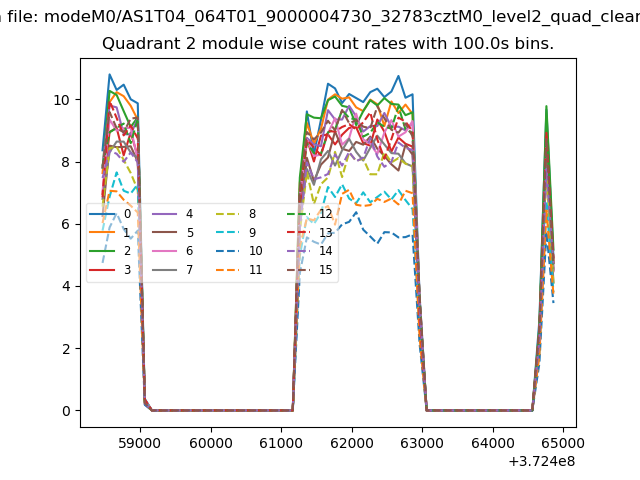 |
 |
| Module-wise count rates for Quadrant D Data is divided into 100 sec bins |
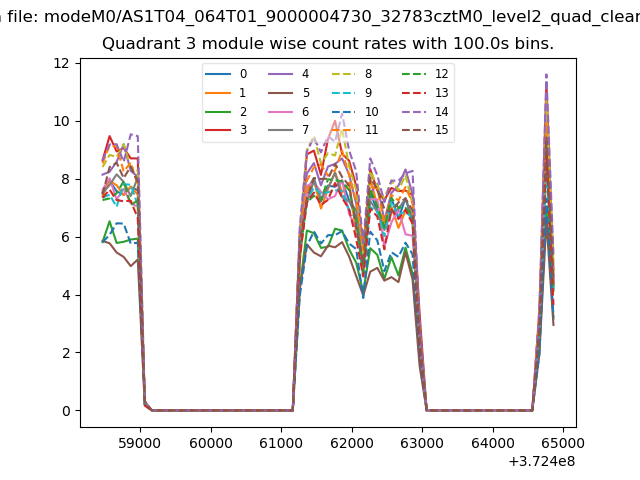 |
 |
| Parameter | Plot |
|---|---|
| CZT HV Monitor | 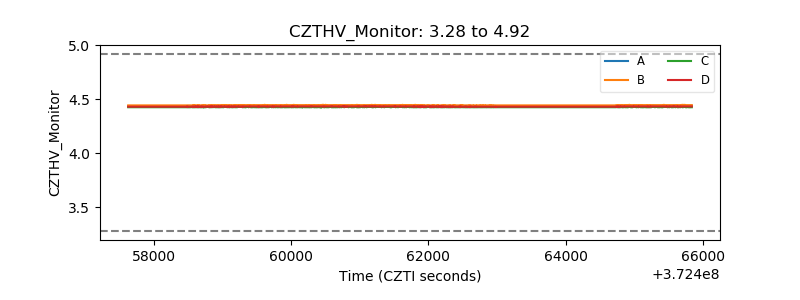 |
| D_VDD | 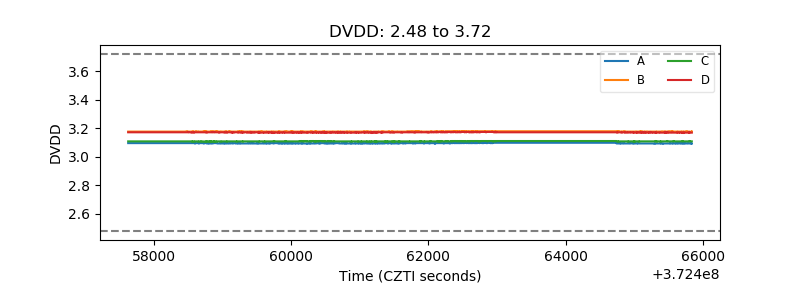 |
| Temperature 1 | 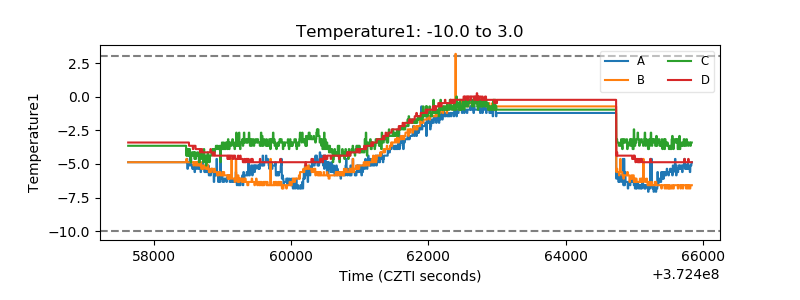 |
| Veto HV Monitor | 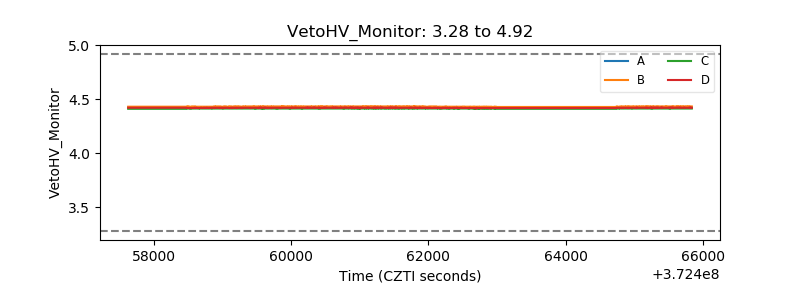 |
| Veto LLD | 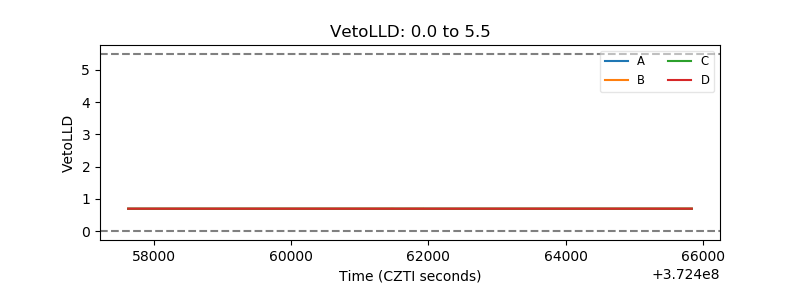 |
| Alpha Counter |  |
| _CPM_Rate | 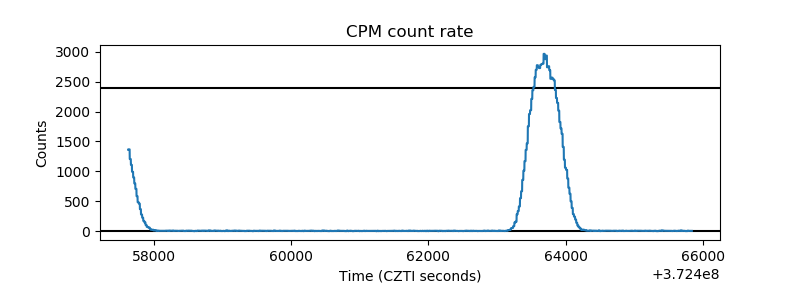 |
| CZT Counter | 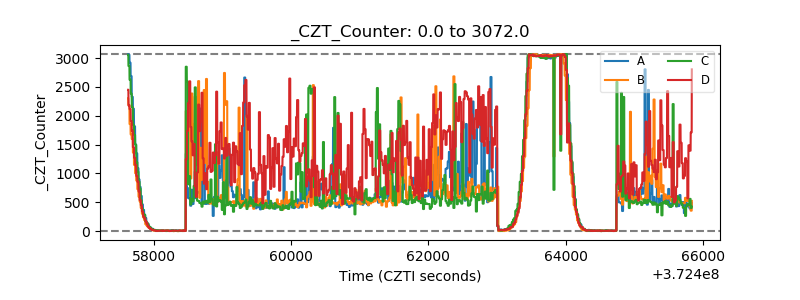 |
| +2.5 Volts monitor | 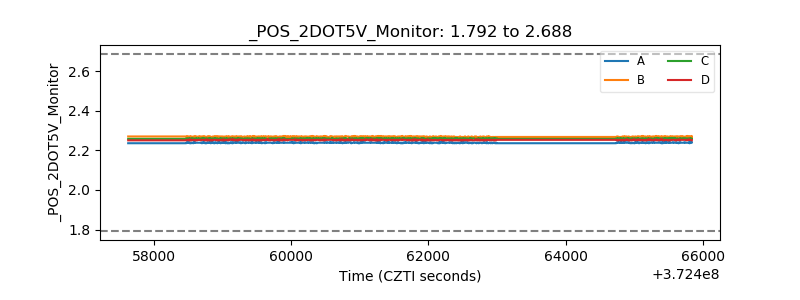 |
| +5 Volts monitor |  |
| _ROLL_ROT | 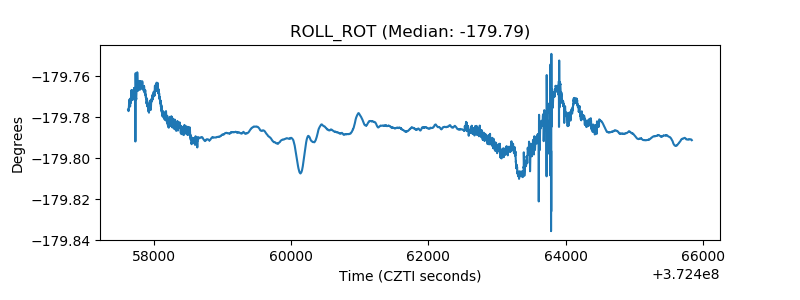 |
| _Roll_DEC | 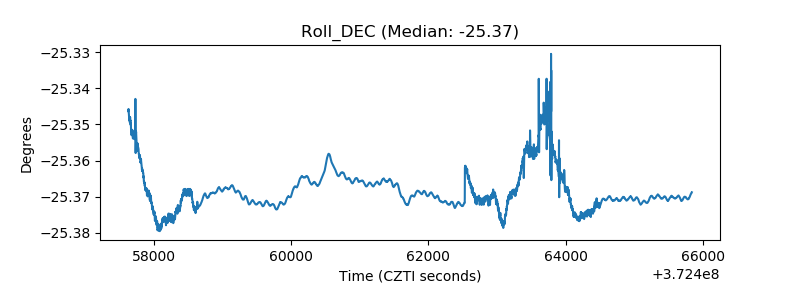 |
| _Roll_RA | 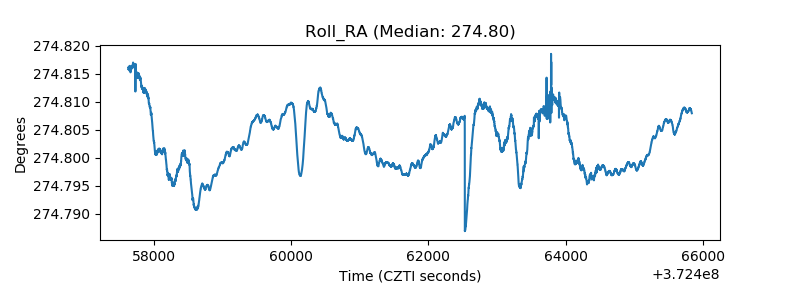 |
| Veto Counter | 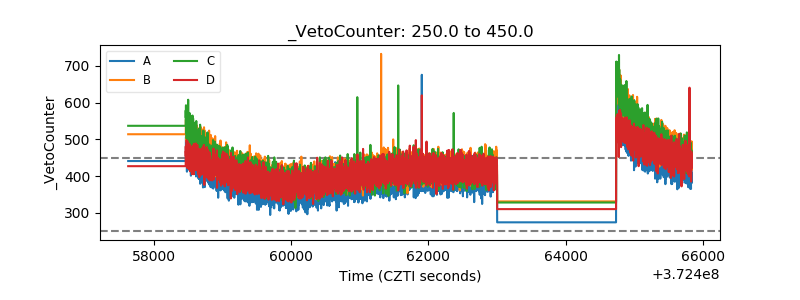 |