| Param | Original file | Final file |
|---|---|---|
| Filename | modeM0/AS1T04_064T01_9000004730_32784cztM0_level2.evt | modeM0/AS1T04_064T01_9000004730_32784cztM0_level2_quad_clean.evt |
| Size (bytes) | 3,861,046,080 | 326,448,000 |
| Size | 3.6 GB | 311.3 MB |
| Events in quadrant A | 22,391,419 | 1,927,650 |
| Events in quadrant B | 21,275,872 | 2,065,093 |
| Events in quadrant C | 22,163,535 | 2,011,850 |
| Events in quadrant D | 48,926,590 | 1,645,830 |
| Mode M9 | |||
|---|---|---|---|
| Quadrant | BADHDUFLAG | Total packets | Discarded packets |
| A | 0 | 108 | 0 |
| B | 0 | 108 | 0 |
| C | 0 | 108 | 0 |
| D | 0 | 108 | 0 |
| Mode SS | |||
|---|---|---|---|
| Quadrant | BADHDUFLAG | Total packets | Discarded packets |
| A | 0 | 662 | 0 |
| B | 0 | 662 | 0 |
| C | 0 | 662 | 0 |
| D | 0 | 662 | 0 |
| Mode M0 | |||
|---|---|---|---|
| Quadrant | BADHDUFLAG | Total packets | Discarded packets |
| A | 0 | 87771 | 7 |
| B | 0 | 84539 | 6 |
| C | 0 | 86524 | 6 |
| D | 0 | 168115 | 6 |
| Quadrant | Total seconds | Saturated seconds | Saturation percentage |
|---|---|---|---|
| A | 32490 | 2192 | 6.746691% |
| B | 32490 | 947 | 2.914743% |
| C | 32490 | 1887 | 5.807941% |
| D | 32490 | 7943 | 24.447522% |
Noise dominated data is calculated using 1-second bins in cleaned event files. If a bin has >2000 counts, and if more than 50% of those come from <1% of pixels, then it is considered to be noise-dominated and hence unusable.
| Quadrant | # 1 sec bins | Bins with >0 counts | Bins with >2000 counts | High rate bins dominated by noise | Noise dominated (total time) | Noise dominated (detector-on time) | Marked lightcurve |
|---|---|---|---|---|---|---|---|
| A | 43213 | 32496 | 1385 | 1385 | 3.21% | 4.26% | 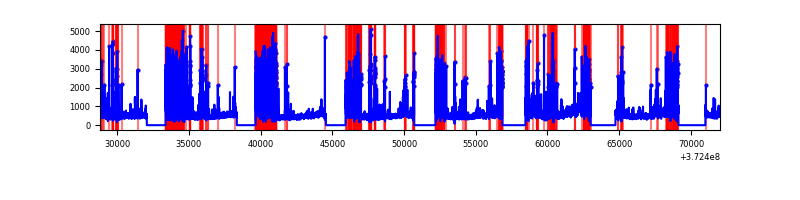 |
| B | 43213 | 32497 | 611 | 611 | 1.41% | 1.88% | 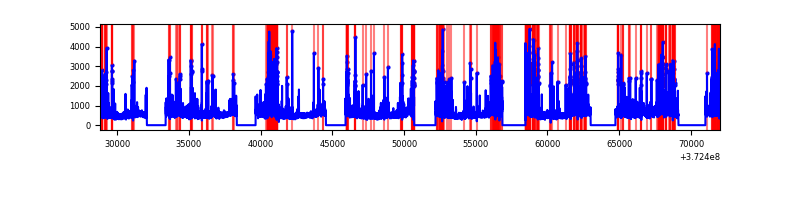 |
| C | 43213 | 32497 | 1490 | 1490 | 3.45% | 4.59% | 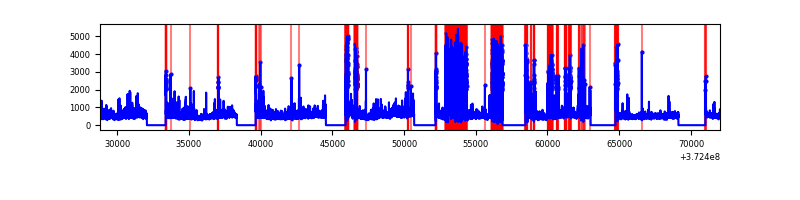 |
| D | 43213 | 32497 | 7507 | 7507 | 17.37% | 23.10% | 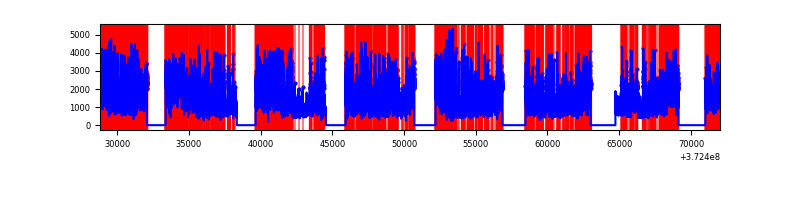 |
Top three noisy pixels from each quadrant. If the there are fewer than three noisy pixels in the level2.evt file, extra rows are filled as -1
| Pixel properties | Quadrant properties | ||||||
|---|---|---|---|---|---|---|---|
| Quadrant | DetID | PixID | Counts | Sigma | Mean | Median | Sigma |
| A | 15 | 237 | 5677092 | 7560.51 | 3759 | 3692 | 750.4 |
| A | 12 | 16 | 1249225 | 1659.83 | 3759 | 3692 | 750.4 |
| A | 7 | 16 | 223061 | 292.34 | 3759 | 3692 | 750.4 |
| B | 5 | 172 | 2633416 | 3615.8 | 3894 | 3814 | 727.3 |
| B | 0 | 219 | 1224367 | 1678.31 | 3894 | 3814 | 727.3 |
| B | 12 | 1 | 514591 | 702.34 | 3894 | 3814 | 727.3 |
| C | 0 | 10 | 5470579 | 6438.88 | 3693 | 3730 | 849.0 |
| C | 7 | 221 | 960368 | 1126.73 | 3693 | 3730 | 849.0 |
| C | 4 | 254 | 569129 | 665.93 | 3693 | 3730 | 849.0 |
| D | 8 | 195 | 19127689 | 21608.61 | 3428 | 3366 | 885.0 |
| D | 2 | 250 | 4585206 | 5177.03 | 3428 | 3366 | 885.0 |
| D | 12 | 227 | 4266539 | 4816.97 | 3428 | 3366 | 885.0 |
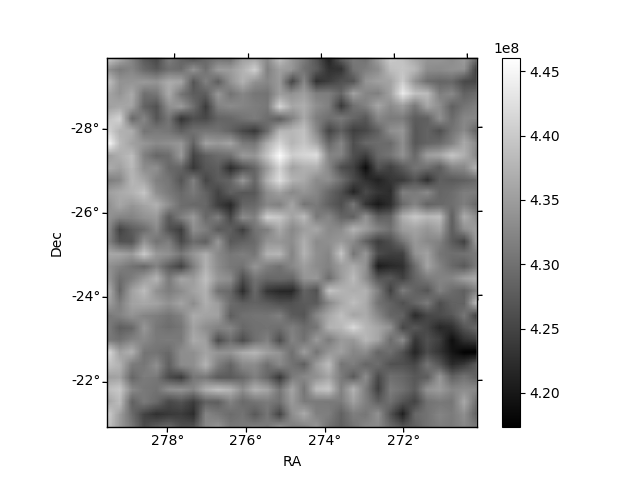
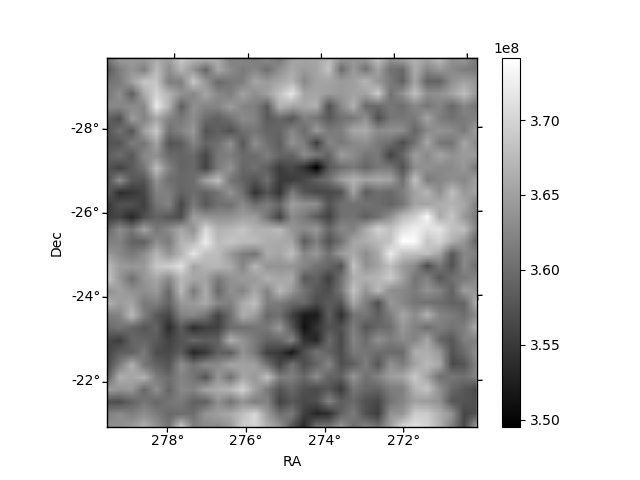
Histogram calculated using DETX and DETY for each event in the final _common_clean file
| Quadrant A | 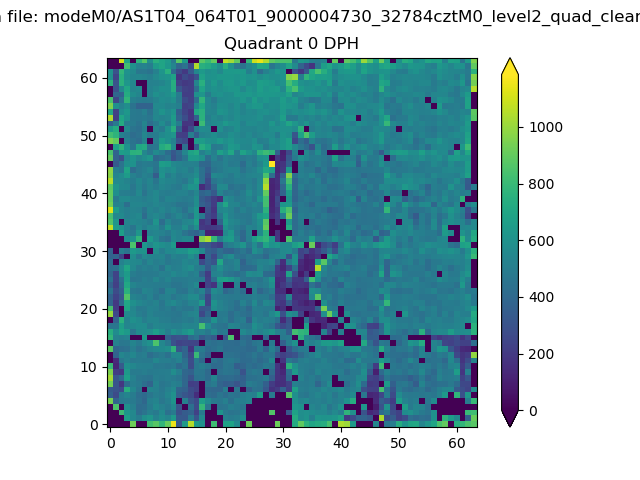 |
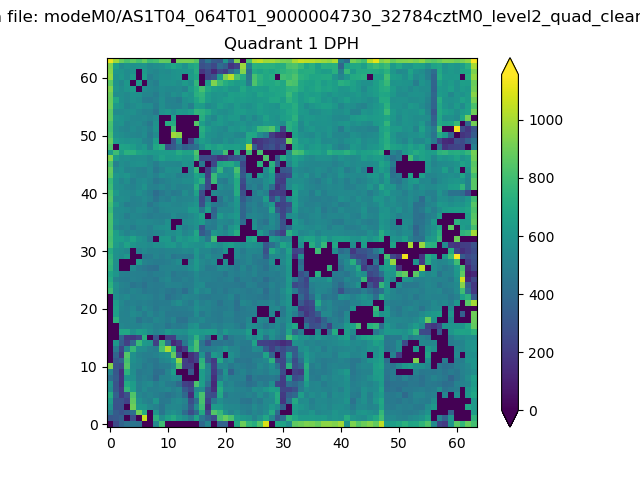 |
Quadrant B |
|---|---|---|---|
| Quadrant D | 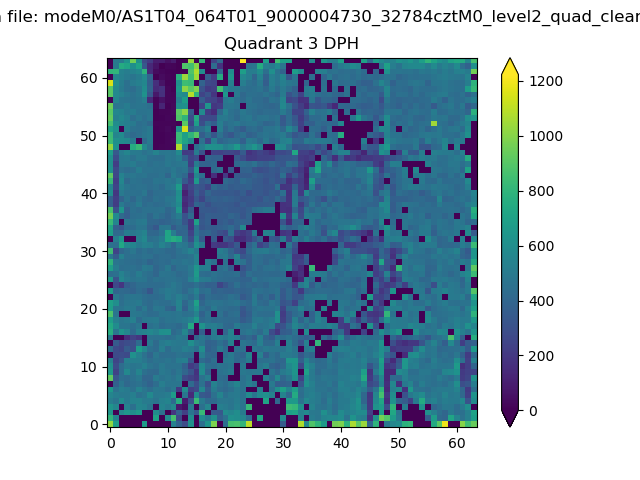 |
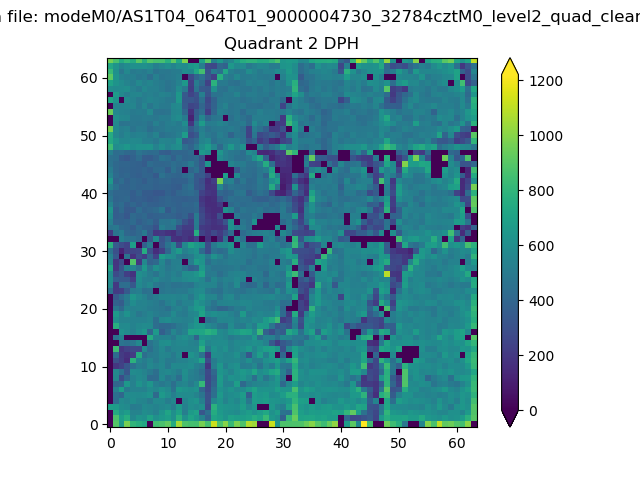 |
Quadrant C |
| Plot type | Count rate plots | Images |
|---|---|---|
| Comparison with Poisson distribution Blue bars denote a histogram of data divided into 1 sec bins. Red curve is a Poisson curve with rate = median count rate of data. |
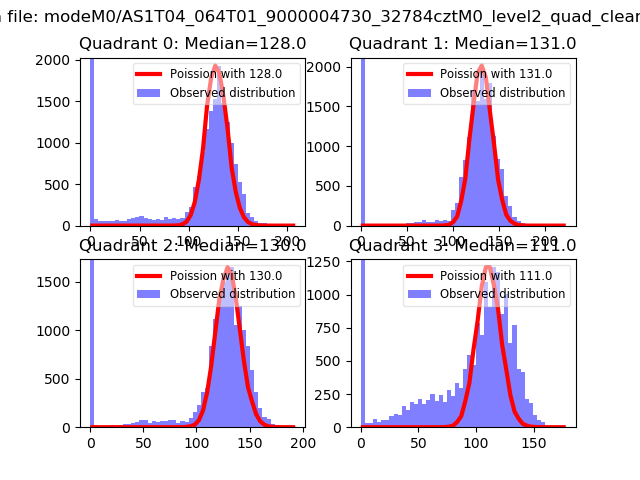 |
 |
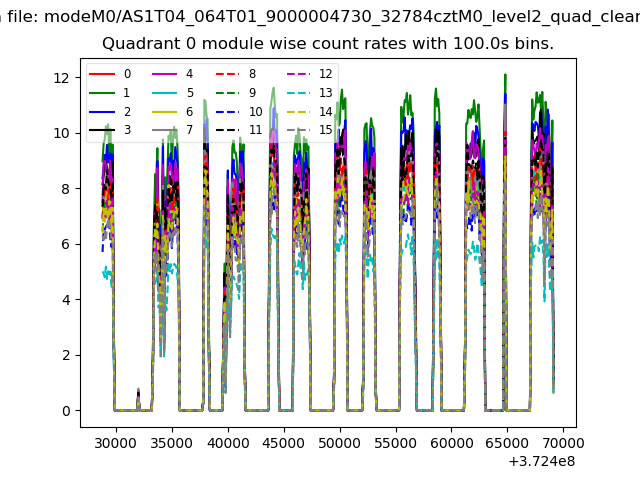
| Quadrant-wise count rates Data is divided into 100 sec bins |
 |
|
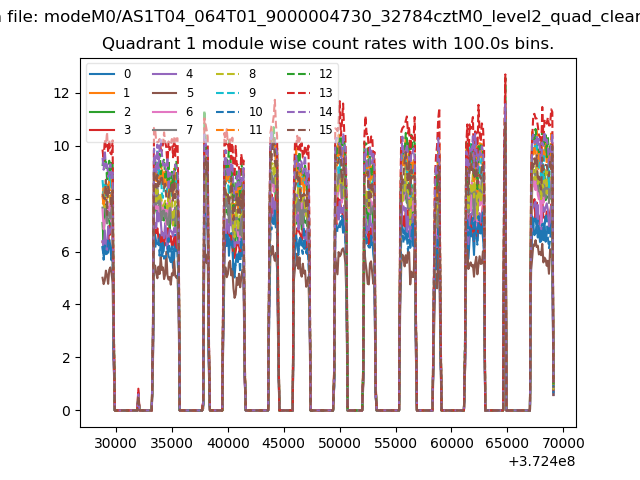
| Module-wise count rates for Quadrant A Data is divided into 100 sec bins |
 |
 |
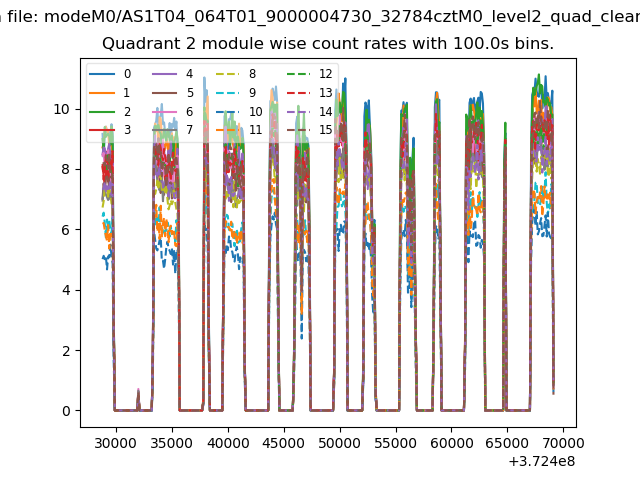
| Module-wise count rates for Quadrant B Data is divided into 100 sec bins |
 |
 |
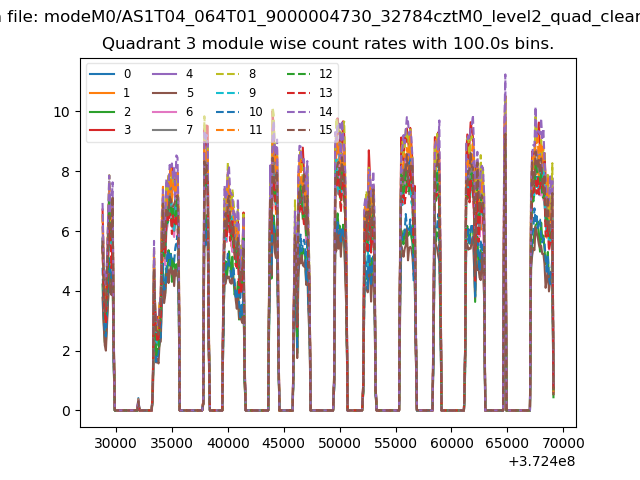
| Module-wise count rates for Quadrant C Data is divided into 100 sec bins |
 |
 |
| Module-wise count rates for Quadrant D Data is divided into 100 sec bins |
 |
 |
| Parameter | Plot |
|---|---|
| CZT HV Monitor | 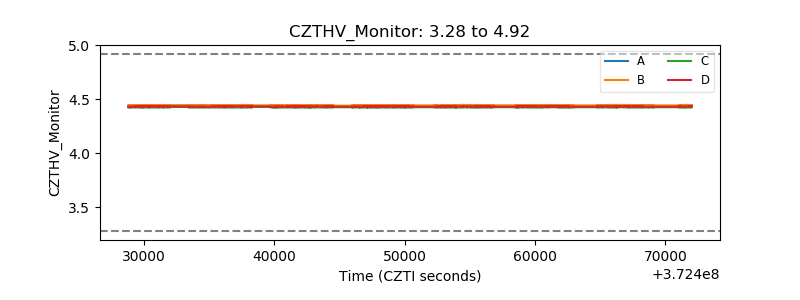 |
| D_VDD | 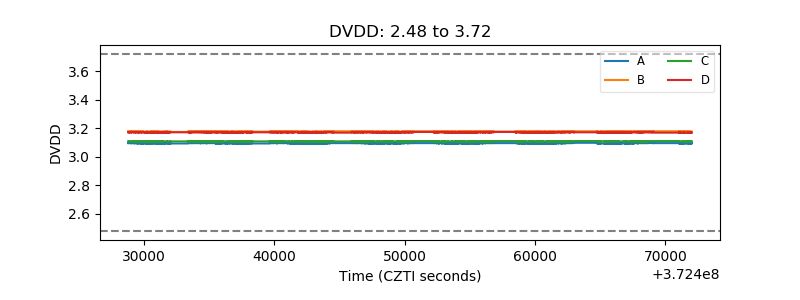 |
| Temperature 1 | 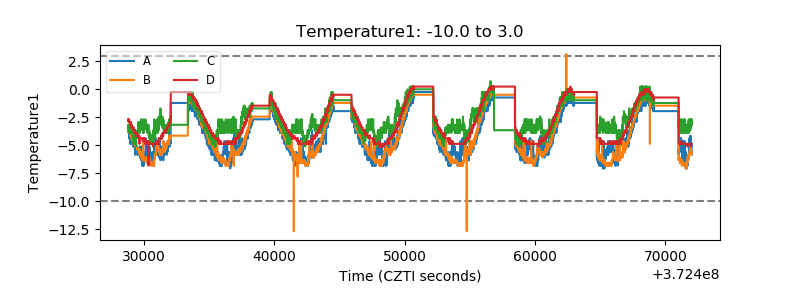 |
| Veto HV Monitor |  |
| Veto LLD |  |
| Alpha Counter | 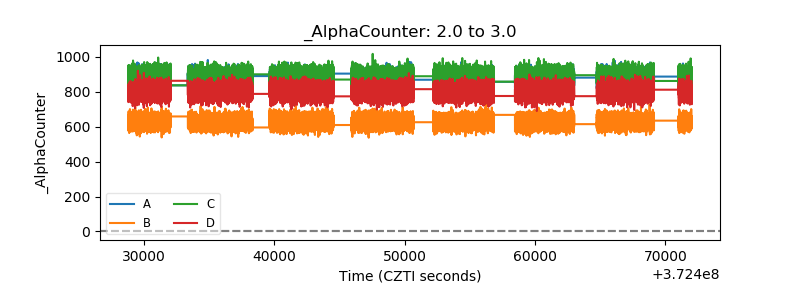 |
| _CPM_Rate | 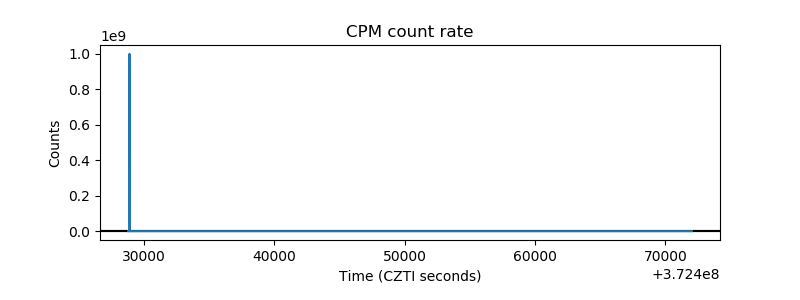 |
| CZT Counter | 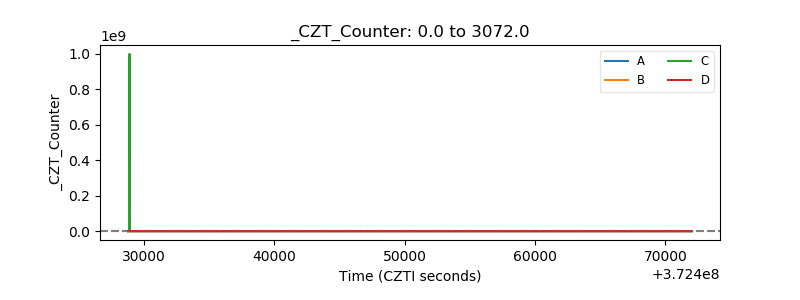 |
| +2.5 Volts monitor |  |
| +5 Volts monitor |  |
| _ROLL_ROT | 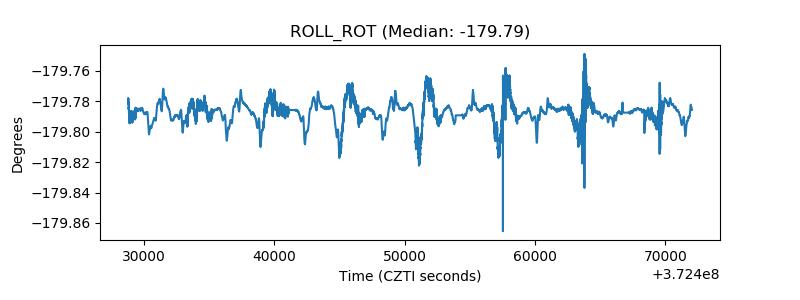 |
| _Roll_DEC | 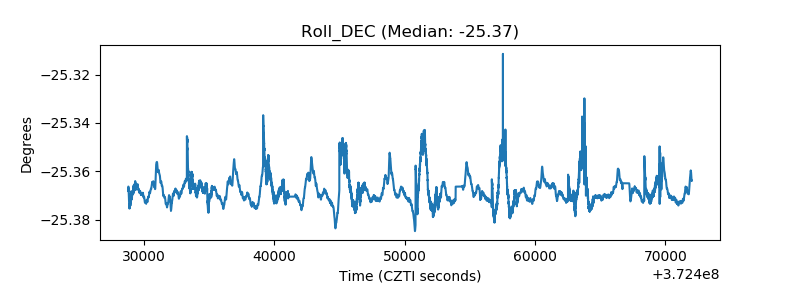 |
| _Roll_RA | 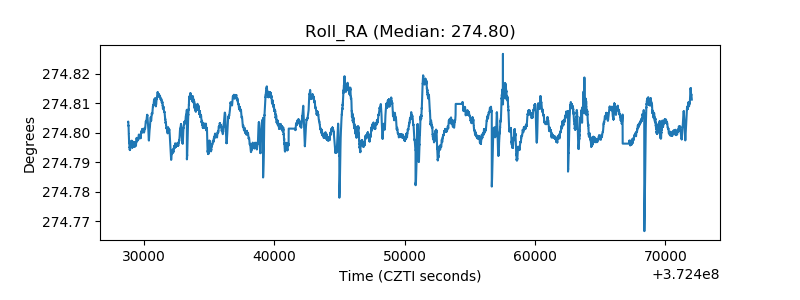 |
| Veto Counter | 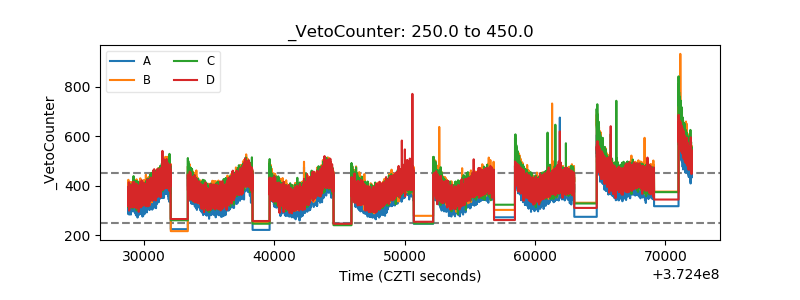 |