| Param | Original file | Final file |
|---|---|---|
| Filename | modeM0/AS1T04_064T01_9000004730_32786cztM0_level2.evt | modeM0/AS1T04_064T01_9000004730_32786cztM0_level2_quad_clean.evt |
| Size (bytes) | 803,318,400 | 55,405,440 |
| Size | 766.1 MB | 52.8 MB |
| Events in quadrant A | 3,618,173 | 365,215 |
| Events in quadrant B | 3,791,125 | 384,515 |
| Events in quadrant C | 6,638,992 | 306,634 |
| Events in quadrant D | 9,946,652 | 271,175 |
| Mode M9 | |||
|---|---|---|---|
| Quadrant | BADHDUFLAG | Total packets | Discarded packets |
| A | 0 | 24 | 0 |
| B | 0 | 24 | 0 |
| C | 0 | 24 | 0 |
| D | 0 | 25 | 0 |
| Mode SS | |||
|---|---|---|---|
| Quadrant | BADHDUFLAG | Total packets | Discarded packets |
| A | 0 | 102 | 0 |
| B | 0 | 102 | 0 |
| C | 0 | 102 | 0 |
| D | 0 | 102 | 0 |
| Mode M0 | |||
|---|---|---|---|
| Quadrant | BADHDUFLAG | Total packets | Discarded packets |
| A | 0 | 13753 | 3 |
| B | 0 | 14539 | 2 |
| C | 0 | 22933 | 2 |
| D | 0 | 32958 | 2 |
| Quadrant | Total seconds | Saturated seconds | Saturation percentage |
|---|---|---|---|
| A | 4961 | 376 | 7.579117% |
| B | 4961 | 316 | 6.369684% |
| C | 4961 | 1704 | 34.347914% |
| D | 4961 | 2430 | 48.982060% |
Noise dominated data is calculated using 1-second bins in cleaned event files. If a bin has >2000 counts, and if more than 50% of those come from <1% of pixels, then it is considered to be noise-dominated and hence unusable.
| Quadrant | # 1 sec bins | Bins with >0 counts | Bins with >2000 counts | High rate bins dominated by noise | Noise dominated (total time) | Noise dominated (detector-on time) | Marked lightcurve |
|---|---|---|---|---|---|---|---|
| A | 7053 | 4962 | 233 | 233 | 3.30% | 4.70% | 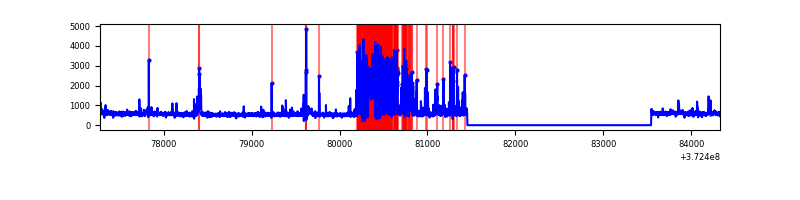 |
| B | 7053 | 4962 | 204 | 204 | 2.89% | 4.11% | 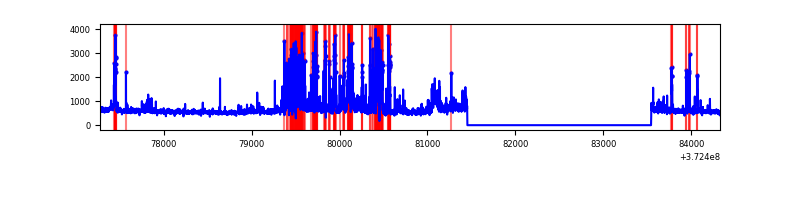 |
| C | 7053 | 4962 | 1539 | 1539 | 21.82% | 31.02% | 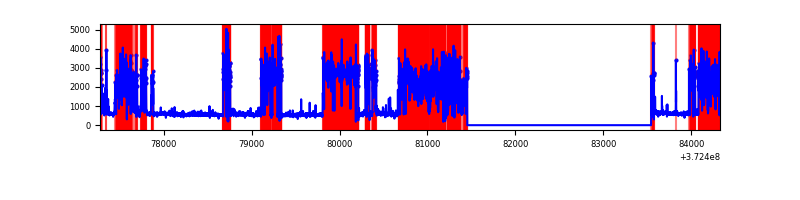 |
| D | 7053 | 4962 | 2331 | 2331 | 33.05% | 46.98% | 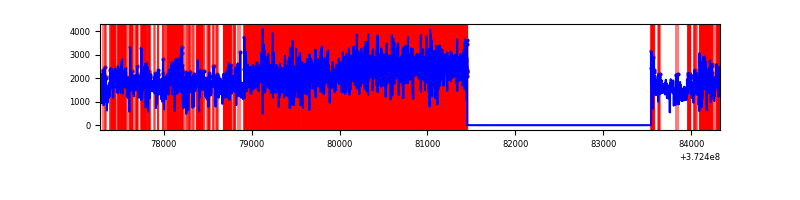 |
Top three noisy pixels from each quadrant. If the there are fewer than three noisy pixels in the level2.evt file, extra rows are filled as -1
| Pixel properties | Quadrant properties | ||||||
|---|---|---|---|---|---|---|---|
| Quadrant | DetID | PixID | Counts | Sigma | Mean | Median | Sigma |
| A | 15 | 237 | 931216 | 7196.56 | 657 | 648 | 129.3 |
| A | 14 | 238 | 75987 | 582.64 | 657 | 648 | 129.3 |
| A | 7 | 16 | 29833 | 225.7 | 657 | 648 | 129.3 |
| B | 5 | 172 | 756076 | 6113.89 | 667 | 654 | 123.6 |
| B | 5 | 200 | 122403 | 985.36 | 667 | 654 | 123.6 |
| B | 0 | 219 | 109332 | 879.57 | 667 | 654 | 123.6 |
| C | 0 | 10 | 4204227 | 32795.41 | 564 | 571 | 128.2 |
| C | 3 | 233 | 130781 | 1015.85 | 564 | 571 | 128.2 |
| C | 0 | 207 | 45018 | 346.76 | 564 | 571 | 128.2 |
| D | 8 | 195 | 5600750 | 36820.61 | 577 | 565 | 152.1 |
| D | 14 | 52 | 848363 | 5574.18 | 577 | 565 | 152.1 |
| D | 10 | 203 | 413309 | 2713.75 | 577 | 565 | 152.1 |
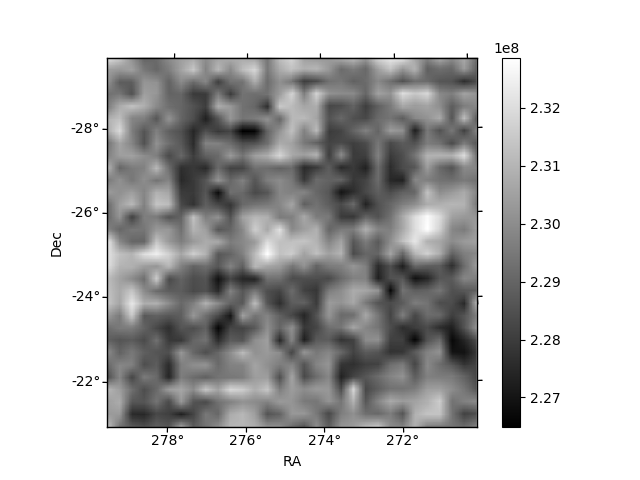
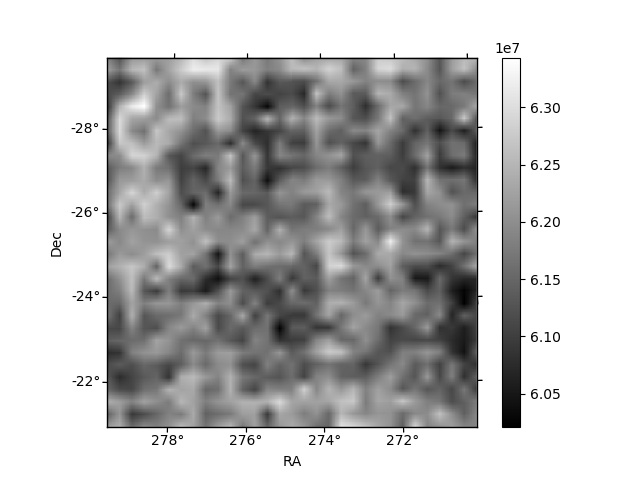
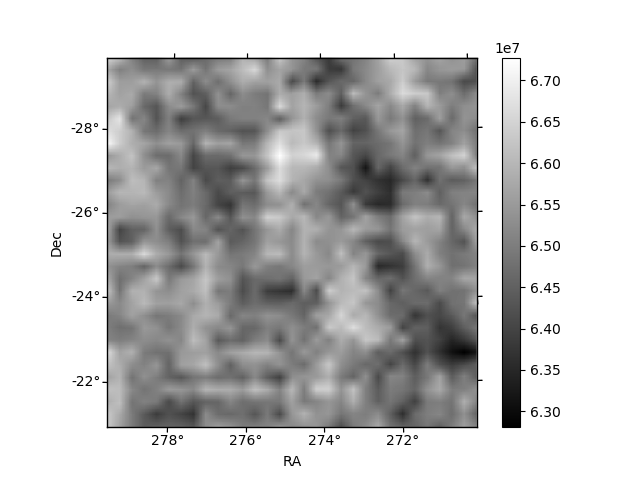
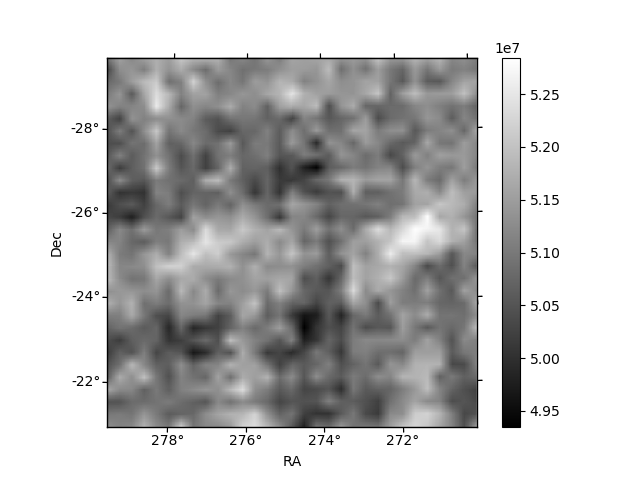
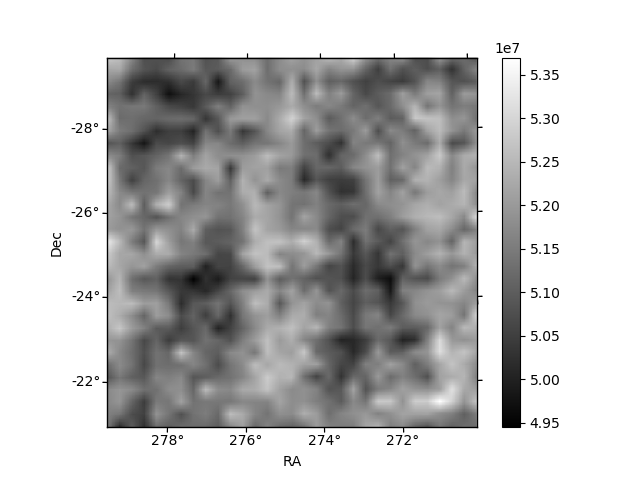
Histogram calculated using DETX and DETY for each event in the final _common_clean file
| Quadrant A | 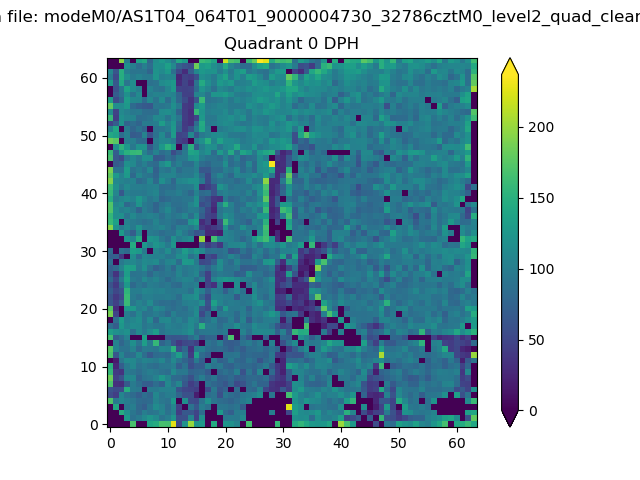 |
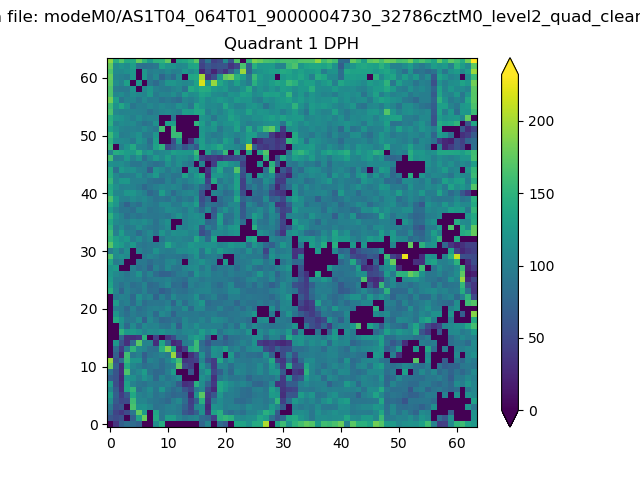 |
Quadrant B |
|---|---|---|---|
| Quadrant D | 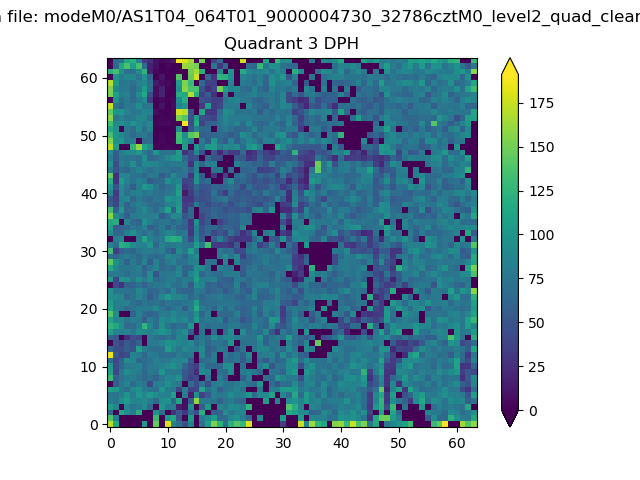 |
 |
Quadrant C |
| Plot type | Count rate plots | Images |
|---|---|---|
| Comparison with Poisson distribution Blue bars denote a histogram of data divided into 1 sec bins. Red curve is a Poisson curve with rate = median count rate of data. |
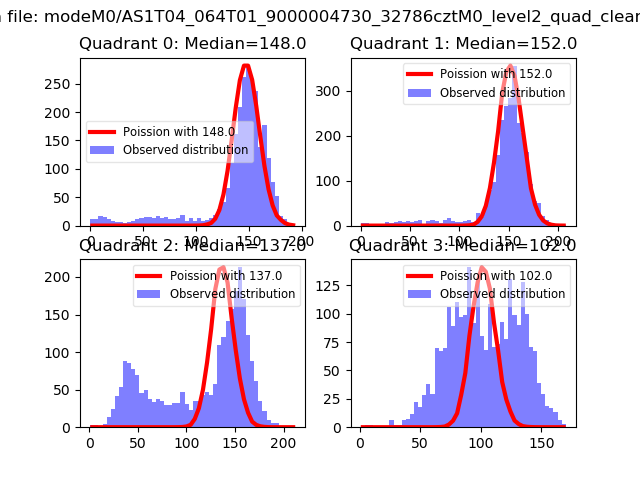 |
 |
| Quadrant-wise count rates Data is divided into 100 sec bins |
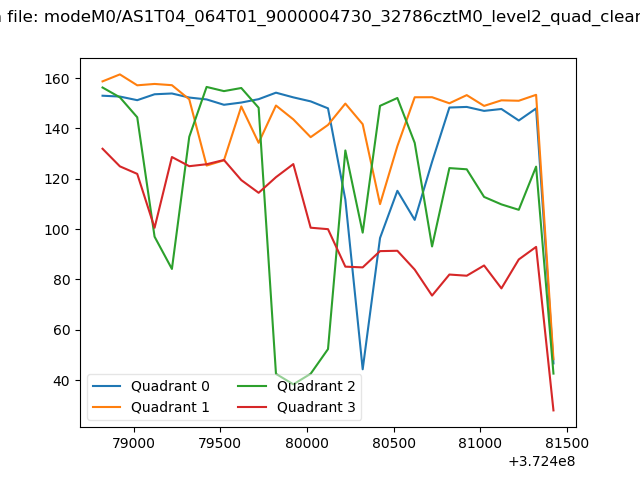 |
|
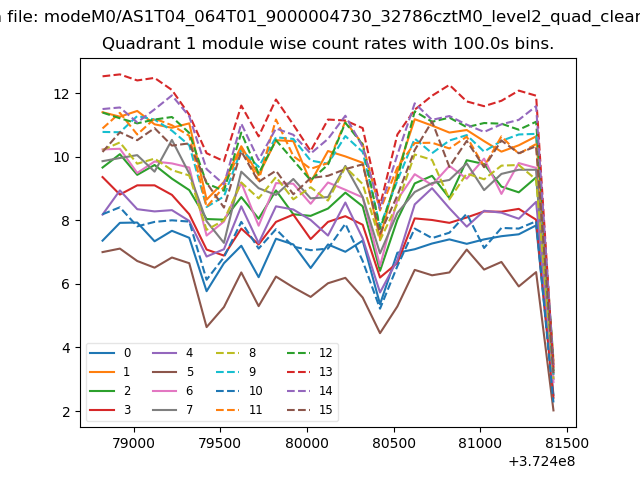
| Module-wise count rates for Quadrant A Data is divided into 100 sec bins |
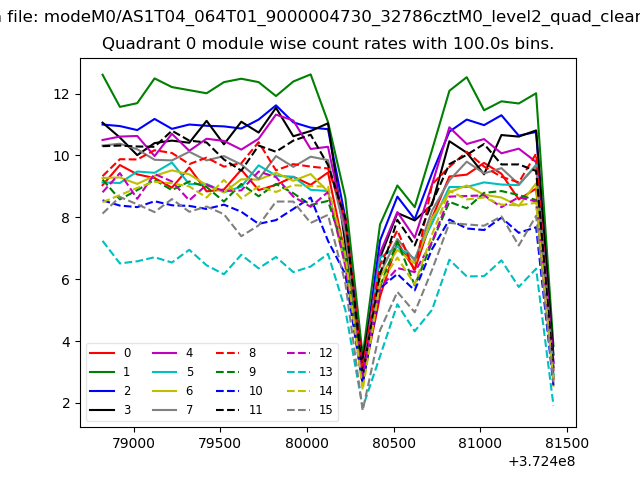 |
 |
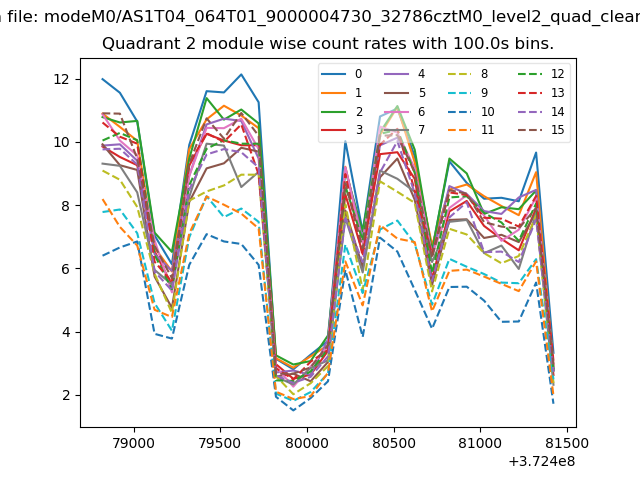
| Module-wise count rates for Quadrant B Data is divided into 100 sec bins |
 |
 |
| Module-wise count rates for Quadrant C Data is divided into 100 sec bins |
 |
 |
| Module-wise count rates for Quadrant D Data is divided into 100 sec bins |
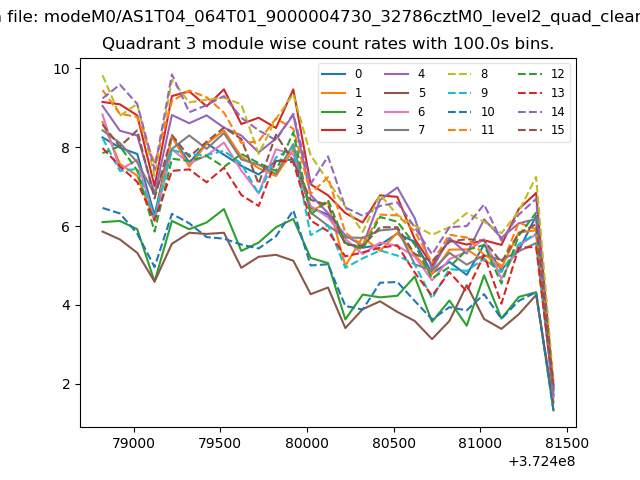 |
 |
| Parameter | Plot |
|---|---|
| CZT HV Monitor | 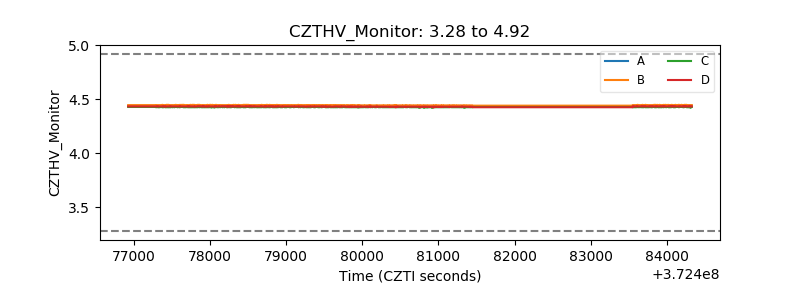 |
| D_VDD | 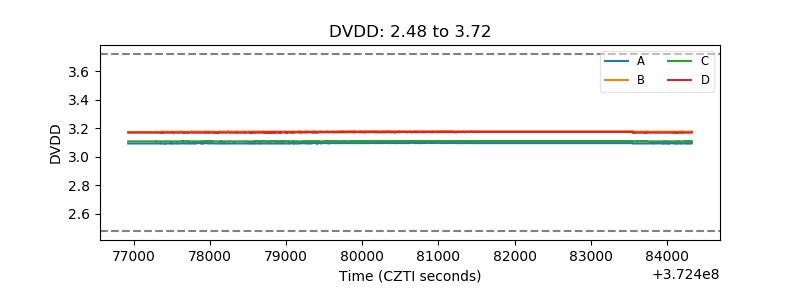 |
| Temperature 1 | 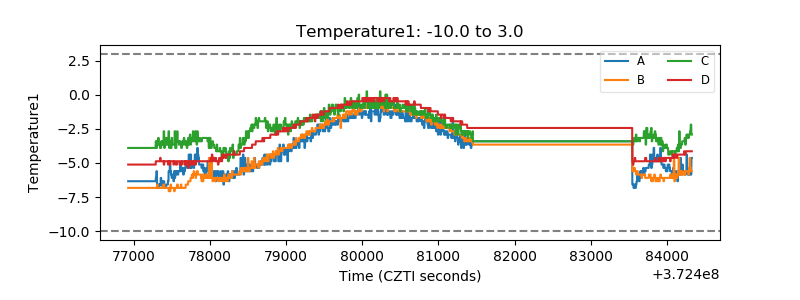 |
| Veto HV Monitor | 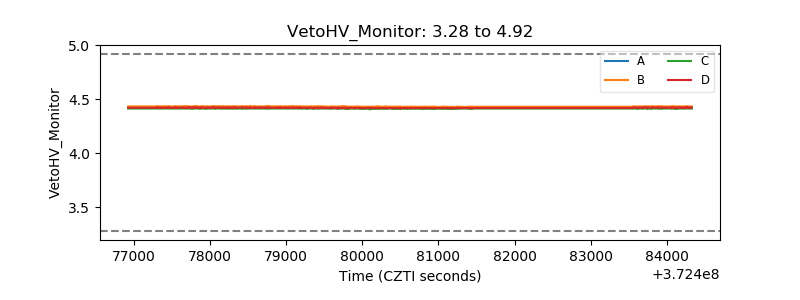 |
| Veto LLD | 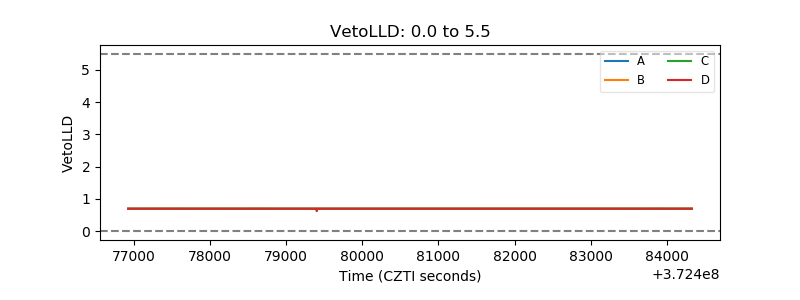 |
| Alpha Counter | 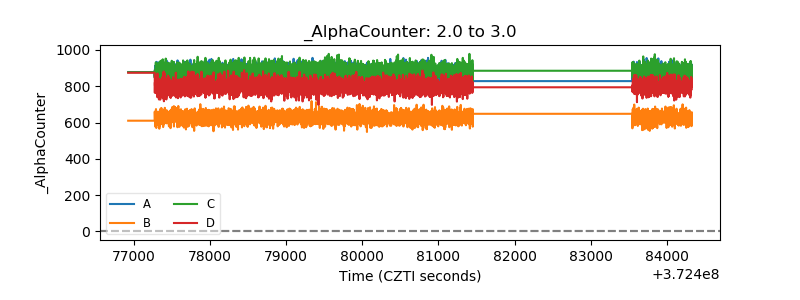 |
| _CPM_Rate | 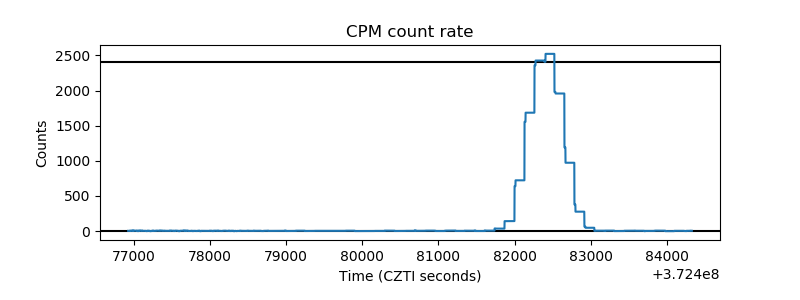 |
| CZT Counter |  |
| +2.5 Volts monitor |  |
| +5 Volts monitor |  |
| _ROLL_ROT | 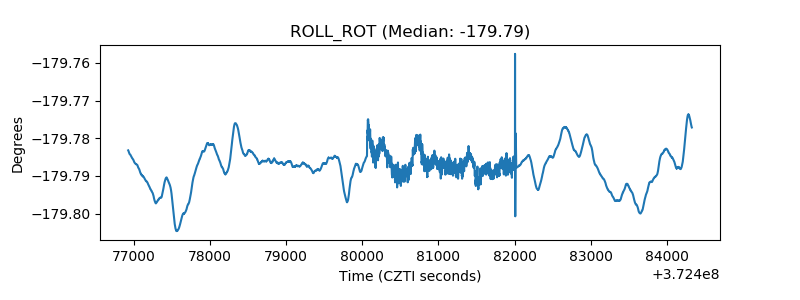 |
| _Roll_DEC | 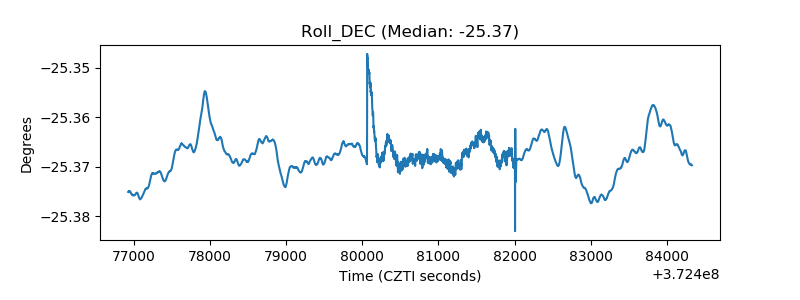 |
| _Roll_RA | 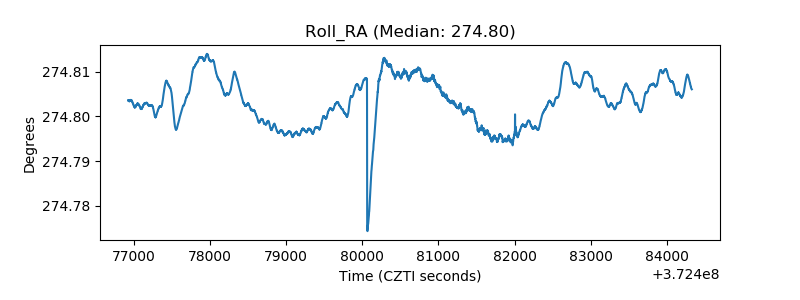 |
| Veto Counter | 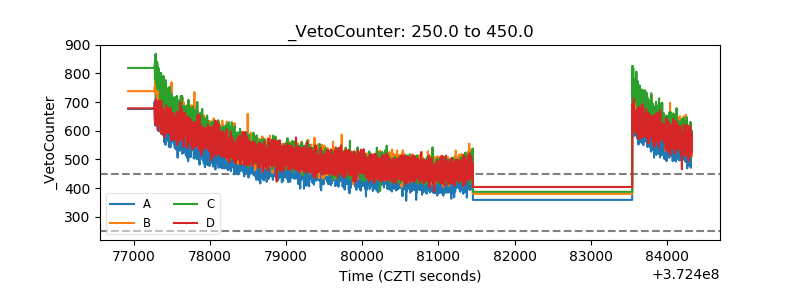 |