| Param | Original file | Final file |
|---|---|---|
| Filename | modeM0/AS1T04_064T01_9000004730_32787cztM0_level2.evt | modeM0/AS1T04_064T01_9000004730_32787cztM0_level2_quad_clean.evt |
| Size (bytes) | 832,432,320 | 63,342,720 |
| Size | 793.9 MB | 60.4 MB |
| Events in quadrant A | 4,081,942 | 428,155 |
| Events in quadrant B | 3,293,055 | 472,880 |
| Events in quadrant C | 7,660,524 | 334,440 |
| Events in quadrant D | 9,844,140 | 335,088 |
| Mode M9 | |||
|---|---|---|---|
| Quadrant | BADHDUFLAG | Total packets | Discarded packets |
| A | 0 | 32 | 0 |
| B | 0 | 32 | 0 |
| C | 0 | 32 | 0 |
| D | 0 | 33 | 0 |
| Mode SS | |||
|---|---|---|---|
| Quadrant | BADHDUFLAG | Total packets | Discarded packets |
| A | 0 | 100 | 0 |
| B | 0 | 100 | 0 |
| C | 0 | 100 | 0 |
| D | 0 | 100 | 0 |
| Mode M0 | |||
|---|---|---|---|
| Quadrant | BADHDUFLAG | Total packets | Discarded packets |
| A | 0 | 15125 | 3 |
| B | 0 | 12845 | 2 |
| C | 0 | 26003 | 2 |
| D | 0 | 32651 | 2 |
| Quadrant | Total seconds | Saturated seconds | Saturation percentage |
|---|---|---|---|
| A | 4922 | 490 | 9.955303% |
| B | 4922 | 101 | 2.052011% |
| C | 4922 | 2168 | 44.047135% |
| D | 4922 | 2771 | 56.298253% |
Noise dominated data is calculated using 1-second bins in cleaned event files. If a bin has >2000 counts, and if more than 50% of those come from <1% of pixels, then it is considered to be noise-dominated and hence unusable.
| Quadrant | # 1 sec bins | Bins with >0 counts | Bins with >2000 counts | High rate bins dominated by noise | Noise dominated (total time) | Noise dominated (detector-on time) | Marked lightcurve |
|---|---|---|---|---|---|---|---|
| A | 7045 | 4923 | 337 | 337 | 4.78% | 6.85% | 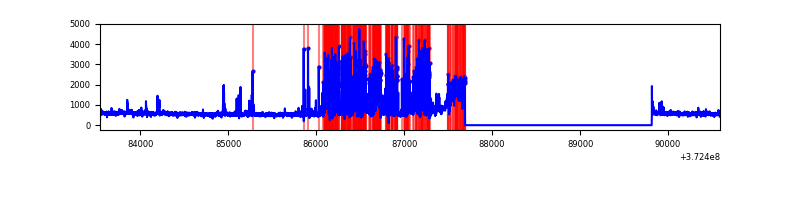 |
| B | 7045 | 4923 | 56 | 56 | 0.79% | 1.14% | 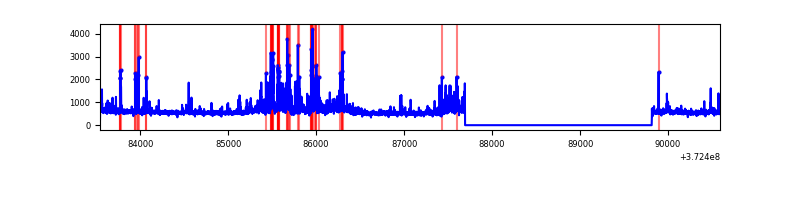 |
| C | 7045 | 4922 | 2003 | 2003 | 28.43% | 40.69% | 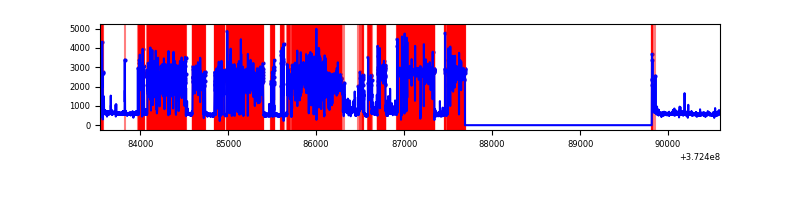 |
| D | 7045 | 4923 | 2705 | 2705 | 38.40% | 54.95% | 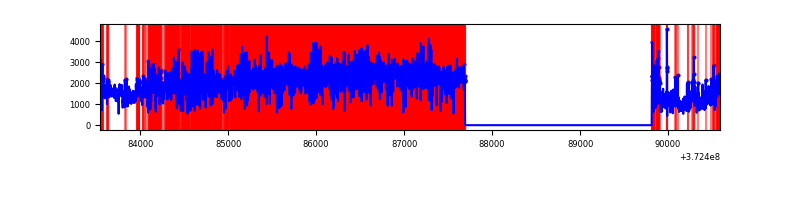 |
Top three noisy pixels from each quadrant. If the there are fewer than three noisy pixels in the level2.evt file, extra rows are filled as -1
| Pixel properties | Quadrant properties | ||||||
|---|---|---|---|---|---|---|---|
| Quadrant | DetID | PixID | Counts | Sigma | Mean | Median | Sigma |
| A | 15 | 237 | 1477176 | 11487.8 | 641 | 631 | 128.5 |
| A | 14 | 238 | 50965 | 391.61 | 641 | 631 | 128.5 |
| A | 9 | 191 | 13146 | 97.37 | 641 | 631 | 128.5 |
| B | 5 | 172 | 323953 | 2622.2 | 663 | 651 | 123.3 |
| B | 0 | 219 | 254799 | 2061.31 | 663 | 651 | 123.3 |
| B | 5 | 200 | 36271 | 288.9 | 663 | 651 | 123.3 |
| C | 0 | 10 | 5156150 | 43078.96 | 523 | 530 | 119.7 |
| C | 3 | 233 | 388227 | 3239.49 | 523 | 530 | 119.7 |
| C | 4 | 254 | 25223 | 206.33 | 523 | 530 | 119.7 |
| D | 8 | 195 | 5582969 | 38278.68 | 560 | 549 | 145.8 |
| D | 12 | 227 | 542841 | 3718.5 | 560 | 549 | 145.8 |
| D | 2 | 250 | 523961 | 3589.04 | 560 | 549 | 145.8 |
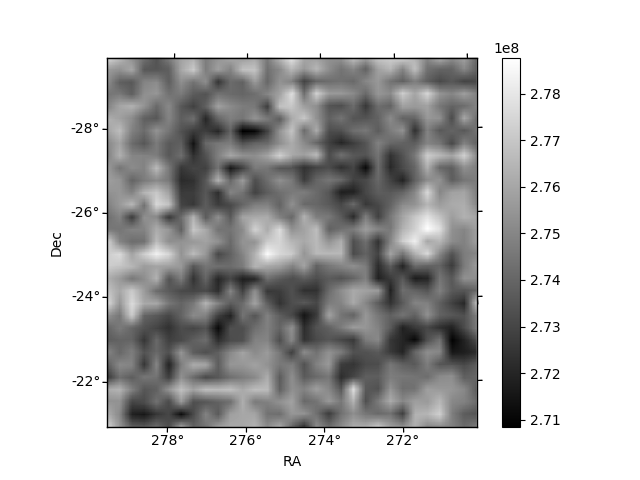
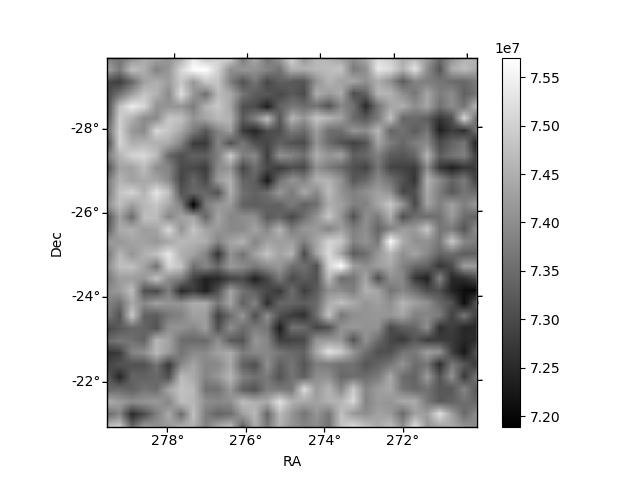
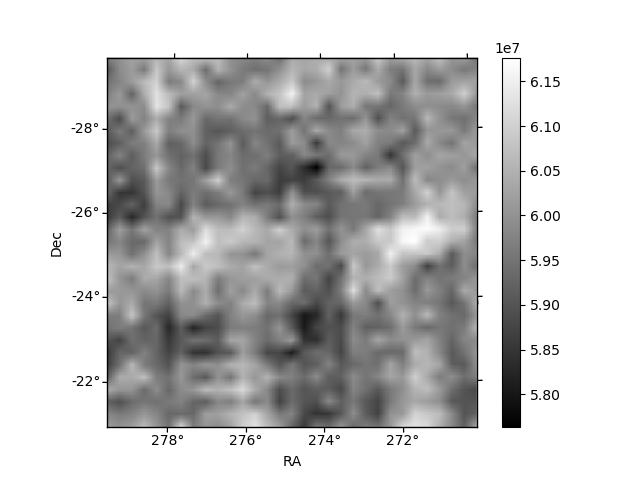
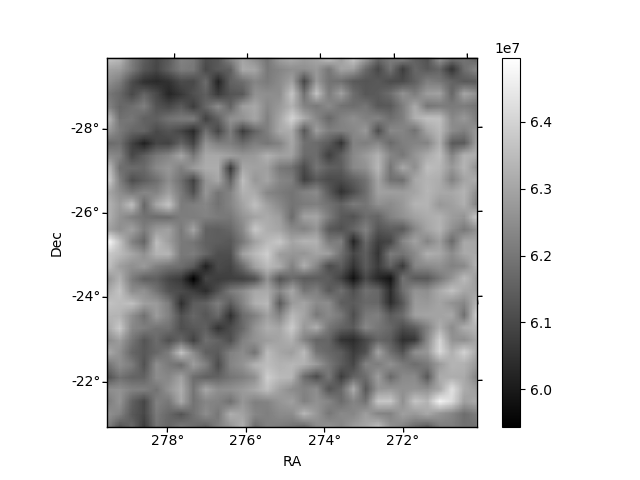
Histogram calculated using DETX and DETY for each event in the final _common_clean file
| Quadrant A | 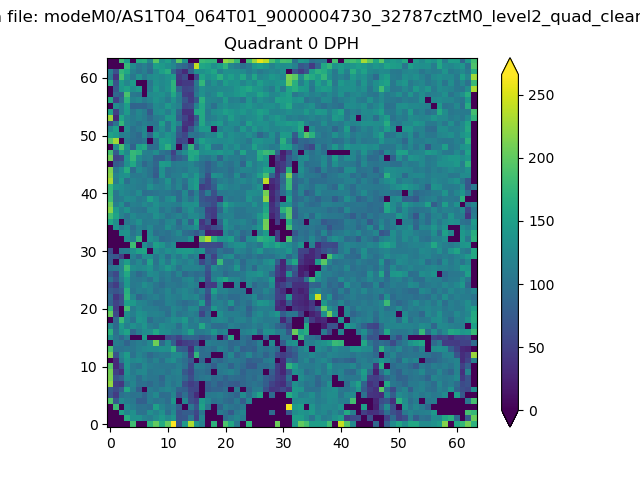 |
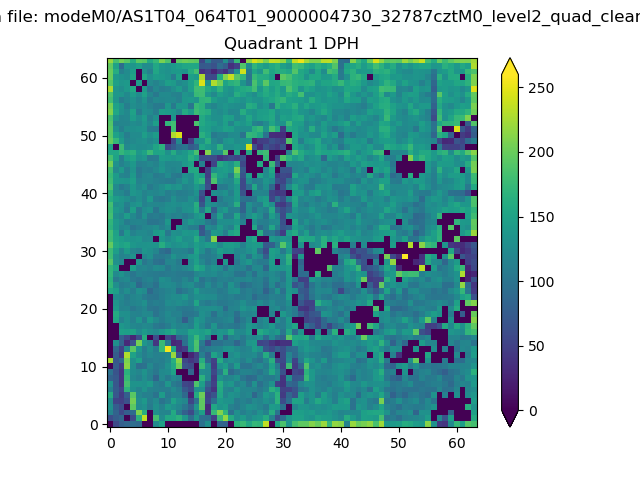 |
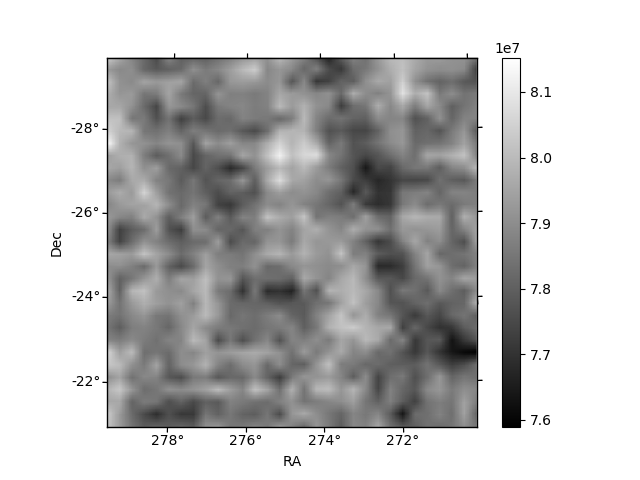
Quadrant B |
|---|---|---|---|
| Quadrant D | 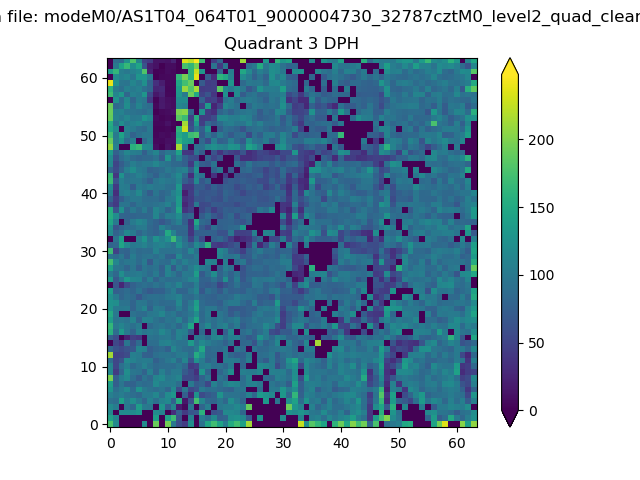 |
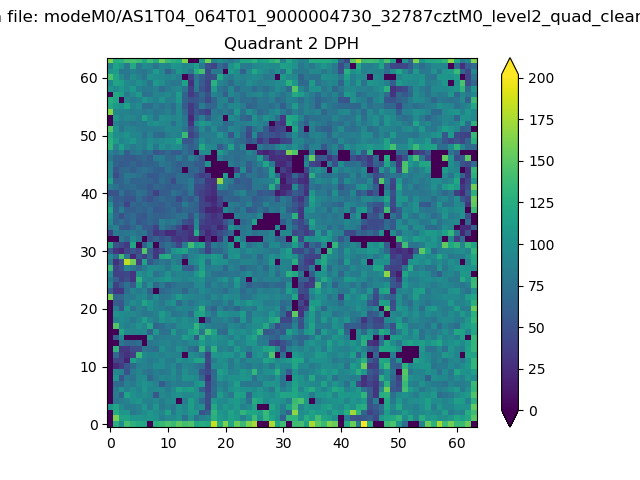 |
Quadrant C |
| Plot type | Count rate plots | Images |
|---|---|---|
| Comparison with Poisson distribution Blue bars denote a histogram of data divided into 1 sec bins. Red curve is a Poisson curve with rate = median count rate of data. |
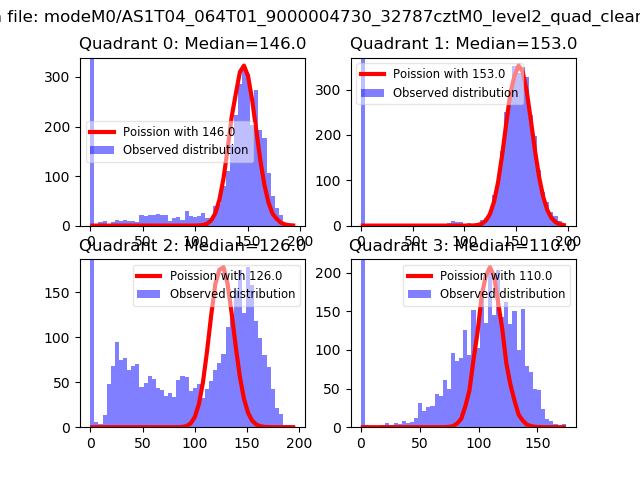 |
 |
| Quadrant-wise count rates Data is divided into 100 sec bins |
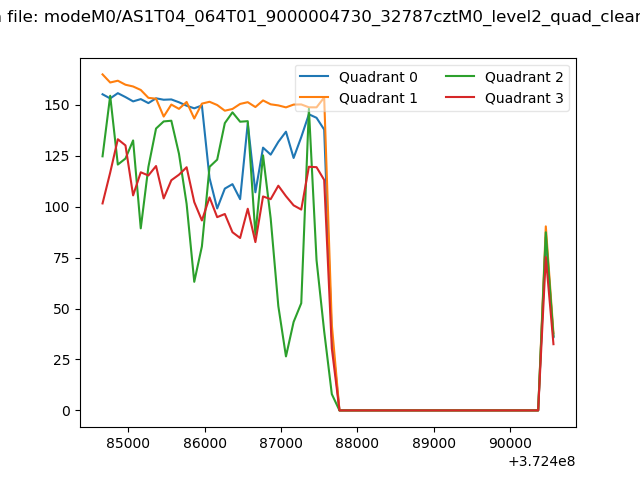 |
|
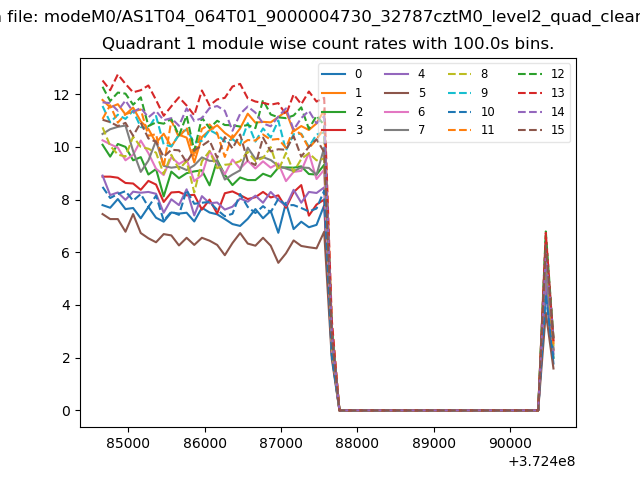
| Module-wise count rates for Quadrant A Data is divided into 100 sec bins |
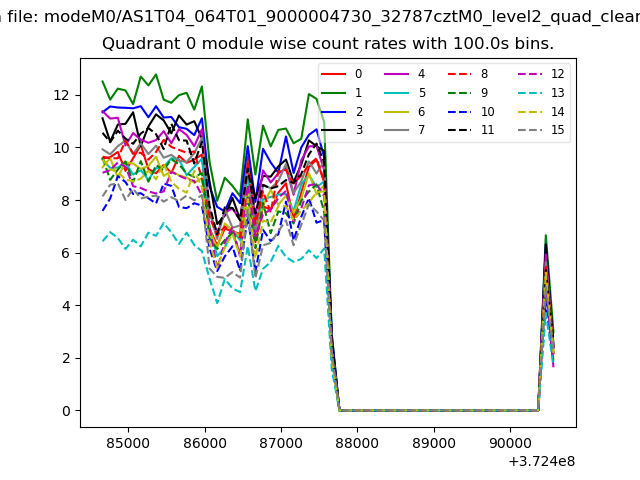 |
 |
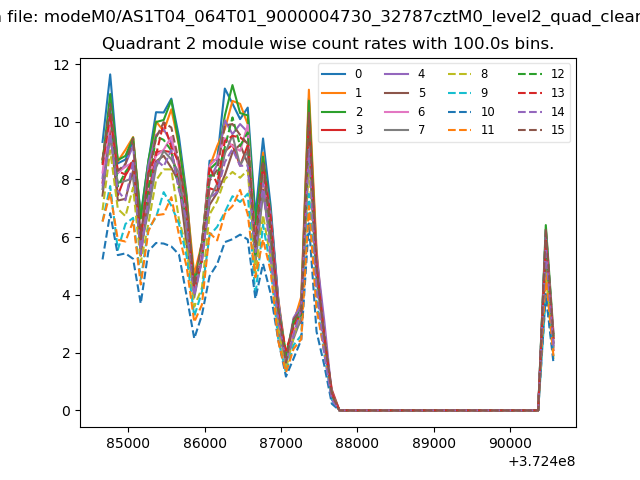
| Module-wise count rates for Quadrant B Data is divided into 100 sec bins |
 |
 |
| Module-wise count rates for Quadrant C Data is divided into 100 sec bins |
 |
 |
| Module-wise count rates for Quadrant D Data is divided into 100 sec bins |
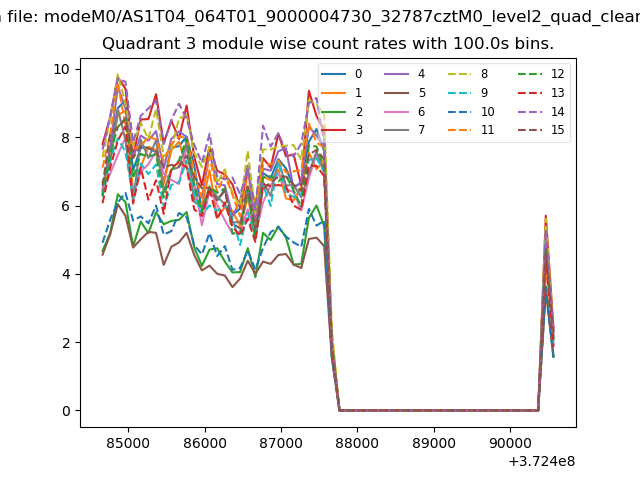 |
 |
| Parameter | Plot |
|---|---|
| CZT HV Monitor | 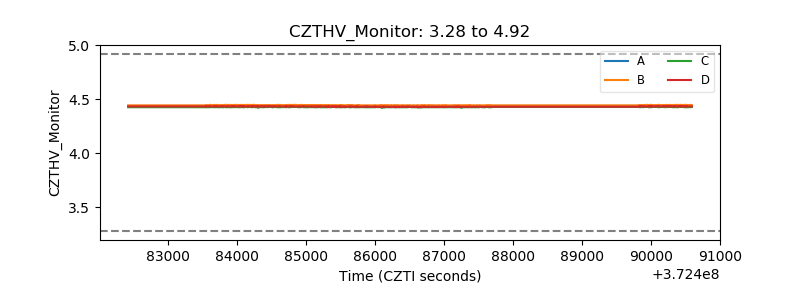 |
| D_VDD | 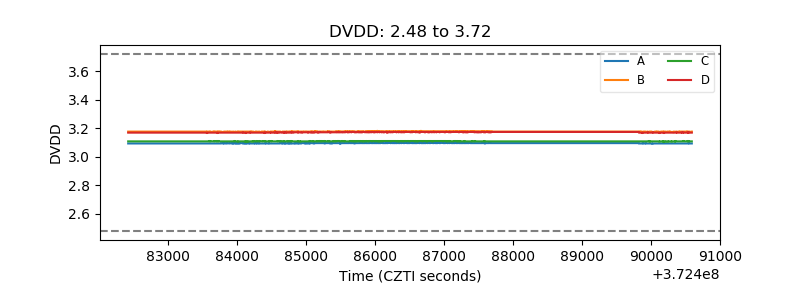 |
| Temperature 1 | 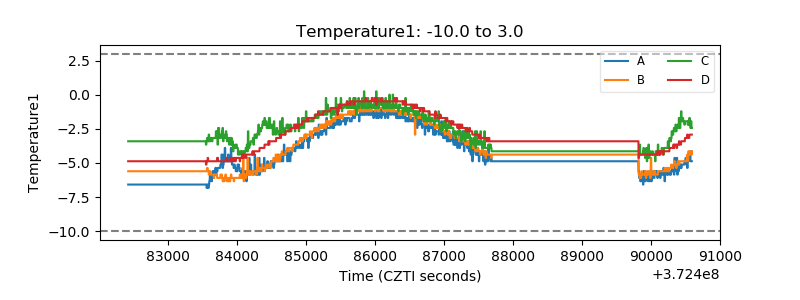 |
| Veto HV Monitor | 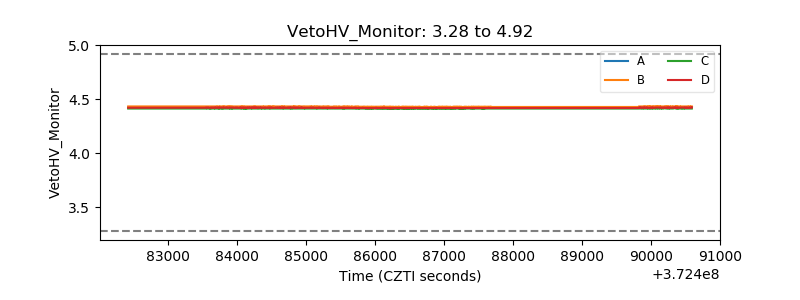 |
| Veto LLD | 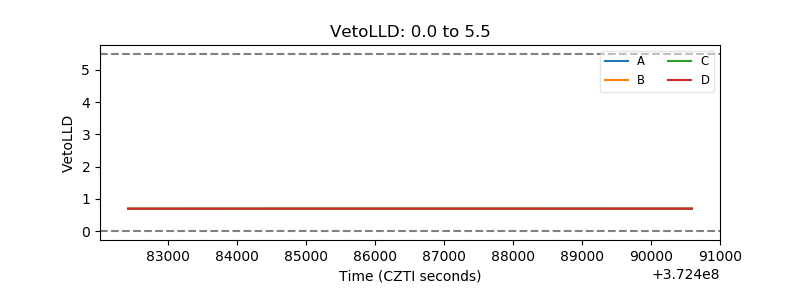 |
| Alpha Counter | 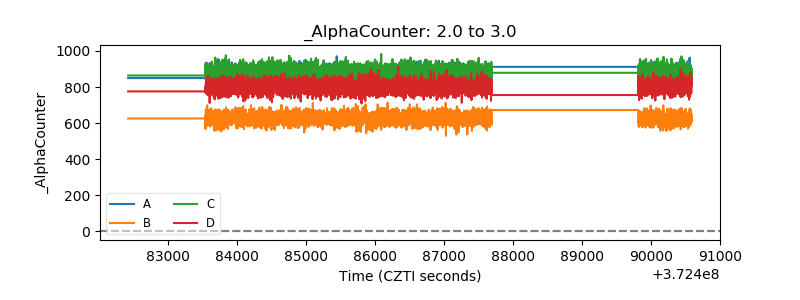 |
| _CPM_Rate | 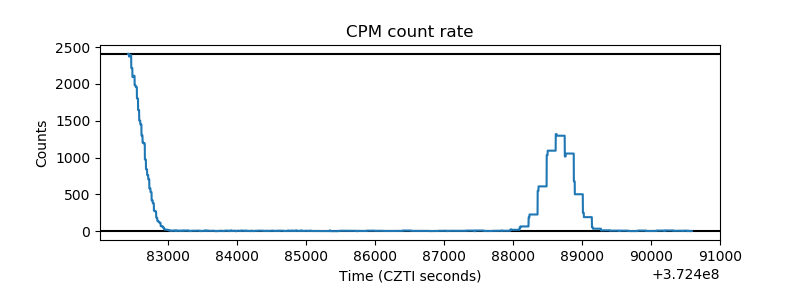 |
| CZT Counter | 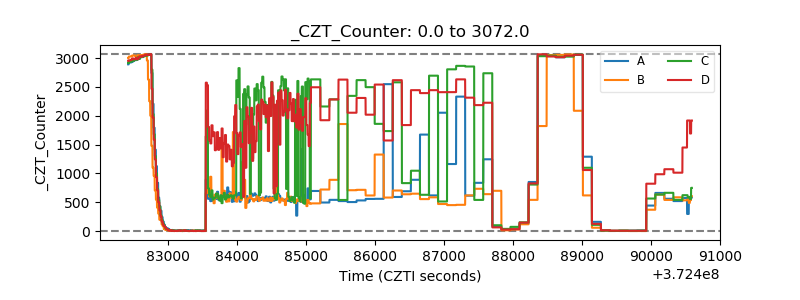 |
| +2.5 Volts monitor |  |
| +5 Volts monitor |  |
| _ROLL_ROT | 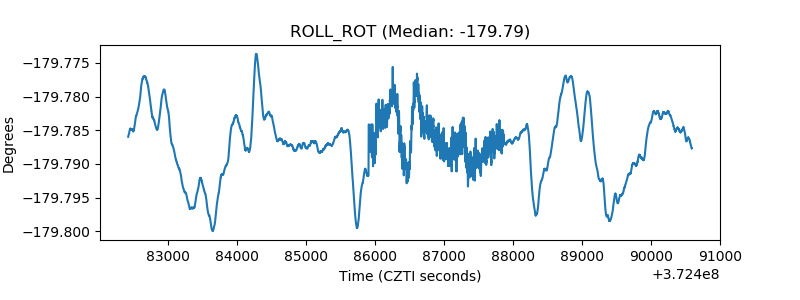 |
| _Roll_DEC | 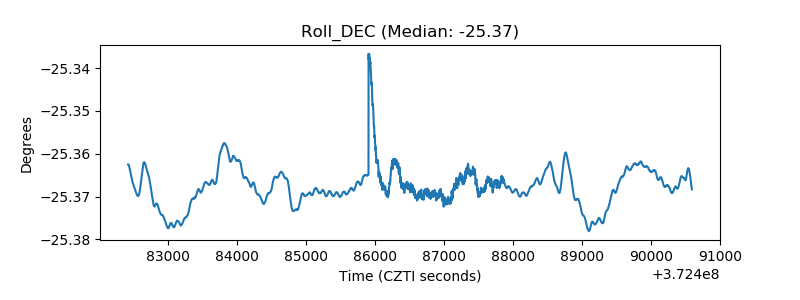 |
| _Roll_RA | 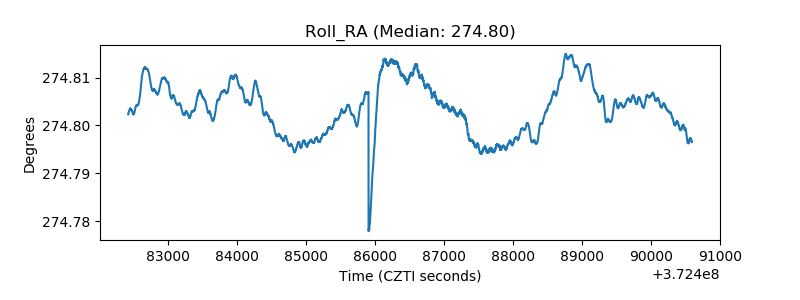 |
| Veto Counter | 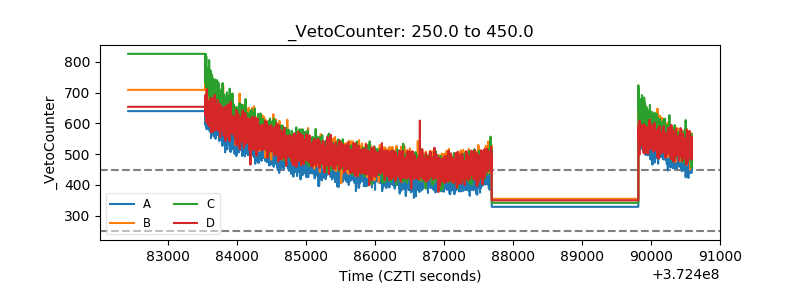 |