| Param | Original file | Final file |
|---|---|---|
| Filename | modeM0/AS1T04_064T01_9000004730_32788cztM0_level2.evt | modeM0/AS1T04_064T01_9000004730_32788cztM0_level2_quad_clean.evt |
| Size (bytes) | 595,036,800 | 84,421,440 |
| Size | 567.5 MB | 80.5 MB |
| Events in quadrant A | 3,806,329 | 545,744 |
| Events in quadrant B | 3,738,389 | 571,192 |
| Events in quadrant C | 3,746,739 | 562,963 |
| Events in quadrant D | 6,392,977 | 526,788 |
| Mode M9 | |||
|---|---|---|---|
| Quadrant | BADHDUFLAG | Total packets | Discarded packets |
| A | 0 | 35 | 0 |
| B | 0 | 35 | 0 |
| C | 0 | 35 | 0 |
| D | 0 | 36 | 0 |
| Mode SS | |||
|---|---|---|---|
| Quadrant | BADHDUFLAG | Total packets | Discarded packets |
| A | 0 | 102 | 0 |
| B | 0 | 102 | 0 |
| C | 0 | 102 | 0 |
| D | 0 | 102 | 0 |
| Mode M0 | |||
|---|---|---|---|
| Quadrant | BADHDUFLAG | Total packets | Discarded packets |
| A | 0 | 14201 | 3 |
| B | 0 | 14224 | 2 |
| C | 0 | 14182 | 2 |
| D | 0 | 22464 | 2 |
| Quadrant | Total seconds | Saturated seconds | Saturation percentage |
|---|---|---|---|
| A | 4982 | 433 | 8.691289% |
| B | 4982 | 327 | 6.563629% |
| C | 4982 | 315 | 6.322762% |
| D | 4982 | 454 | 9.112806% |
Noise dominated data is calculated using 1-second bins in cleaned event files. If a bin has >2000 counts, and if more than 50% of those come from <1% of pixels, then it is considered to be noise-dominated and hence unusable.
| Quadrant | # 1 sec bins | Bins with >0 counts | Bins with >2000 counts | High rate bins dominated by noise | Noise dominated (total time) | Noise dominated (detector-on time) | Marked lightcurve |
|---|---|---|---|---|---|---|---|
| A | 7075 | 4983 | 272 | 272 | 3.84% | 5.46% | 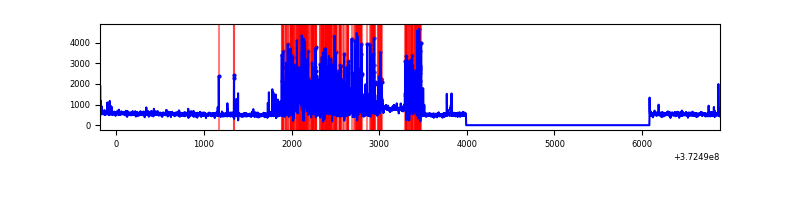 |
| B | 7075 | 4983 | 156 | 156 | 2.20% | 3.13% | 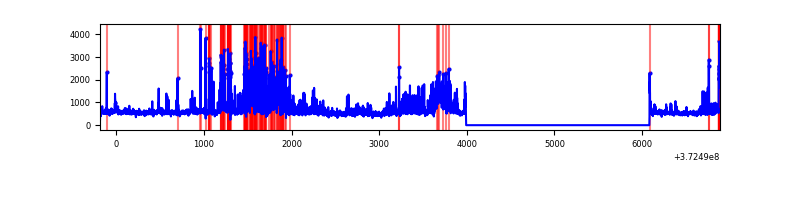 |
| C | 7075 | 4983 | 281 | 281 | 3.97% | 5.64% | 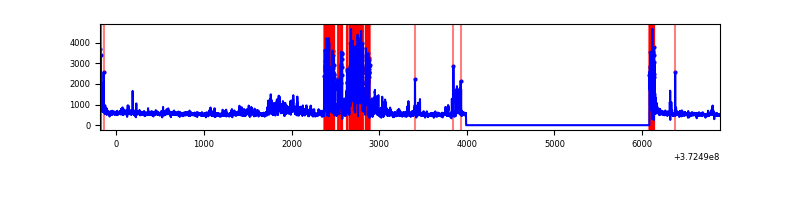 |
| D | 7075 | 4983 | 348 | 348 | 4.92% | 6.98% | 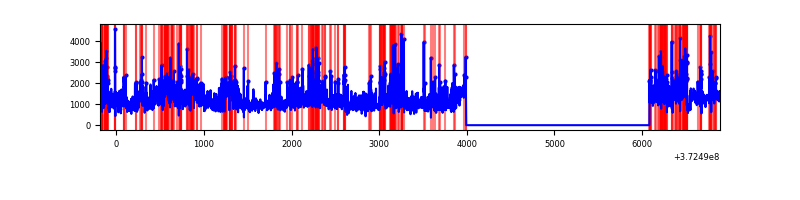 |
Top three noisy pixels from each quadrant. If the there are fewer than three noisy pixels in the level2.evt file, extra rows are filled as -1
| Pixel properties | Quadrant properties | ||||||
|---|---|---|---|---|---|---|---|
| Quadrant | DetID | PixID | Counts | Sigma | Mean | Median | Sigma |
| A | 15 | 237 | 1184898 | 9550.34 | 621 | 612 | 124.0 |
| A | 14 | 238 | 122043 | 979.25 | 621 | 612 | 124.0 |
| A | 7 | 16 | 30774 | 243.23 | 621 | 612 | 124.0 |
| B | 0 | 219 | 638293 | 5346.87 | 629 | 616 | 119.3 |
| B | 5 | 172 | 449526 | 3764.07 | 629 | 616 | 119.3 |
| B | 5 | 200 | 57679 | 478.47 | 629 | 616 | 119.3 |
| C | 0 | 10 | 962244 | 6892.25 | 604 | 610 | 139.5 |
| C | 3 | 233 | 369482 | 2643.79 | 604 | 610 | 139.5 |
| C | 4 | 254 | 14935 | 102.67 | 604 | 610 | 139.5 |
| D | 8 | 195 | 1768975 | 11402.75 | 606 | 593 | 155.1 |
| D | 10 | 203 | 629229 | 4053.53 | 606 | 593 | 155.1 |
| D | 2 | 250 | 340899 | 2194.34 | 606 | 593 | 155.1 |
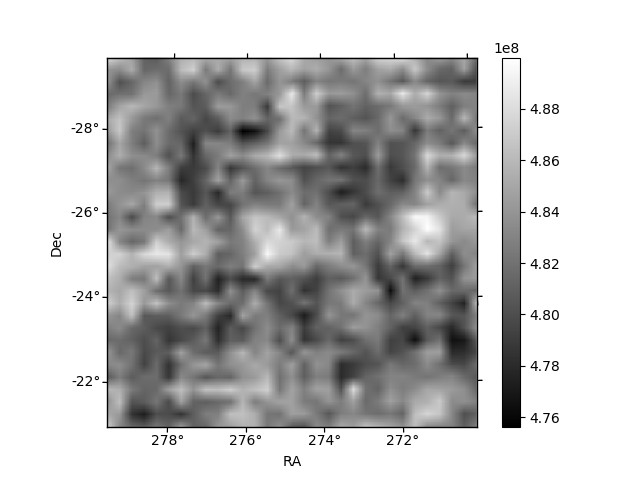
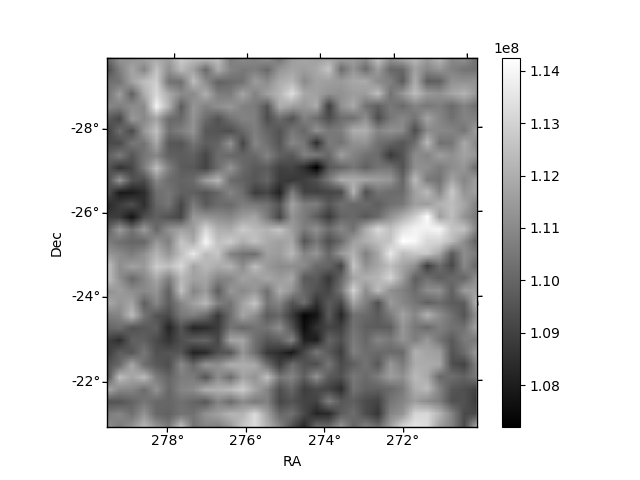
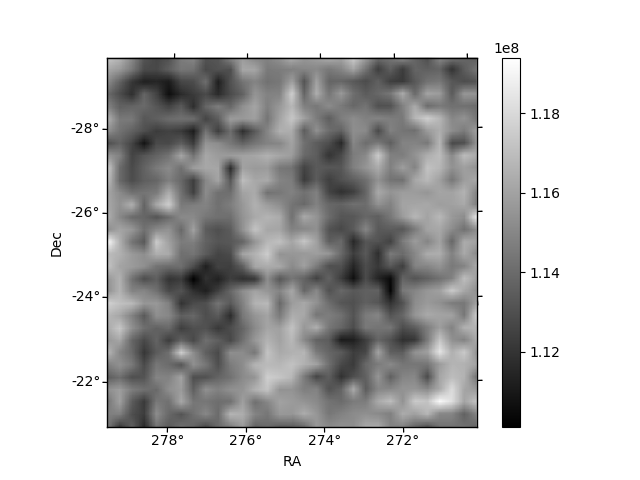
Histogram calculated using DETX and DETY for each event in the final _common_clean file
| Quadrant A | 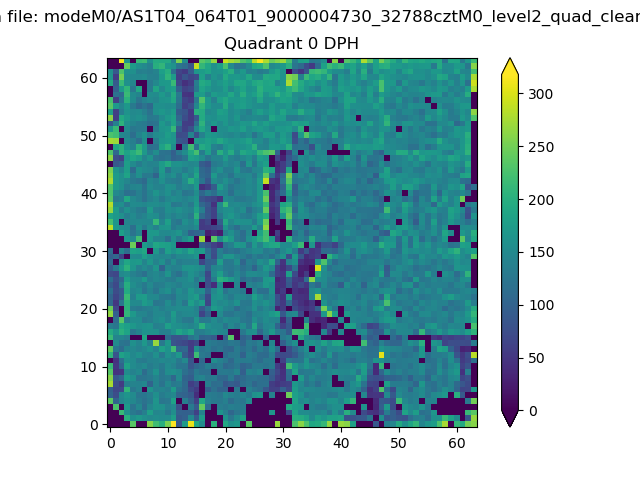 |
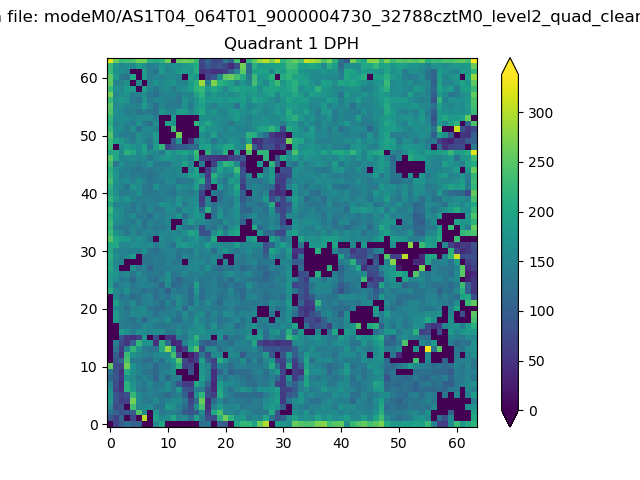 |
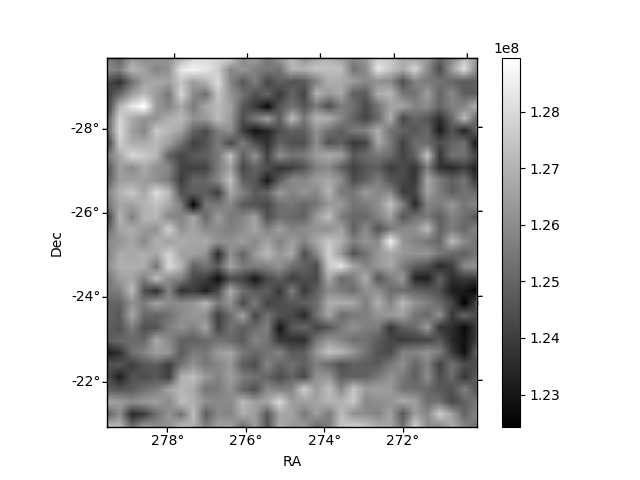
Quadrant B |
|---|---|---|---|
| Quadrant D |  |
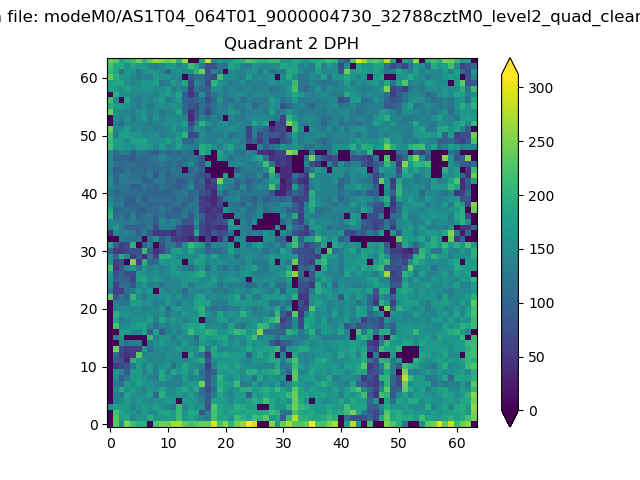 |
Quadrant C |
| Plot type | Count rate plots | Images |
|---|---|---|
| Comparison with Poisson distribution Blue bars denote a histogram of data divided into 1 sec bins. Red curve is a Poisson curve with rate = median count rate of data. |
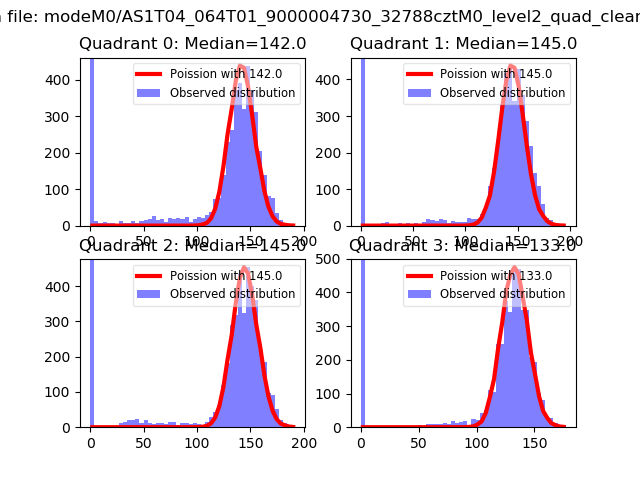 |
 |
| Quadrant-wise count rates Data is divided into 100 sec bins |
 |
|
| Module-wise count rates for Quadrant A Data is divided into 100 sec bins |
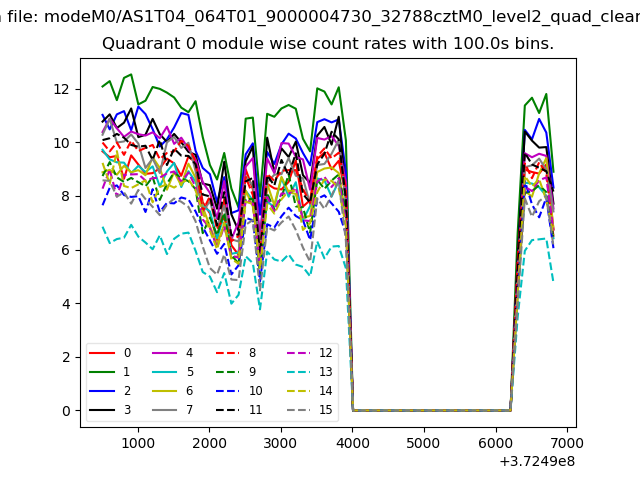 |
 |
| Module-wise count rates for Quadrant B Data is divided into 100 sec bins |
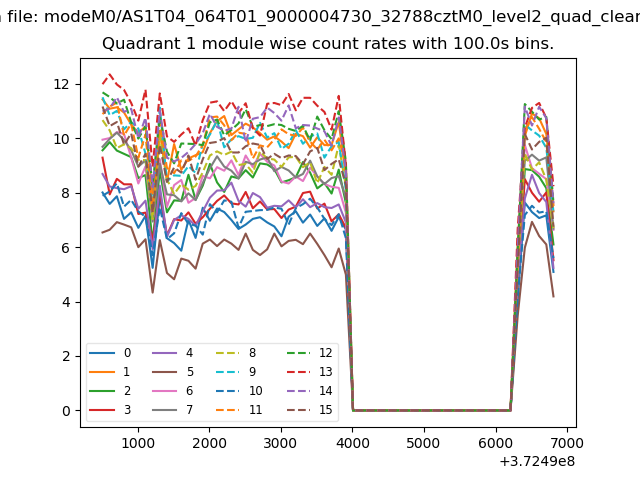 |
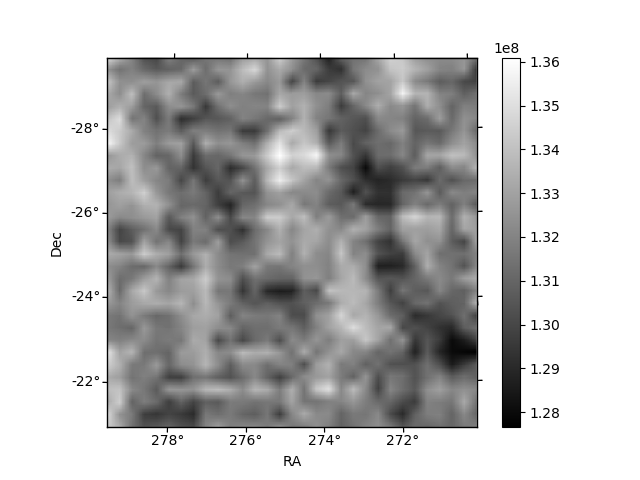 |
| Module-wise count rates for Quadrant C Data is divided into 100 sec bins |
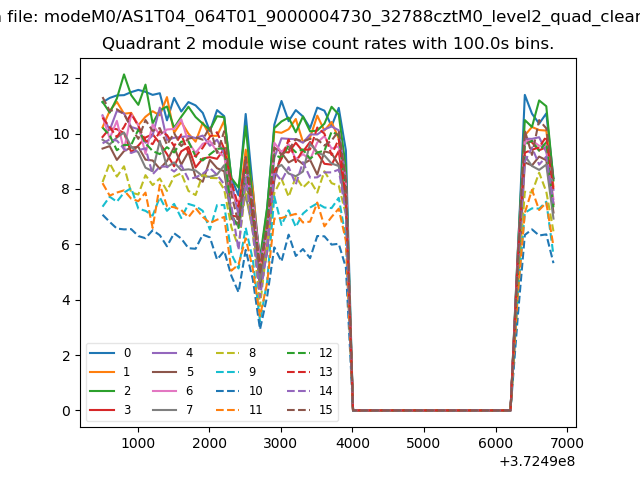 |
 |
| Module-wise count rates for Quadrant D Data is divided into 100 sec bins |
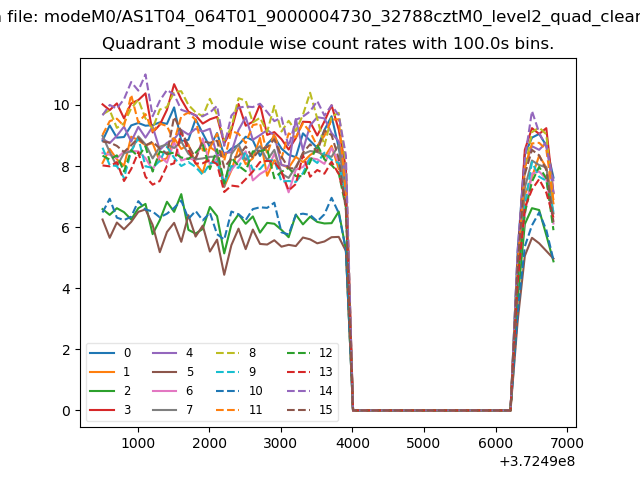 |
 |
| Parameter | Plot |
|---|---|
| CZT HV Monitor | 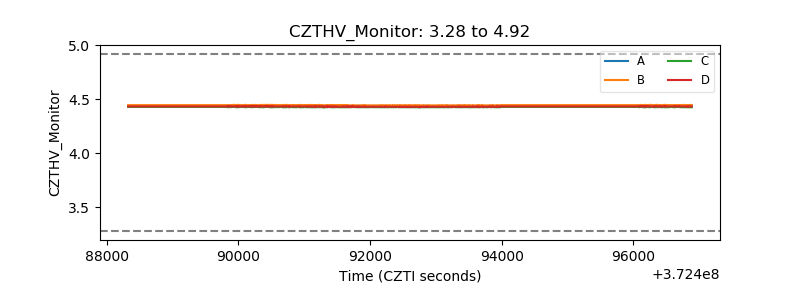 |
| D_VDD |  |
| Temperature 1 | 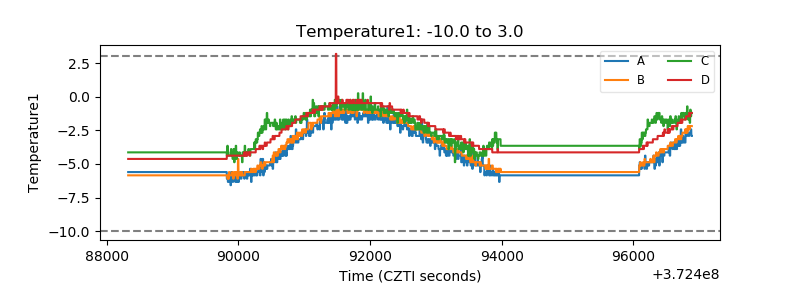 |
| Veto HV Monitor | 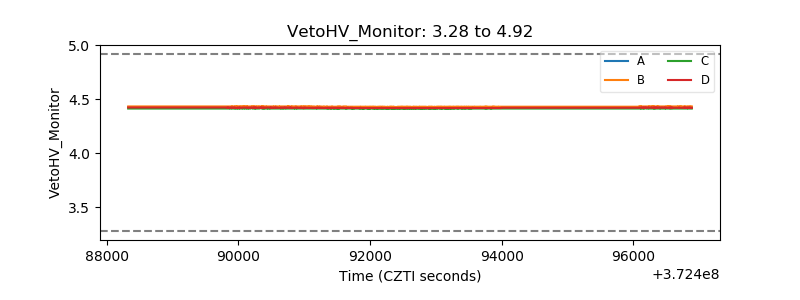 |
| Veto LLD | 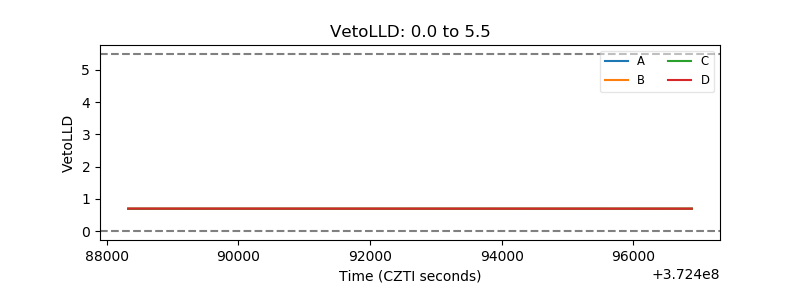 |
| Alpha Counter | 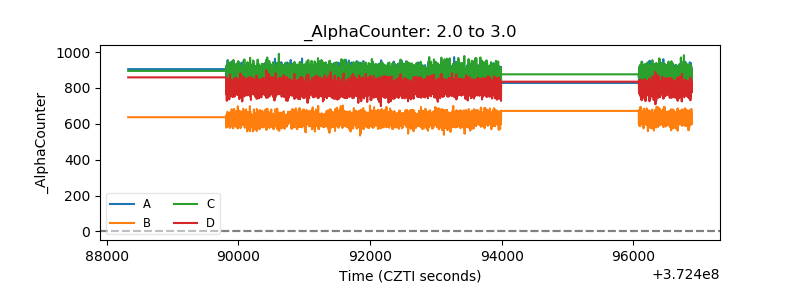 |
| _CPM_Rate | 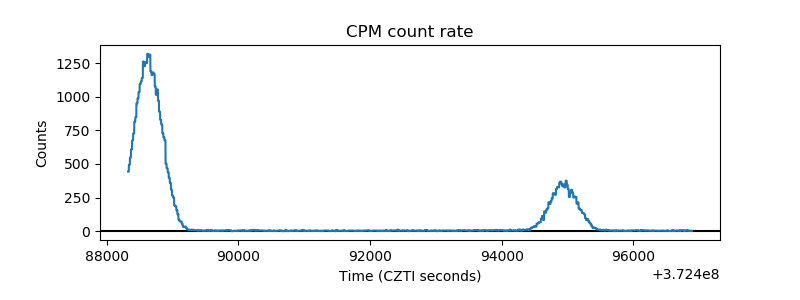 |
| CZT Counter |  |
| +2.5 Volts monitor |  |
| +5 Volts monitor |  |
| _ROLL_ROT | 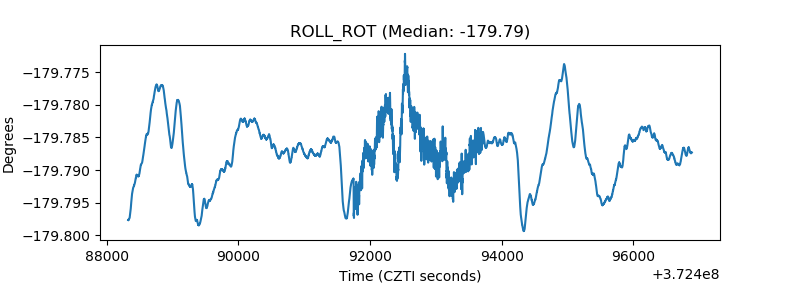 |
| _Roll_DEC | 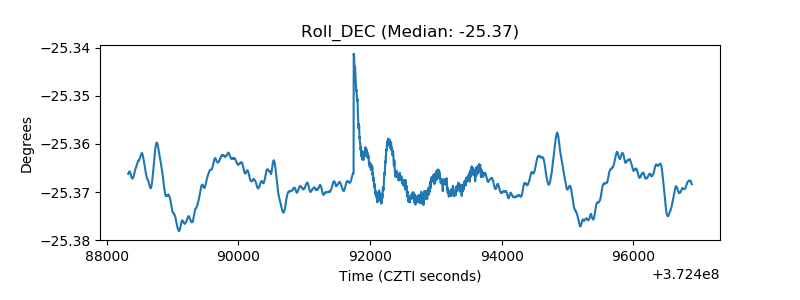 |
| _Roll_RA |  |
| Veto Counter | 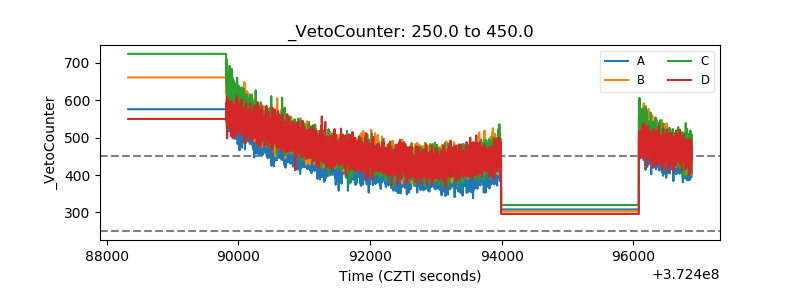 |