| Param | Original file | Final file |
|---|---|---|
| Filename | modeM0/AS1T04_064T01_9000004730_32789cztM0_level2.evt | modeM0/AS1T04_064T01_9000004730_32789cztM0_level2_quad_clean.evt |
| Size (bytes) | 625,792,320 | 87,071,040 |
| Size | 596.8 MB | 83.0 MB |
| Events in quadrant A | 3,896,926 | 563,465 |
| Events in quadrant B | 3,788,044 | 592,073 |
| Events in quadrant C | 3,096,632 | 600,850 |
| Events in quadrant D | 7,822,050 | 517,643 |
| Mode M9 | |||
|---|---|---|---|
| Quadrant | BADHDUFLAG | Total packets | Discarded packets |
| A | 0 | 30 | 0 |
| B | 0 | 30 | 0 |
| C | 0 | 30 | 0 |
| D | 0 | 31 | 0 |
| Mode SS | |||
|---|---|---|---|
| Quadrant | BADHDUFLAG | Total packets | Discarded packets |
| A | 0 | 106 | 0 |
| B | 0 | 106 | 0 |
| C | 0 | 106 | 0 |
| D | 0 | 106 | 0 |
| Mode M0 | |||
|---|---|---|---|
| Quadrant | BADHDUFLAG | Total packets | Discarded packets |
| A | 0 | 14649 | 3 |
| B | 0 | 14520 | 2 |
| C | 0 | 12353 | 2 |
| D | 0 | 26837 | 2 |
| Quadrant | Total seconds | Saturated seconds | Saturation percentage |
|---|---|---|---|
| A | 5167 | 476 | 9.212309% |
| B | 5167 | 253 | 4.896458% |
| C | 5167 | 66 | 1.277337% |
| D | 5167 | 852 | 16.489259% |
Noise dominated data is calculated using 1-second bins in cleaned event files. If a bin has >2000 counts, and if more than 50% of those come from <1% of pixels, then it is considered to be noise-dominated and hence unusable.
| Quadrant | # 1 sec bins | Bins with >0 counts | Bins with >2000 counts | High rate bins dominated by noise | Noise dominated (total time) | Noise dominated (detector-on time) | Marked lightcurve |
|---|---|---|---|---|---|---|---|
| A | 7049 | 5168 | 314 | 314 | 4.45% | 6.08% | 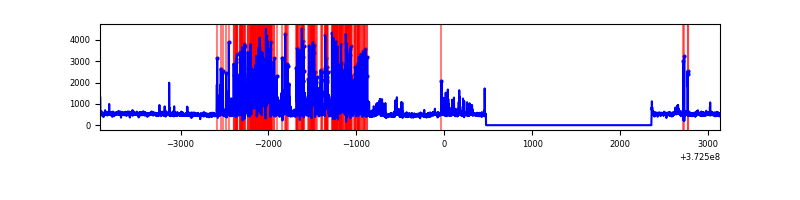 |
| B | 7049 | 5168 | 125 | 125 | 1.77% | 2.42% | 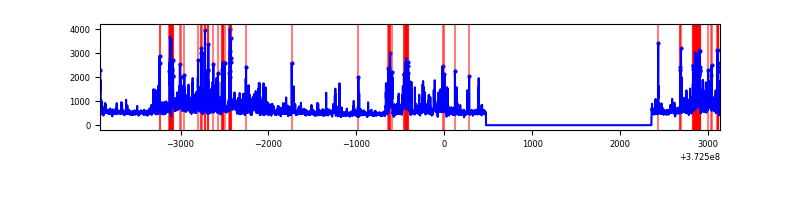 |
| C | 7049 | 5168 | 47 | 47 | 0.67% | 0.91% |  |
| D | 7049 | 5168 | 780 | 780 | 11.07% | 15.09% | 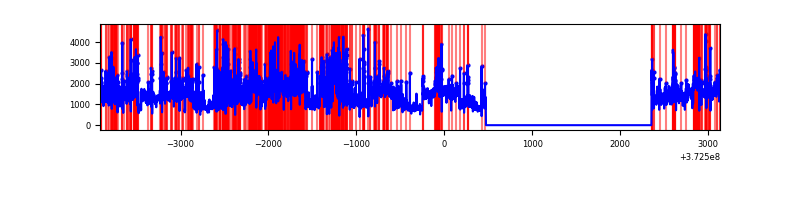 |
Top three noisy pixels from each quadrant. If the there are fewer than three noisy pixels in the level2.evt file, extra rows are filled as -1
| Pixel properties | Quadrant properties | ||||||
|---|---|---|---|---|---|---|---|
| Quadrant | DetID | PixID | Counts | Sigma | Mean | Median | Sigma |
| A | 15 | 237 | 1354693 | 10962.24 | 610 | 601 | 123.5 |
| A | 14 | 238 | 71374 | 572.95 | 610 | 601 | 123.5 |
| A | 7 | 16 | 49866 | 398.83 | 610 | 601 | 123.5 |
| B | 0 | 219 | 585634 | 4906.68 | 624 | 612 | 119.2 |
| B | 5 | 172 | 441913 | 3701.27 | 624 | 612 | 119.2 |
| B | 12 | 1 | 138023 | 1152.49 | 624 | 612 | 119.2 |
| C | 3 | 233 | 409744 | 2925.88 | 607 | 614 | 139.8 |
| C | 0 | 10 | 159979 | 1139.7 | 607 | 614 | 139.8 |
| C | 0 | 207 | 71721 | 508.52 | 607 | 614 | 139.8 |
| D | 8 | 195 | 2678269 | 18139.19 | 581 | 568 | 147.6 |
| D | 2 | 250 | 700248 | 4739.75 | 581 | 568 | 147.6 |
| D | 10 | 203 | 642809 | 4350.65 | 581 | 568 | 147.6 |
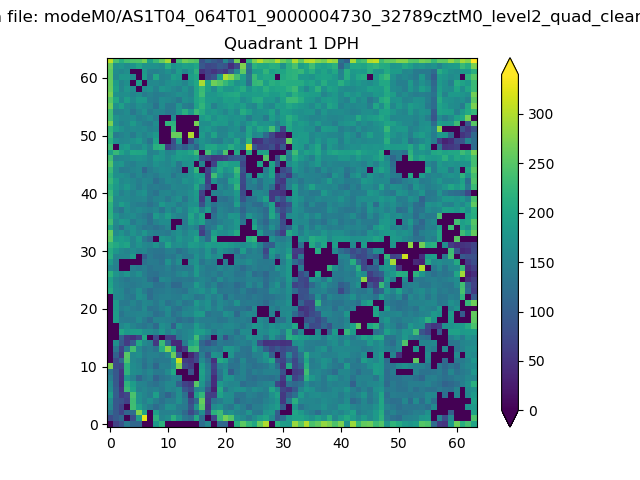
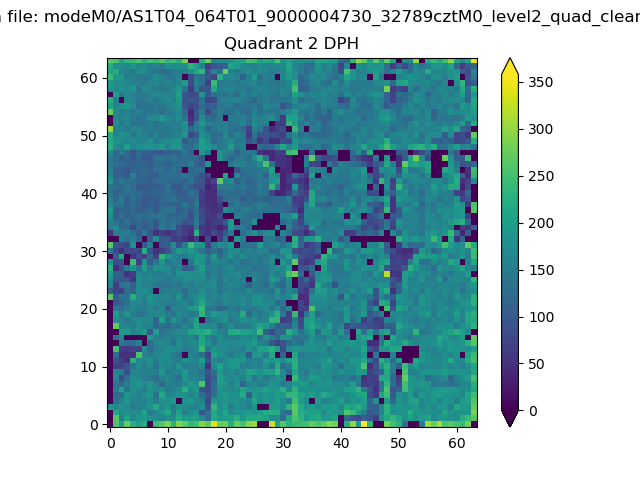
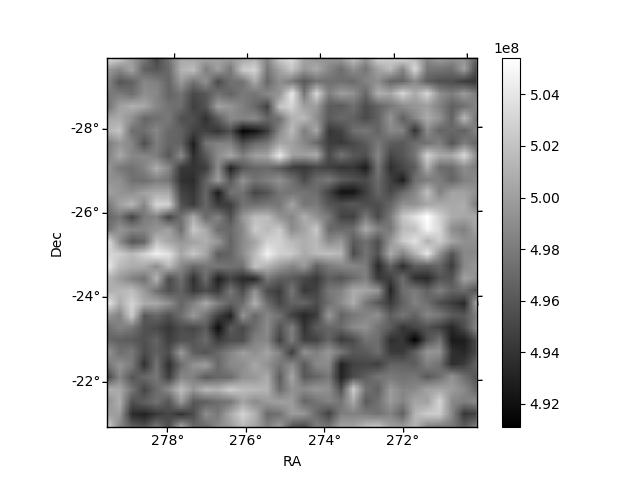
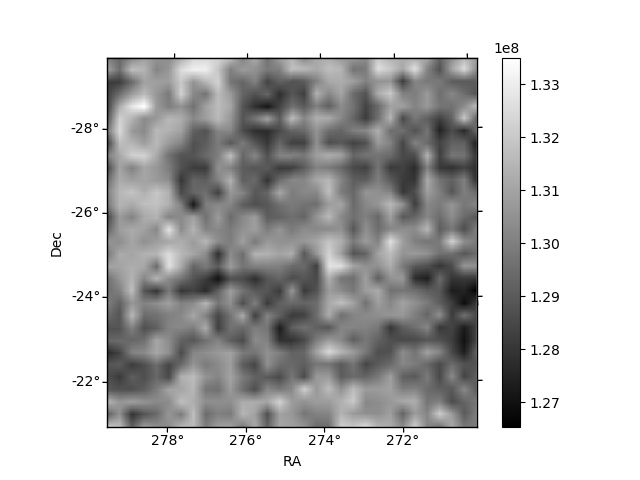
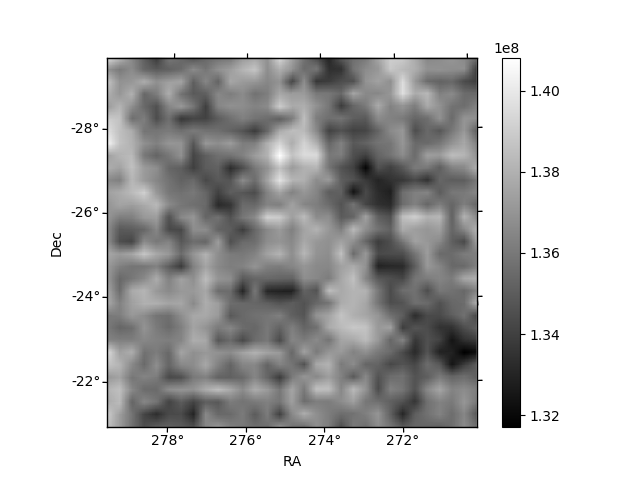
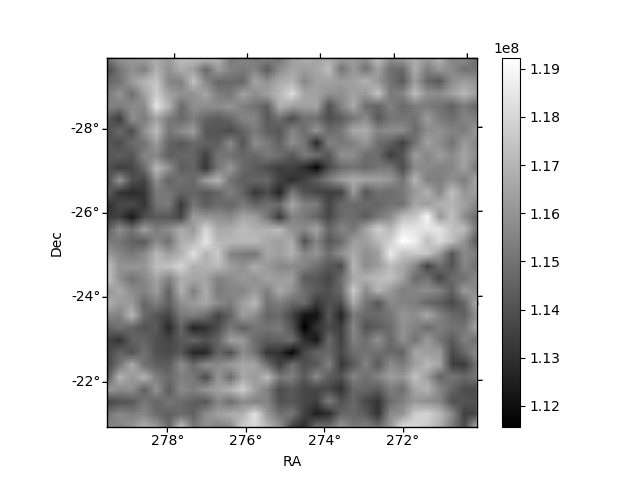
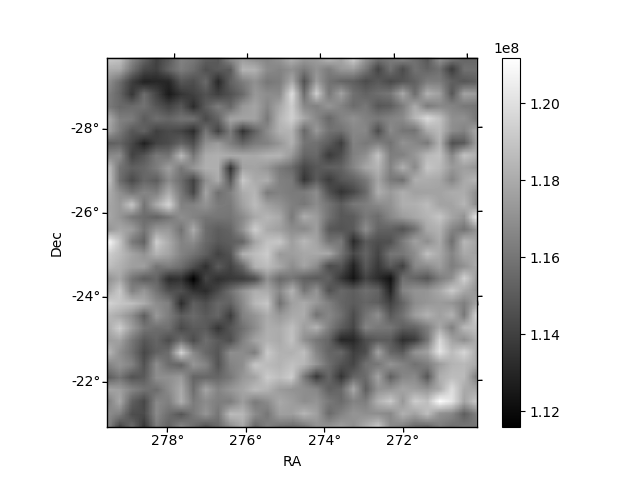
Histogram calculated using DETX and DETY for each event in the final _common_clean file
| Quadrant A | 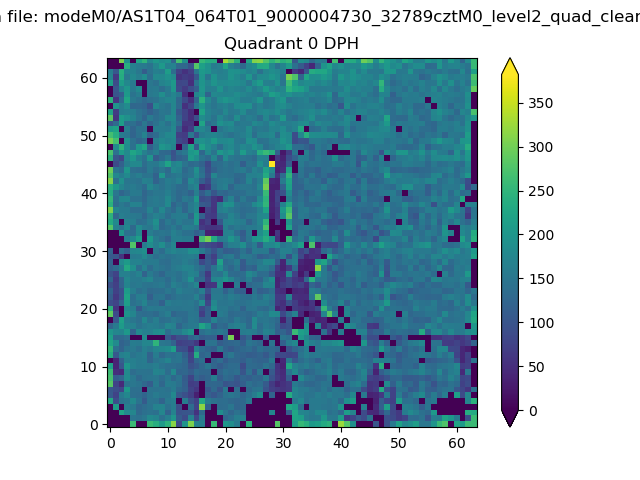 |
 |
Quadrant B |
|---|---|---|---|
| Quadrant D | 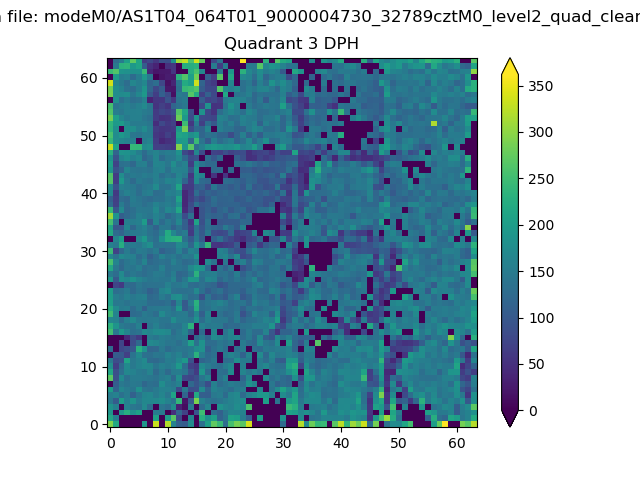 |
 |
Quadrant C |
| Plot type | Count rate plots | Images |
|---|---|---|
| Comparison with Poisson distribution Blue bars denote a histogram of data divided into 1 sec bins. Red curve is a Poisson curve with rate = median count rate of data. |
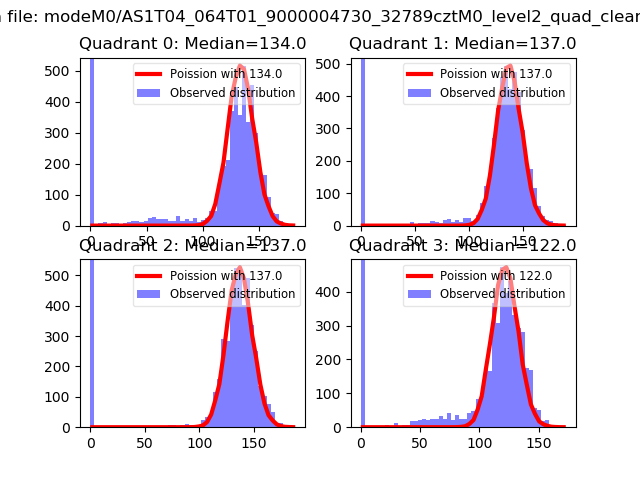 |
 |
| Quadrant-wise count rates Data is divided into 100 sec bins |
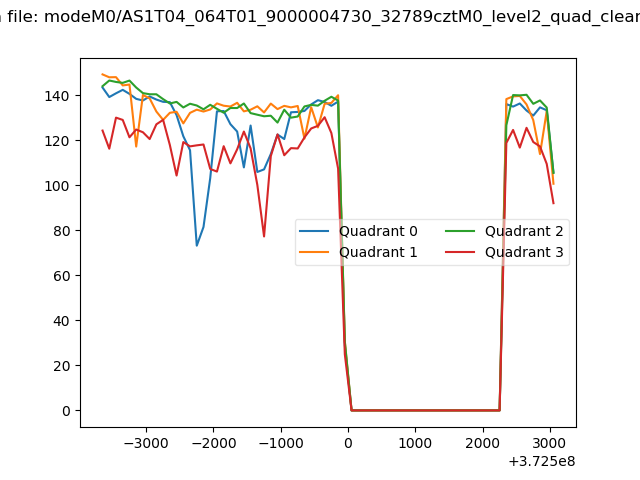 |
|
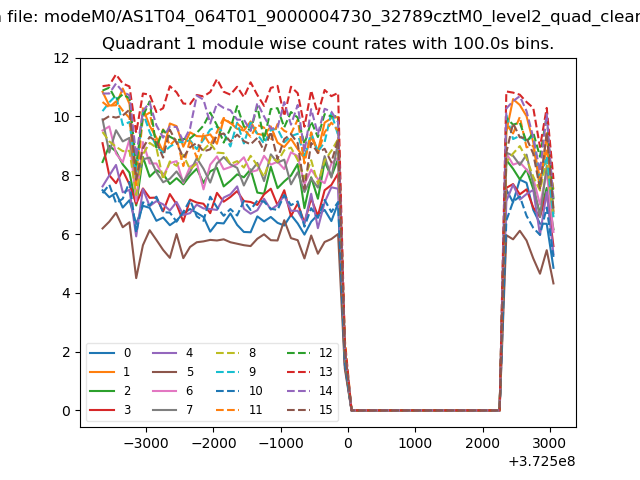
| Module-wise count rates for Quadrant A Data is divided into 100 sec bins |
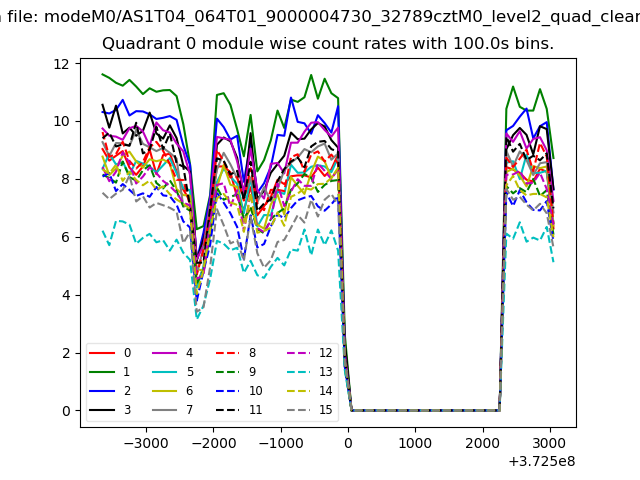 |
 |
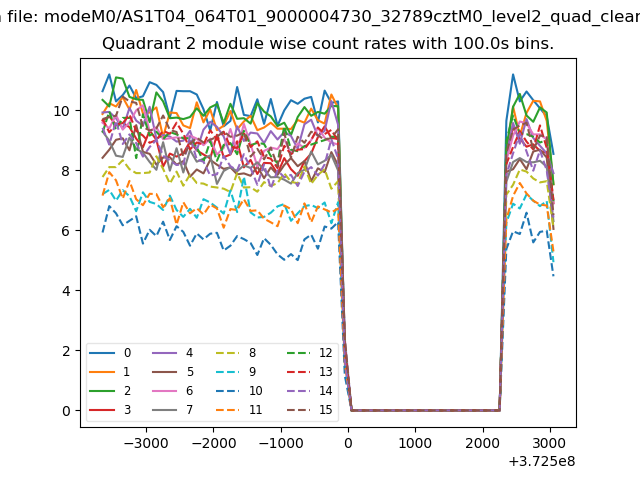
| Module-wise count rates for Quadrant B Data is divided into 100 sec bins |
 |
 |
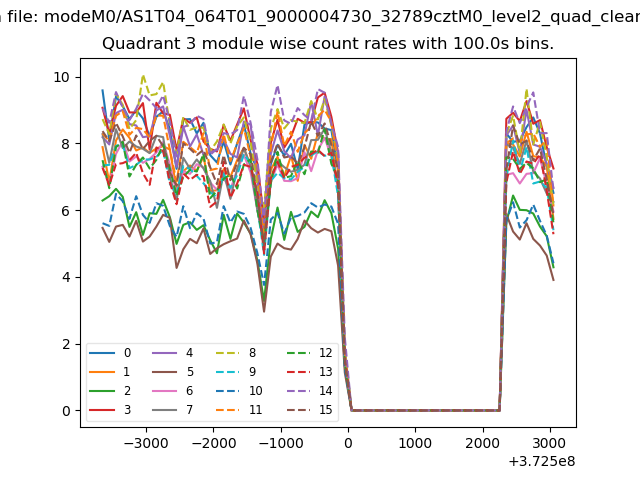
| Module-wise count rates for Quadrant C Data is divided into 100 sec bins |
 |
 |
| Module-wise count rates for Quadrant D Data is divided into 100 sec bins |
 |
 |
| Parameter | Plot |
|---|---|
| CZT HV Monitor |  |
| D_VDD | 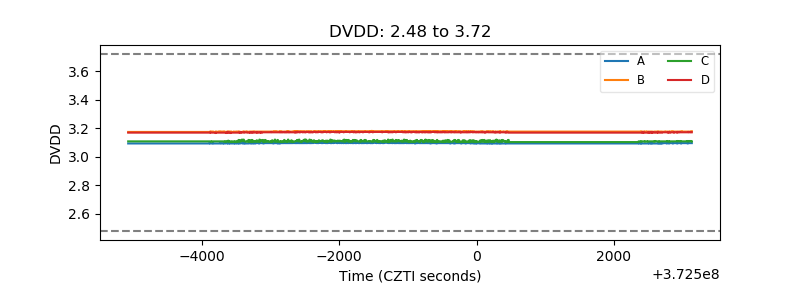 |
| Temperature 1 | 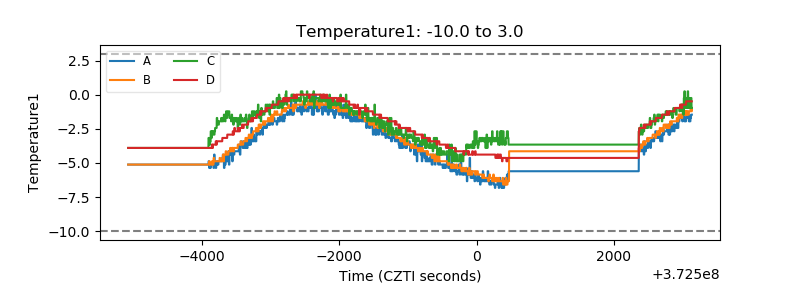 |
| Veto HV Monitor | 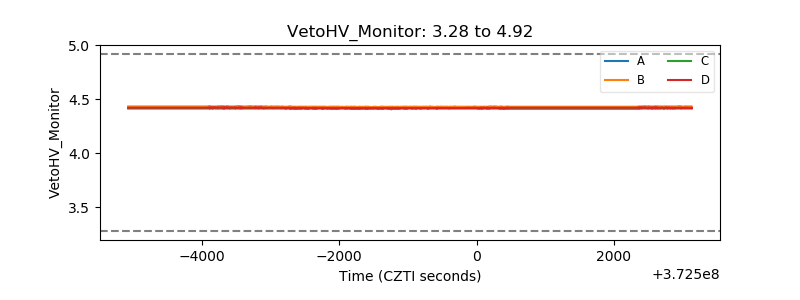 |
| Veto LLD | 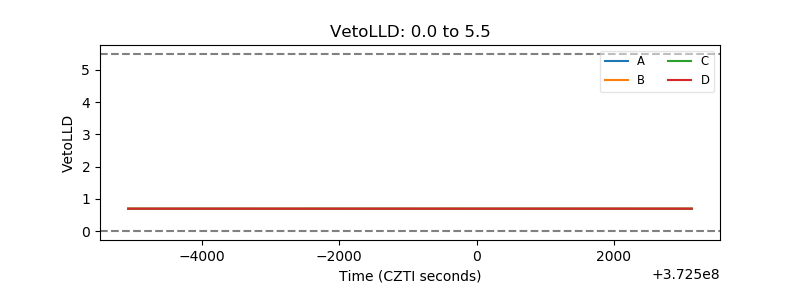 |
| Alpha Counter | 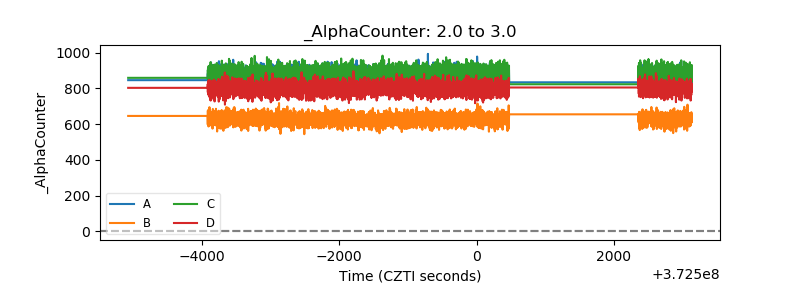 |
| _CPM_Rate | 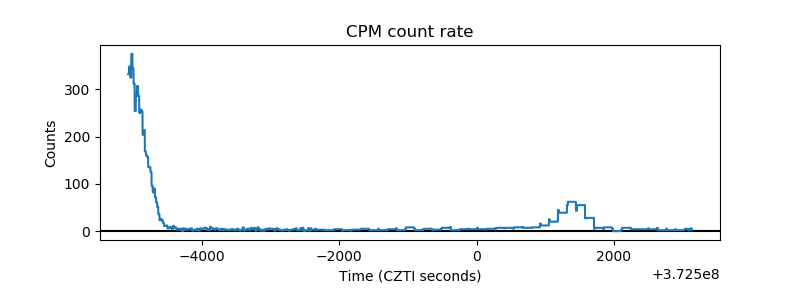 |
| CZT Counter | 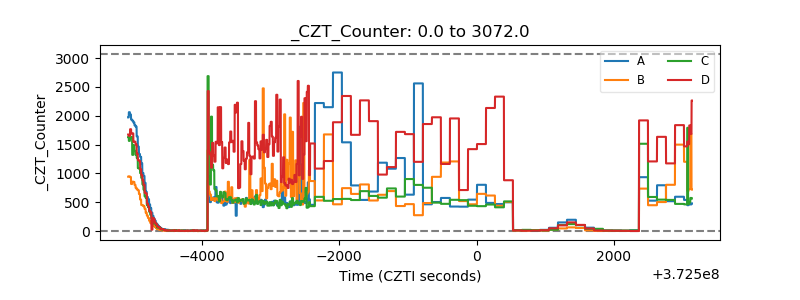 |
| +2.5 Volts monitor | 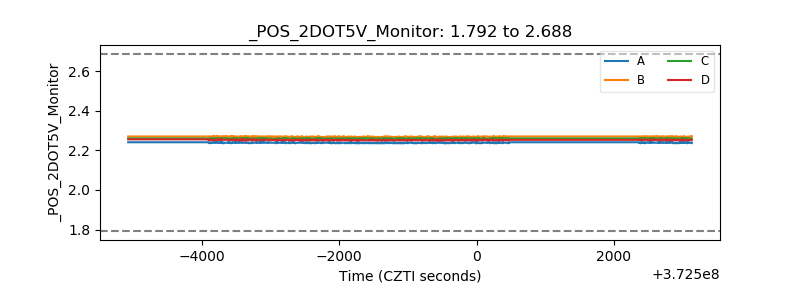 |
| +5 Volts monitor | 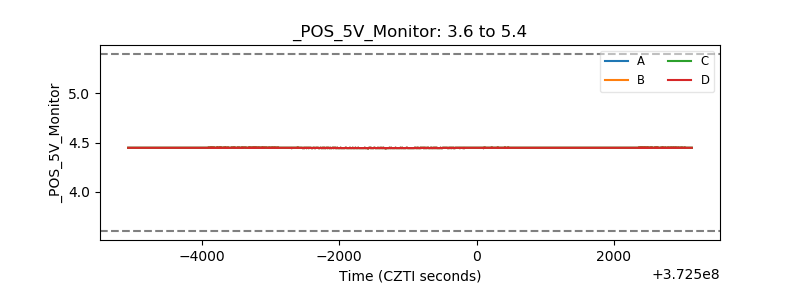 |
| _ROLL_ROT | 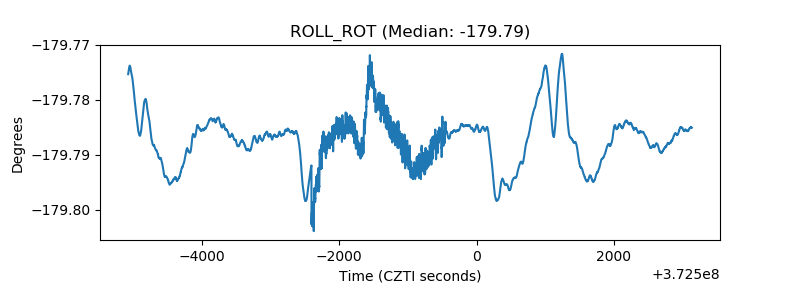 |
| _Roll_DEC | 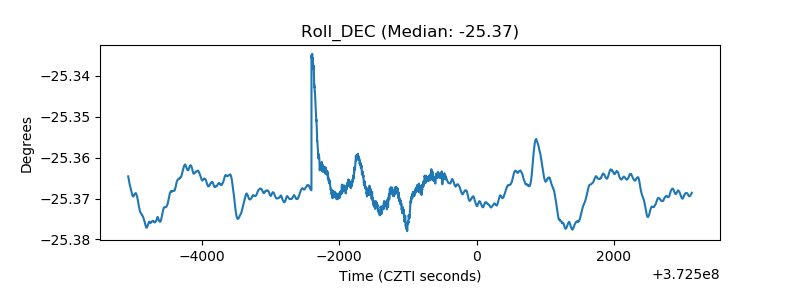 |
| _Roll_RA | 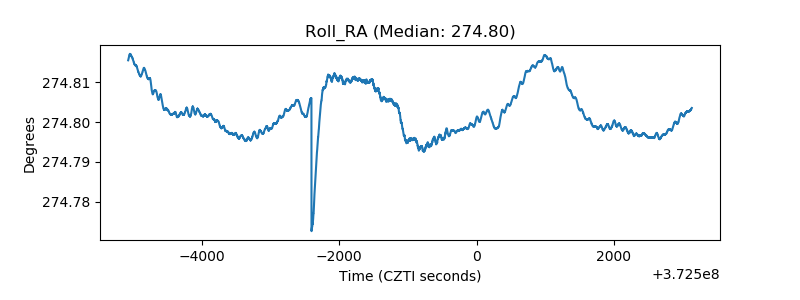 |
| Veto Counter |  |