| Param | Original file | Final file |
|---|---|---|
| Filename | modeM0/AS1T04_064T01_9000004730_32791cztM0_level2.evt | modeM0/AS1T04_064T01_9000004730_32791cztM0_level2_quad_clean.evt |
| Size (bytes) | 688,394,880 | 77,967,360 |
| Size | 656.5 MB | 74.4 MB |
| Events in quadrant A | 4,805,794 | 462,674 |
| Events in quadrant B | 3,753,817 | 512,256 |
| Events in quadrant C | 3,216,235 | 514,496 |
| Events in quadrant D | 8,669,418 | 453,714 |
| Mode M9 | |||
|---|---|---|---|
| Quadrant | BADHDUFLAG | Total packets | Discarded packets |
| A | 0 | 15 | 0 |
| B | 0 | 15 | 0 |
| C | 0 | 15 | 0 |
| D | 0 | 16 | 0 |
| Mode SS | |||
|---|---|---|---|
| Quadrant | BADHDUFLAG | Total packets | Discarded packets |
| A | 0 | 124 | 0 |
| B | 0 | 124 | 0 |
| C | 0 | 124 | 0 |
| D | 0 | 124 | 0 |
| Mode M0 | |||
|---|---|---|---|
| Quadrant | BADHDUFLAG | Total packets | Discarded packets |
| A | 0 | 18003 | 3 |
| B | 0 | 14942 | 2 |
| C | 0 | 13532 | 2 |
| D | 0 | 29881 | 2 |
| Quadrant | Total seconds | Saturated seconds | Saturation percentage |
|---|---|---|---|
| A | 5962 | 788 | 13.217041% |
| B | 5962 | 219 | 3.673264% |
| C | 5962 | 106 | 1.777927% |
| D | 5962 | 1005 | 16.856759% |
Noise dominated data is calculated using 1-second bins in cleaned event files. If a bin has >2000 counts, and if more than 50% of those come from <1% of pixels, then it is considered to be noise-dominated and hence unusable.
| Quadrant | # 1 sec bins | Bins with >0 counts | Bins with >2000 counts | High rate bins dominated by noise | Noise dominated (total time) | Noise dominated (detector-on time) | Marked lightcurve |
|---|---|---|---|---|---|---|---|
| A | 7306 | 5963 | 529 | 529 | 7.24% | 8.87% | 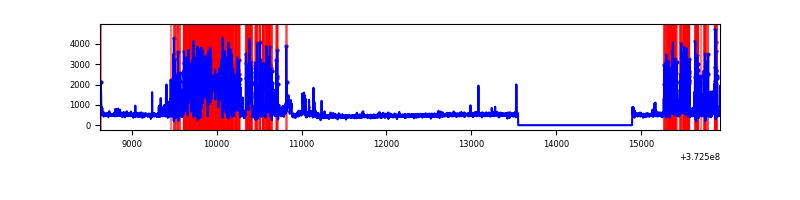 |
| B | 7306 | 5963 | 120 | 120 | 1.64% | 2.01% | 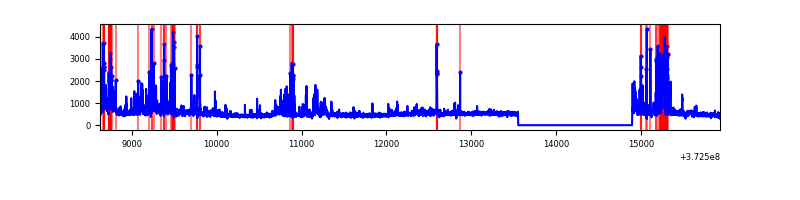 |
| C | 7306 | 5963 | 73 | 73 | 1.00% | 1.22% | 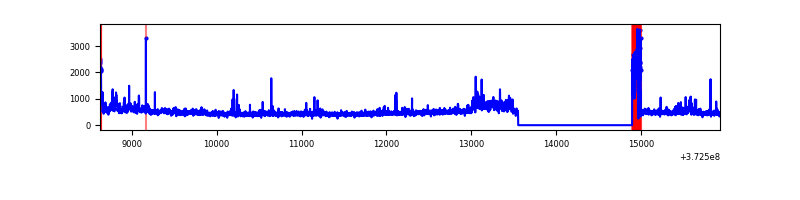 |
| D | 7306 | 5963 | 996 | 996 | 13.63% | 16.70% | 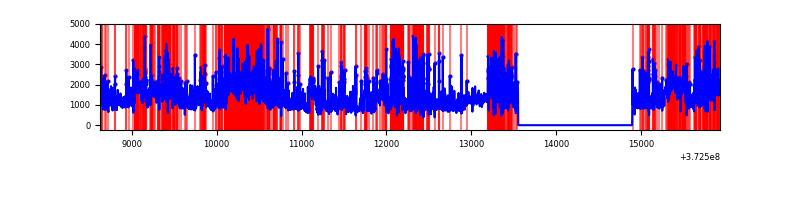 |
Top three noisy pixels from each quadrant. If the there are fewer than three noisy pixels in the level2.evt file, extra rows are filled as -1
| Pixel properties | Quadrant properties | ||||||
|---|---|---|---|---|---|---|---|
| Quadrant | DetID | PixID | Counts | Sigma | Mean | Median | Sigma |
| A | 15 | 237 | 2152226 | 15986.07 | 660 | 648 | 134.6 |
| A | 7 | 16 | 36762 | 268.32 | 660 | 648 | 134.6 |
| A | 14 | 238 | 16408 | 117.1 | 660 | 648 | 134.6 |
| B | 5 | 172 | 523582 | 3855.97 | 698 | 683 | 135.6 |
| B | 0 | 219 | 312216 | 2297.31 | 698 | 683 | 135.6 |
| B | 12 | 1 | 43896 | 318.66 | 698 | 683 | 135.6 |
| C | 0 | 10 | 374202 | 2386.36 | 673 | 678 | 156.5 |
| C | 3 | 233 | 136233 | 866.03 | 673 | 678 | 156.5 |
| C | 15 | 159 | 19525 | 120.41 | 673 | 678 | 156.5 |
| D | 8 | 195 | 2428046 | 14675.3 | 641 | 624 | 165.4 |
| D | 10 | 203 | 895953 | 5412.83 | 641 | 624 | 165.4 |
| D | 12 | 6 | 655217 | 3957.43 | 641 | 624 | 165.4 |
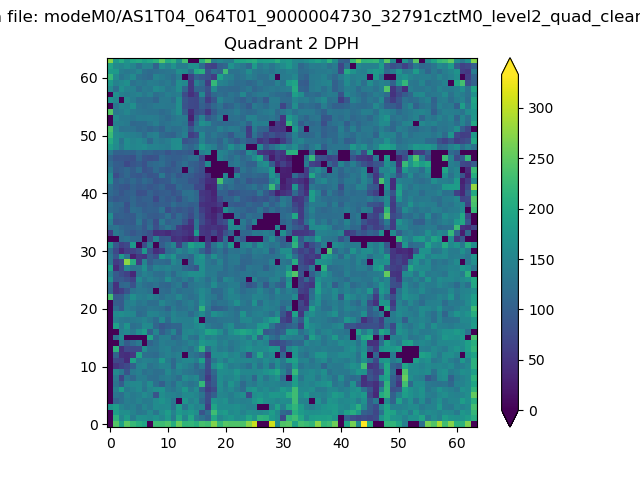
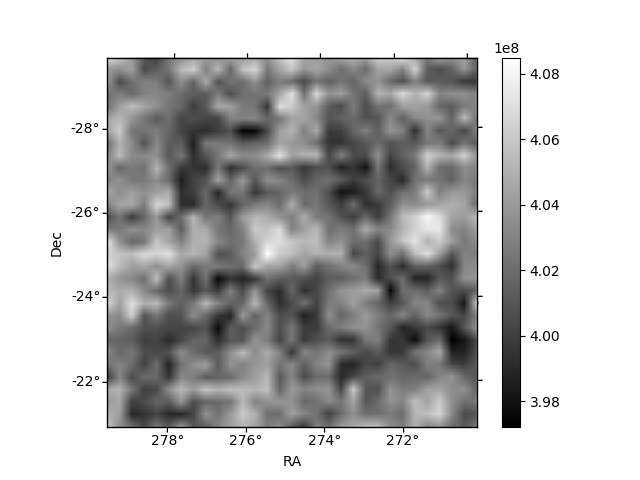
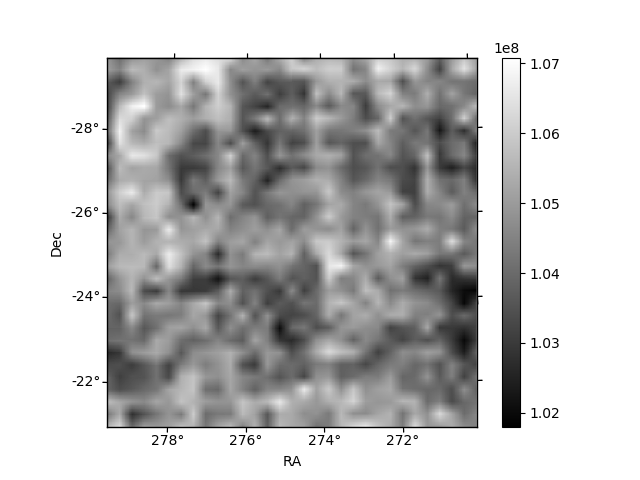
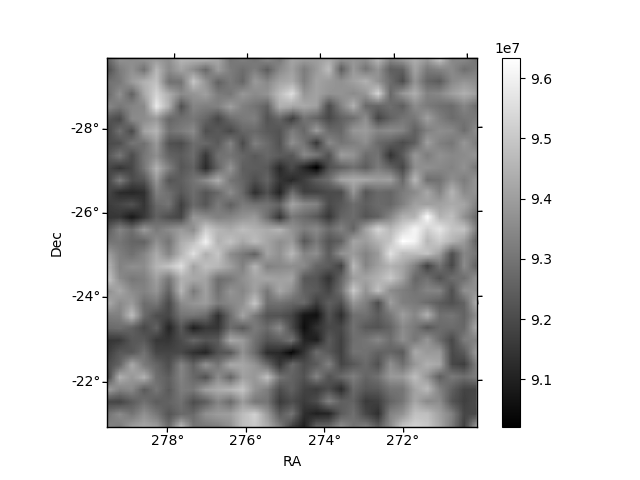
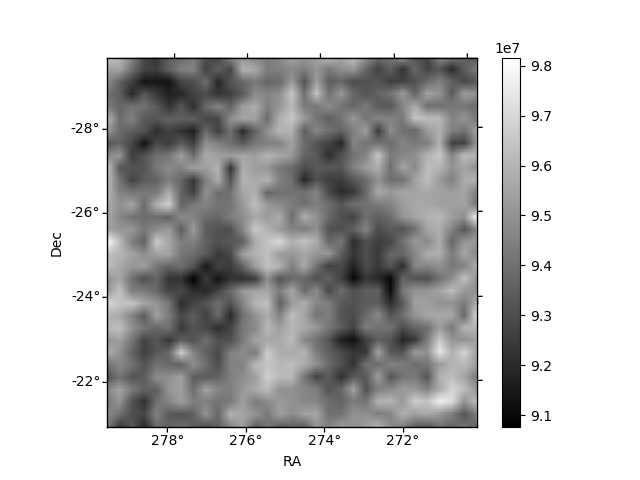
Histogram calculated using DETX and DETY for each event in the final _common_clean file
| Quadrant A | 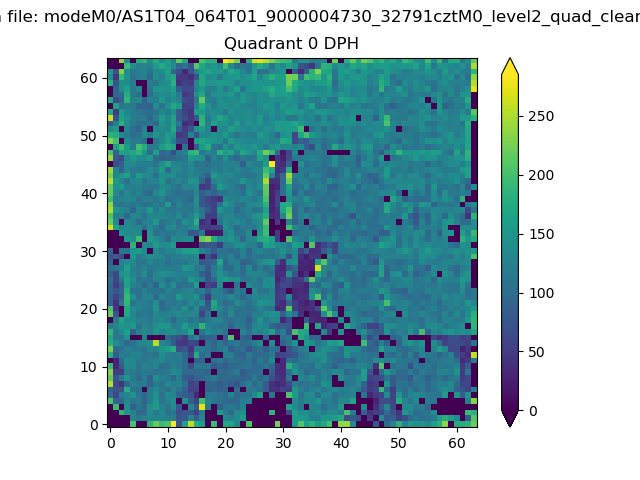 |
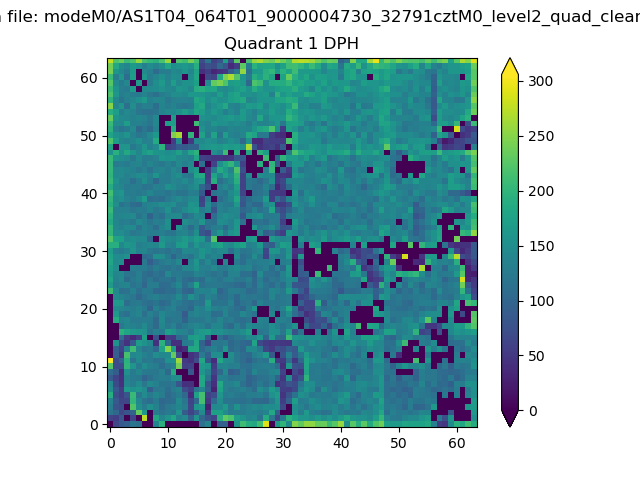 |
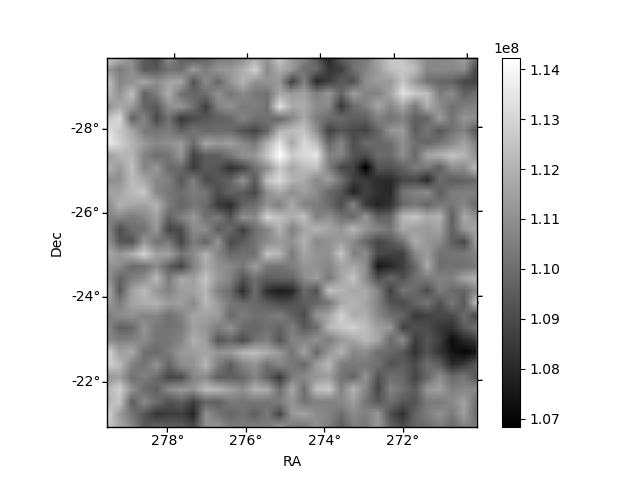
Quadrant B |
|---|---|---|---|
| Quadrant D | 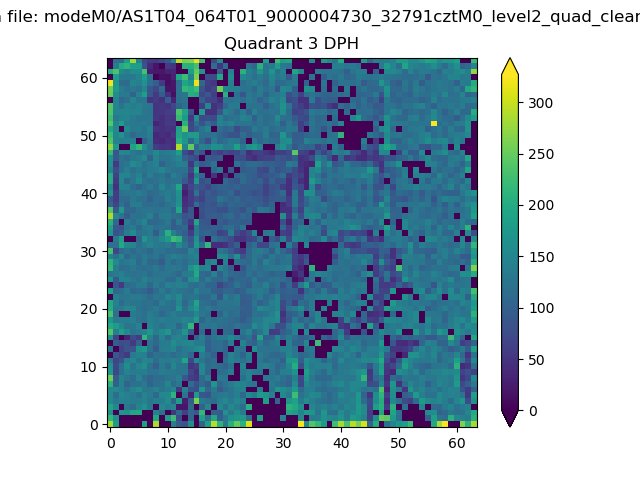 |
 |
Quadrant C |
| Plot type | Count rate plots | Images |
|---|---|---|
| Comparison with Poisson distribution Blue bars denote a histogram of data divided into 1 sec bins. Red curve is a Poisson curve with rate = median count rate of data. |
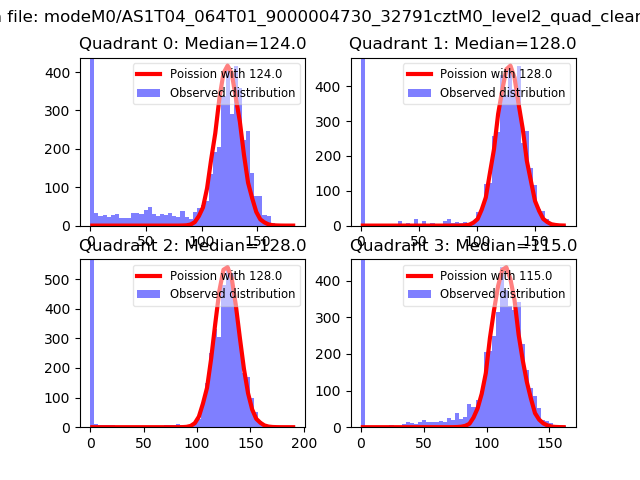 |
 |
| Quadrant-wise count rates Data is divided into 100 sec bins |
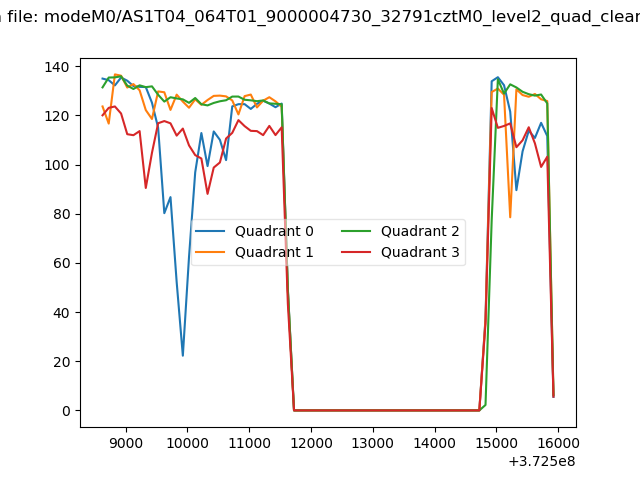 |
|
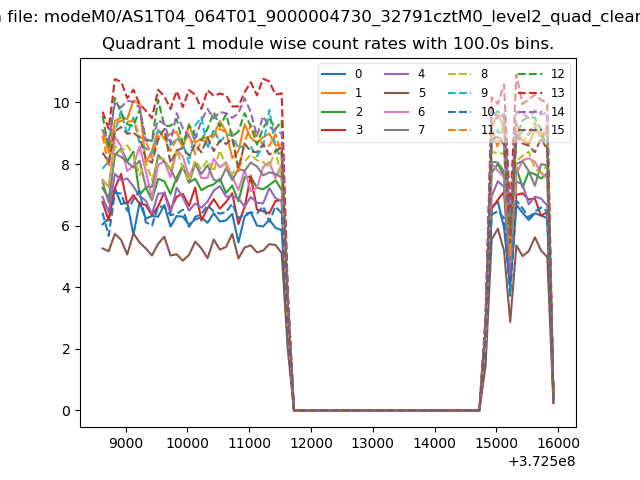
| Module-wise count rates for Quadrant A Data is divided into 100 sec bins |
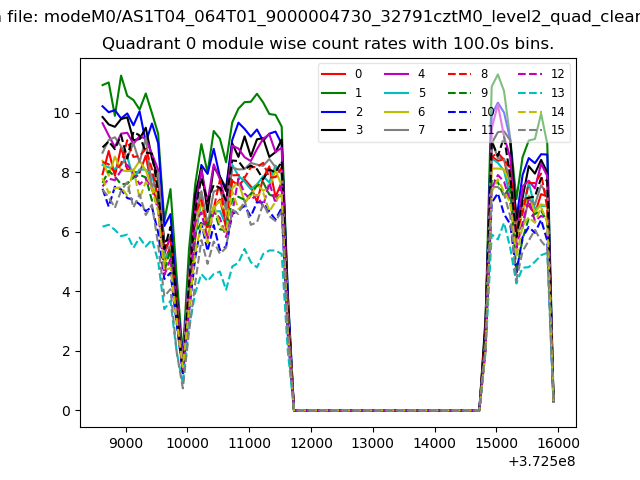 |
 |
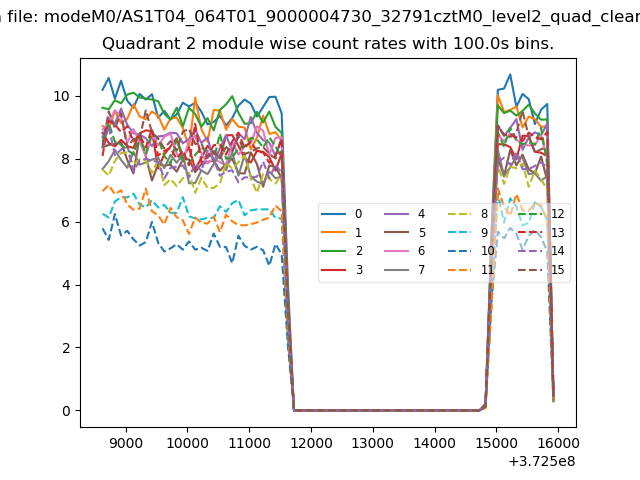
| Module-wise count rates for Quadrant B Data is divided into 100 sec bins |
 |
 |
| Module-wise count rates for Quadrant C Data is divided into 100 sec bins |
 |
 |
| Module-wise count rates for Quadrant D Data is divided into 100 sec bins |
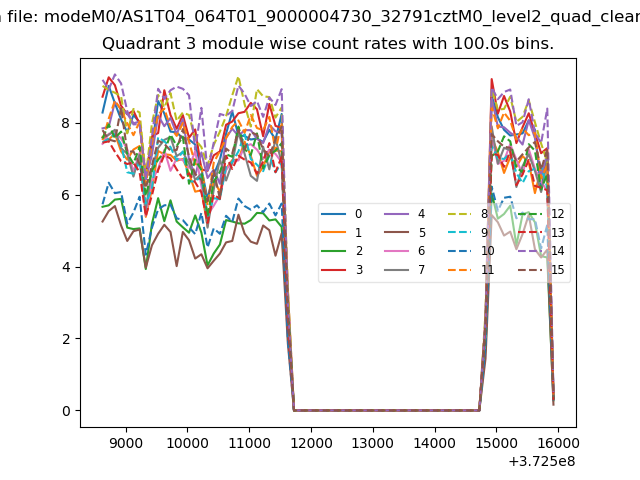 |
 |
| Parameter | Plot |
|---|---|
| CZT HV Monitor | 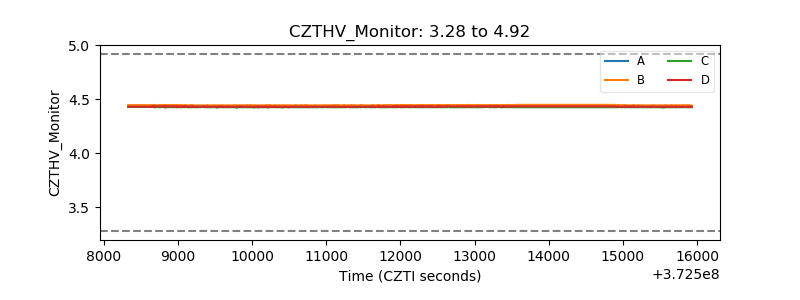 |
| D_VDD | 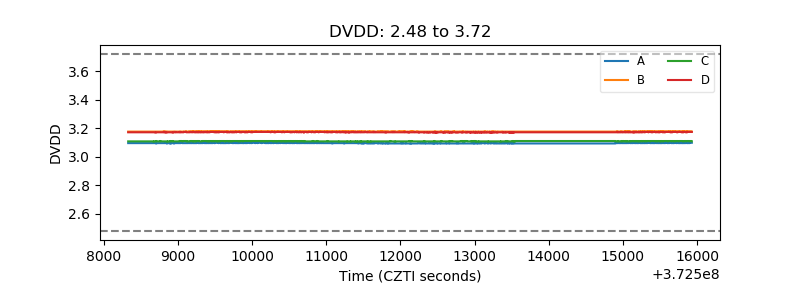 |
| Temperature 1 |  |
| Veto HV Monitor | 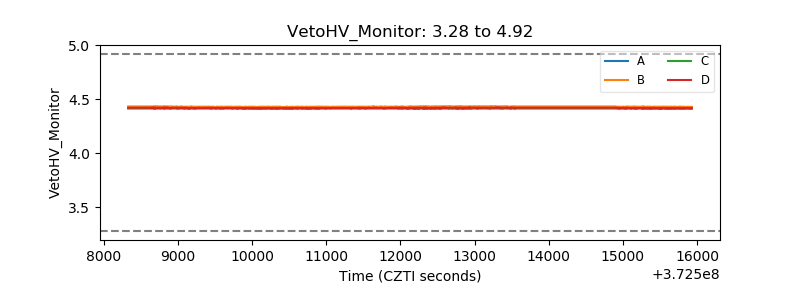 |
| Veto LLD | 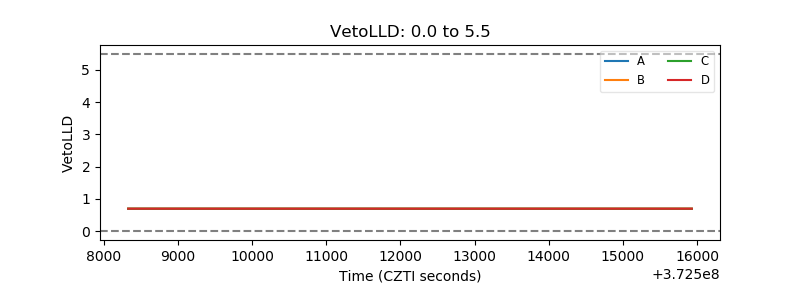 |
| Alpha Counter | 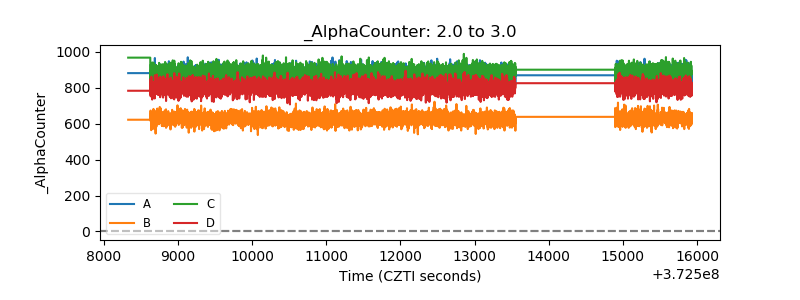 |
| _CPM_Rate | 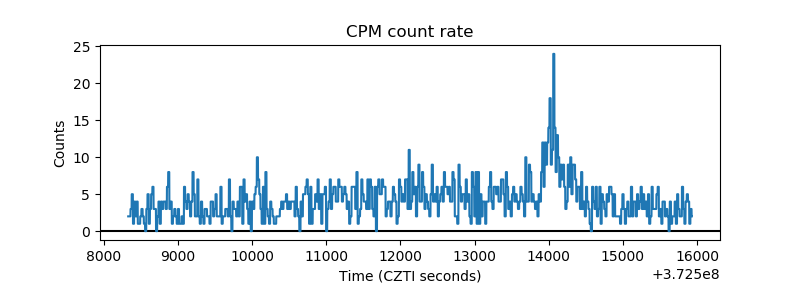 |
| CZT Counter | 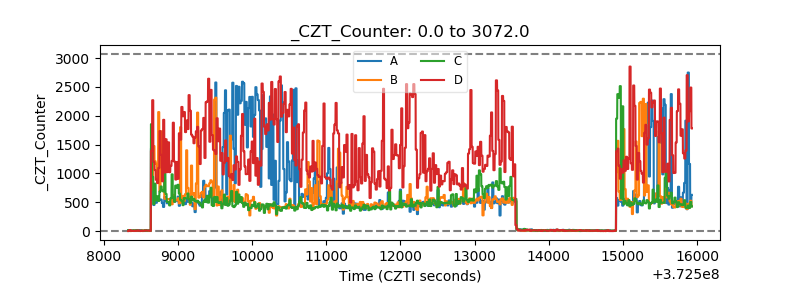 |
| +2.5 Volts monitor |  |
| +5 Volts monitor |  |
| _ROLL_ROT | 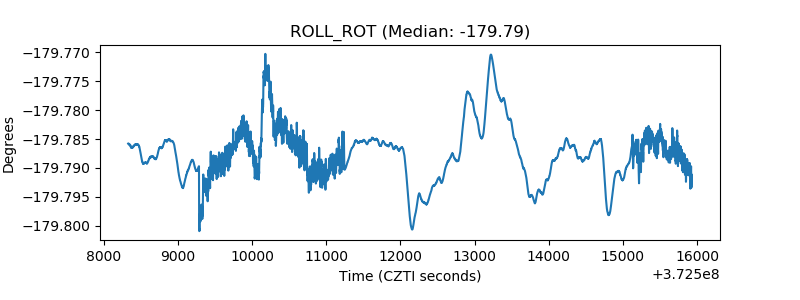 |
| _Roll_DEC | 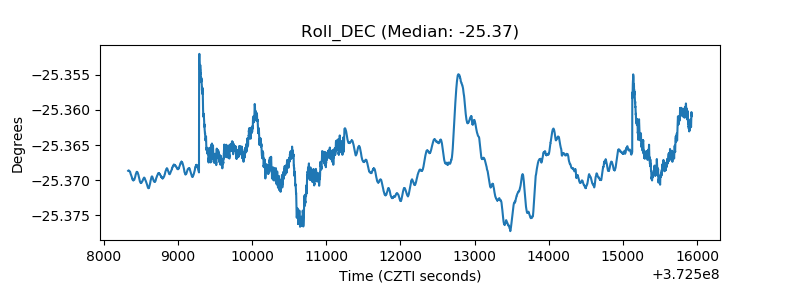 |
| _Roll_RA | 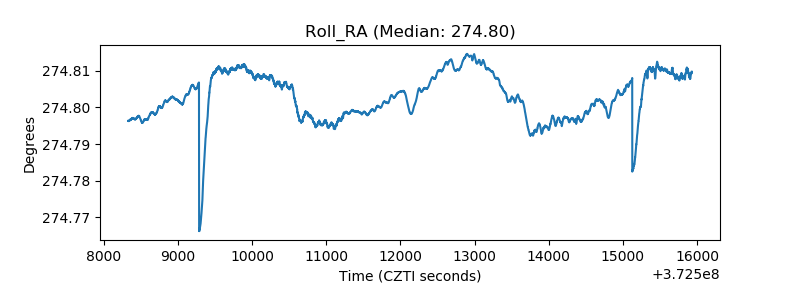 |
| Veto Counter | 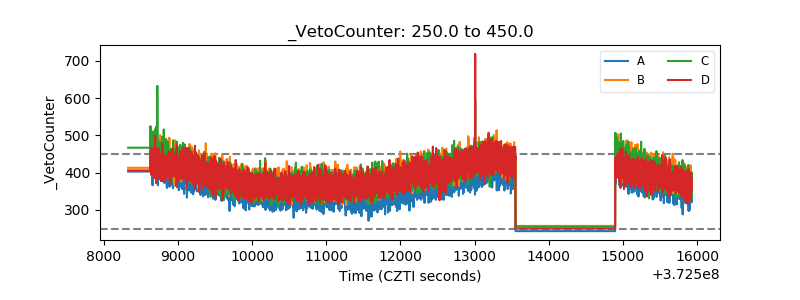 |