| Param | Original file | Final file |
|---|---|---|
| Filename | modeM0/AS1T04_064T01_9000004730_32792cztM0_level2.evt | modeM0/AS1T04_064T01_9000004730_32792cztM0_level2_quad_clean.evt |
| Size (bytes) | 650,684,160 | 72,679,680 |
| Size | 620.5 MB | 69.3 MB |
| Events in quadrant A | 4,478,307 | 431,540 |
| Events in quadrant B | 3,426,541 | 471,052 |
| Events in quadrant C | 3,184,329 | 466,328 |
| Events in quadrant D | 8,212,872 | 413,249 |
| Mode M9 | |||
|---|---|---|---|
| Quadrant | BADHDUFLAG | Total packets | Discarded packets |
| A | 0 | 13 | 0 |
| B | 0 | 13 | 0 |
| C | 0 | 13 | 0 |
| D | 0 | 13 | 0 |
| Mode SS | |||
|---|---|---|---|
| Quadrant | BADHDUFLAG | Total packets | Discarded packets |
| A | 0 | 122 | 0 |
| B | 0 | 122 | 0 |
| C | 0 | 122 | 0 |
| D | 0 | 122 | 0 |
| Mode M0 | |||
|---|---|---|---|
| Quadrant | BADHDUFLAG | Total packets | Discarded packets |
| A | 0 | 17206 | 3 |
| B | 0 | 13823 | 2 |
| C | 0 | 13241 | 2 |
| D | 0 | 28556 | 2 |
| Quadrant | Total seconds | Saturated seconds | Saturation percentage |
|---|---|---|---|
| A | 5983 | 605 | 10.111984% |
| B | 5983 | 126 | 2.105967% |
| C | 5983 | 99 | 1.654688% |
| D | 5983 | 829 | 13.855925% |
Noise dominated data is calculated using 1-second bins in cleaned event files. If a bin has >2000 counts, and if more than 50% of those come from <1% of pixels, then it is considered to be noise-dominated and hence unusable.
| Quadrant | # 1 sec bins | Bins with >0 counts | Bins with >2000 counts | High rate bins dominated by noise | Noise dominated (total time) | Noise dominated (detector-on time) | Marked lightcurve |
|---|---|---|---|---|---|---|---|
| A | 7266 | 5984 | 400 | 400 | 5.51% | 6.68% | 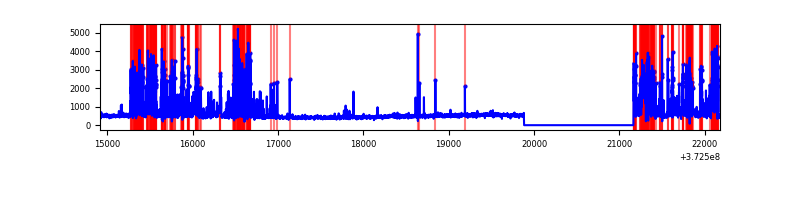 |
| B | 7266 | 5984 | 79 | 79 | 1.09% | 1.32% | 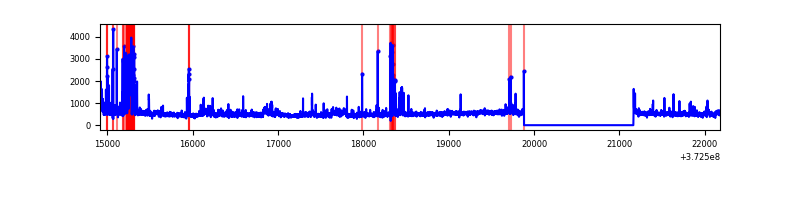 |
| C | 7266 | 5984 | 72 | 72 | 0.99% | 1.20% | 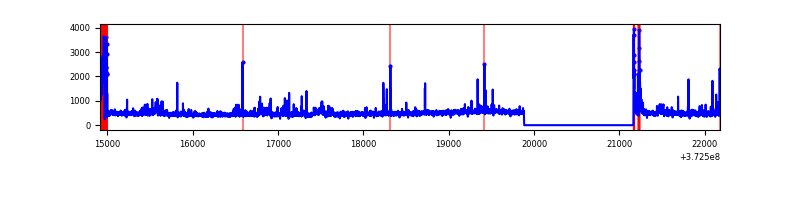 |
| D | 7266 | 5984 | 804 | 804 | 11.07% | 13.44% | 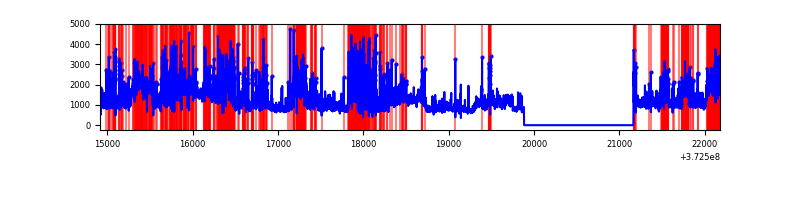 |
Top three noisy pixels from each quadrant. If the there are fewer than three noisy pixels in the level2.evt file, extra rows are filled as -1
| Pixel properties | Quadrant properties | ||||||
|---|---|---|---|---|---|---|---|
| Quadrant | DetID | PixID | Counts | Sigma | Mean | Median | Sigma |
| A | 15 | 237 | 1784188 | 13128.8 | 668 | 655 | 135.8 |
| A | 14 | 63 | 43511 | 315.47 | 668 | 655 | 135.8 |
| A | 7 | 16 | 18827 | 133.77 | 668 | 655 | 135.8 |
| B | 5 | 172 | 279816 | 2083.67 | 701 | 687 | 134.0 |
| B | 0 | 219 | 148920 | 1106.55 | 701 | 687 | 134.0 |
| B | 12 | 1 | 64436 | 475.88 | 701 | 687 | 134.0 |
| C | 0 | 10 | 249214 | 1581.8 | 675 | 680 | 157.1 |
| C | 3 | 233 | 198554 | 1259.37 | 675 | 680 | 157.1 |
| C | 15 | 159 | 21246 | 130.89 | 675 | 680 | 157.1 |
| D | 8 | 195 | 2549755 | 15467.94 | 646 | 633 | 164.8 |
| D | 10 | 203 | 867787 | 5261.85 | 646 | 633 | 164.8 |
| D | 12 | 6 | 529175 | 3207.17 | 646 | 633 | 164.8 |
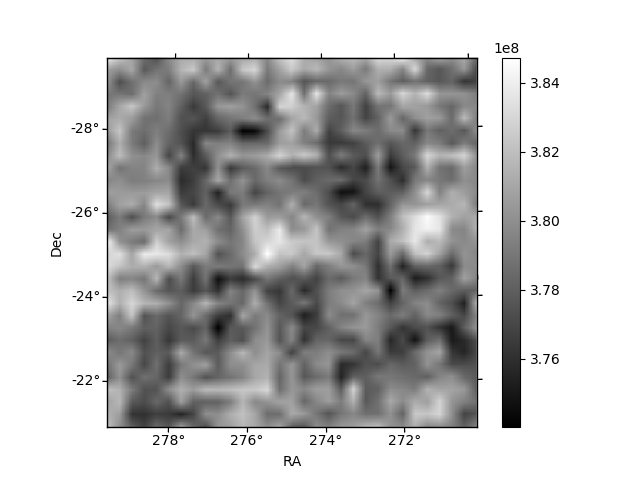
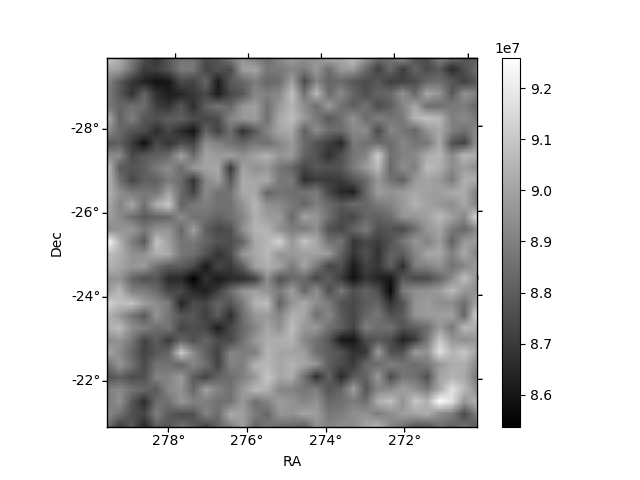
Histogram calculated using DETX and DETY for each event in the final _common_clean file
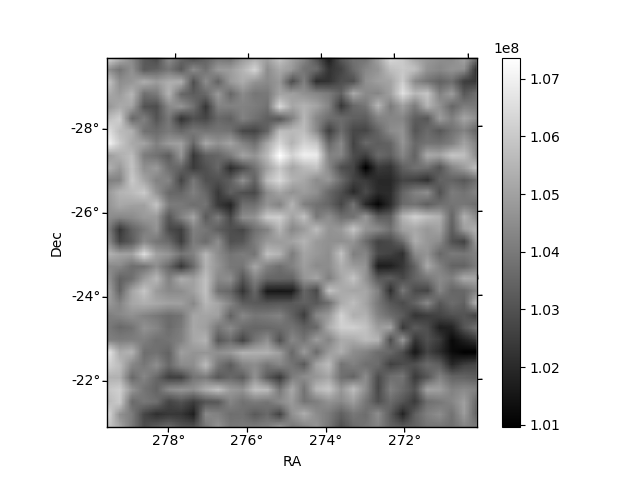
| Quadrant A | 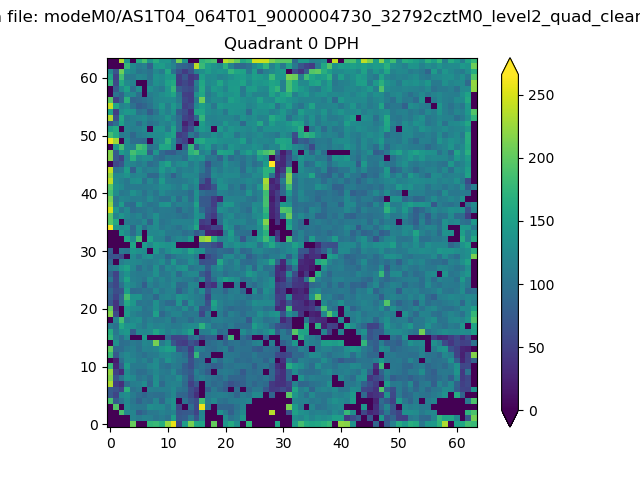 |
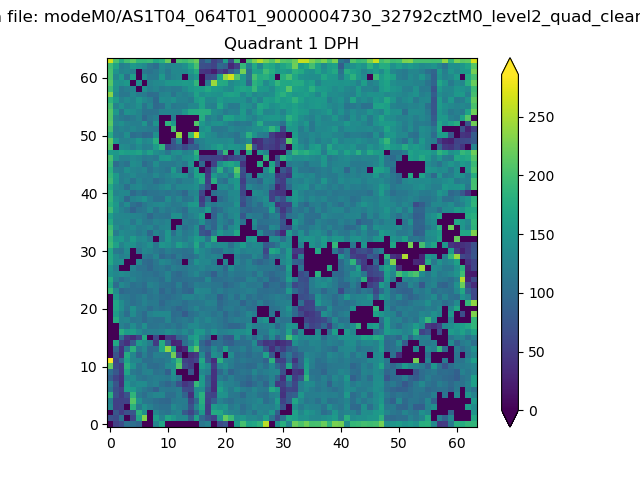 |
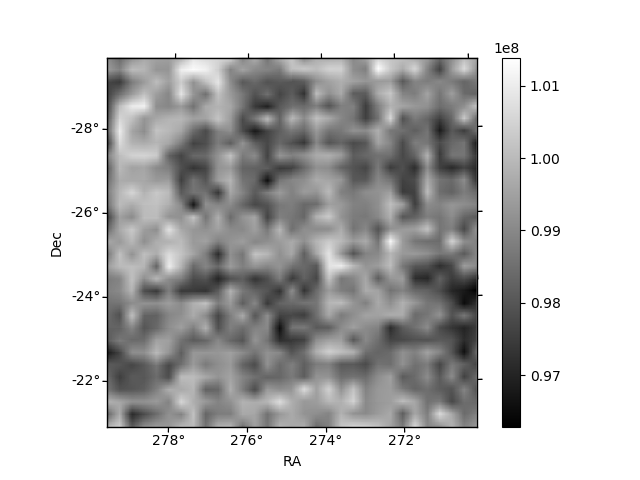
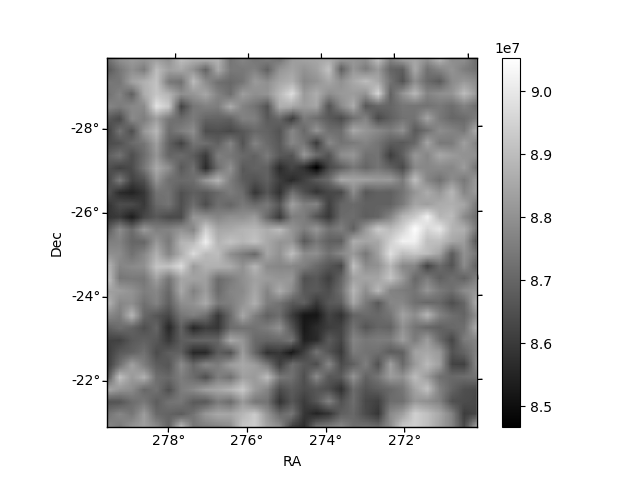
Quadrant B |
|---|---|---|---|
| Quadrant D | 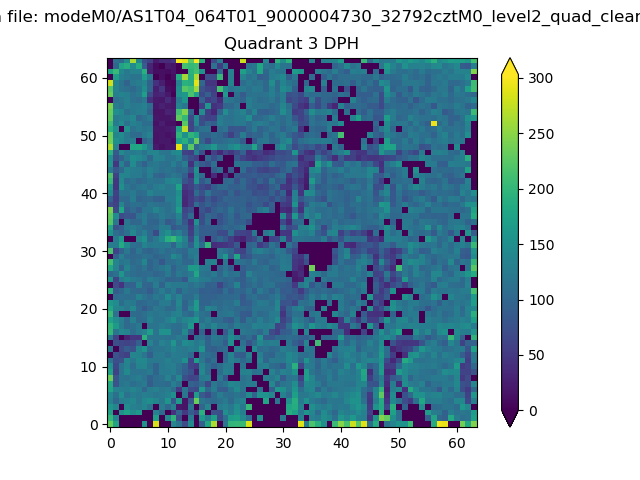 |
 |
Quadrant C |
| Plot type | Count rate plots | Images |
|---|---|---|
| Comparison with Poisson distribution Blue bars denote a histogram of data divided into 1 sec bins. Red curve is a Poisson curve with rate = median count rate of data. |
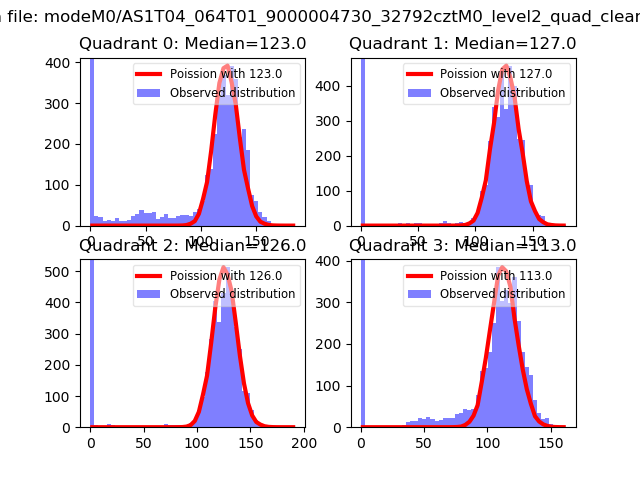 |
 |
| Quadrant-wise count rates Data is divided into 100 sec bins |
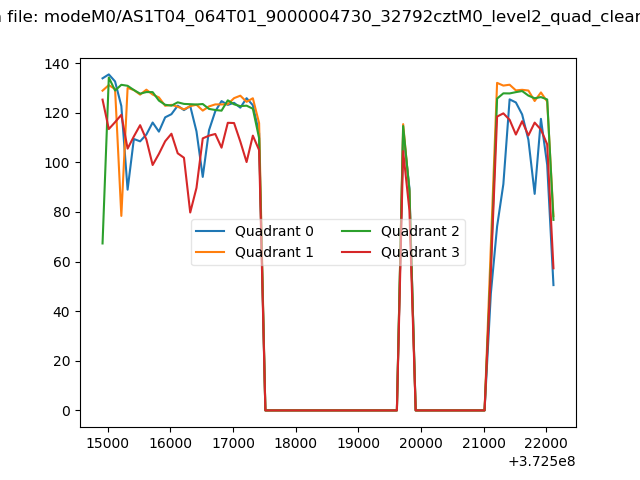 |
|
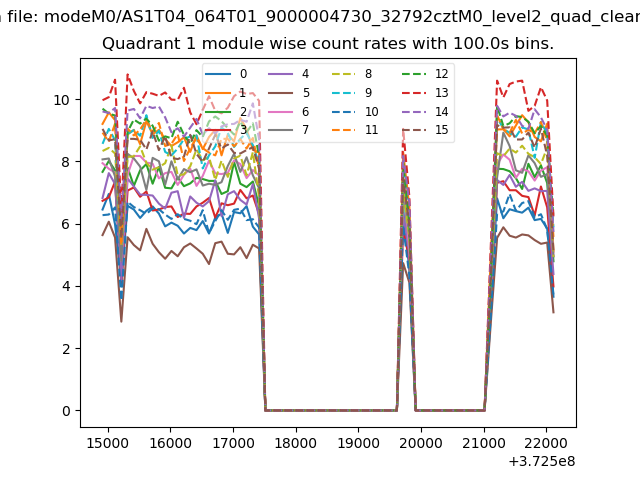
| Module-wise count rates for Quadrant A Data is divided into 100 sec bins |
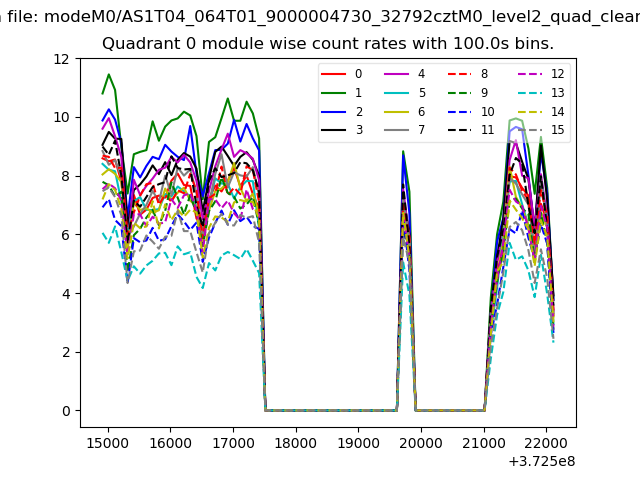 |
 |
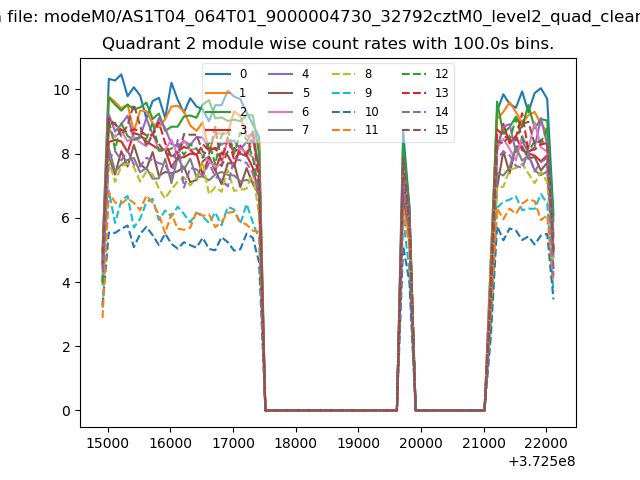
| Module-wise count rates for Quadrant B Data is divided into 100 sec bins |
 |
 |
| Module-wise count rates for Quadrant C Data is divided into 100 sec bins |
 |
 |
| Module-wise count rates for Quadrant D Data is divided into 100 sec bins |
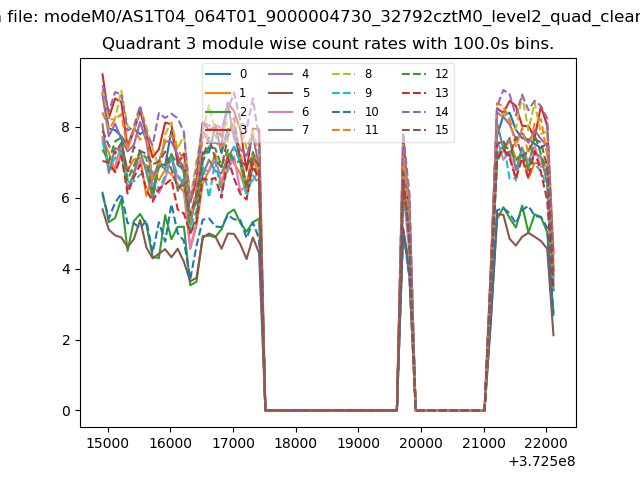 |
 |
| Parameter | Plot |
|---|---|
| CZT HV Monitor | 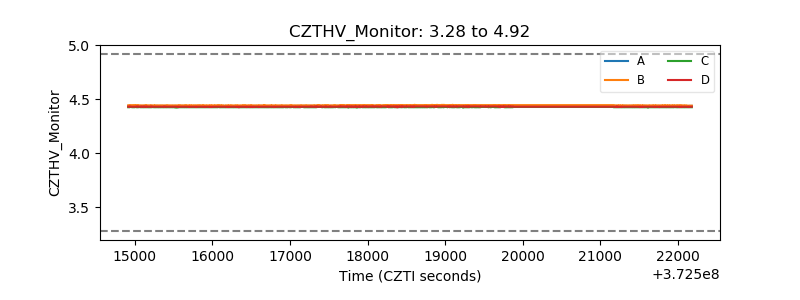 |
| D_VDD | 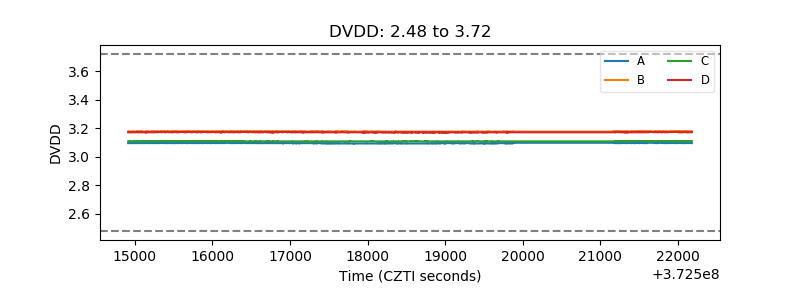 |
| Temperature 1 | 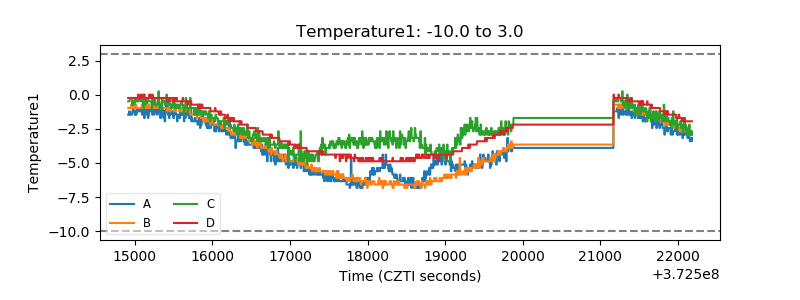 |
| Veto HV Monitor | 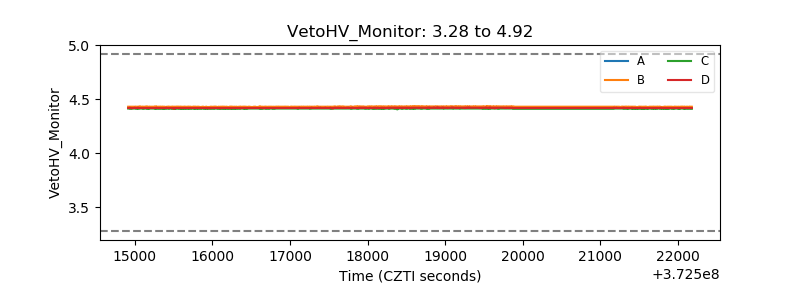 |
| Veto LLD | 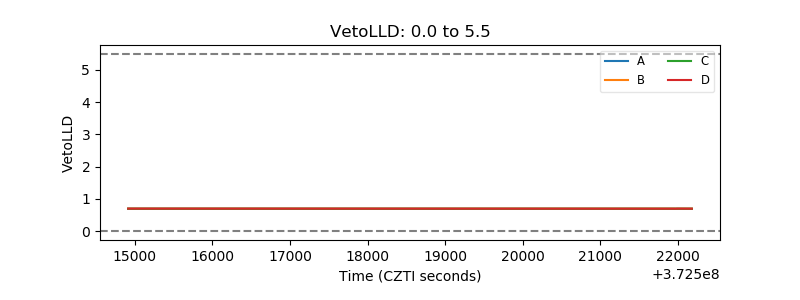 |
| Alpha Counter | 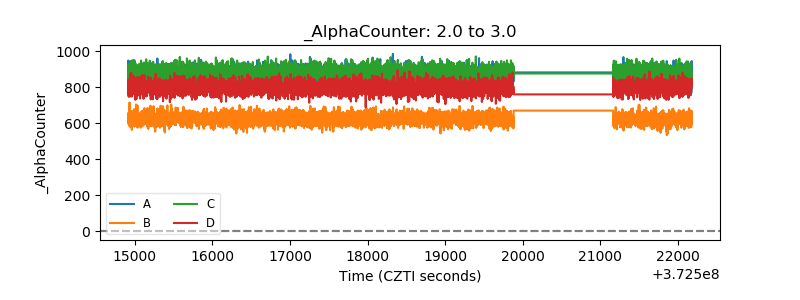 |
| _CPM_Rate | 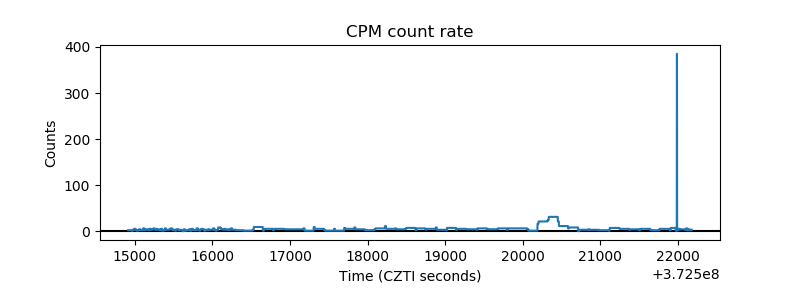 |
| CZT Counter | 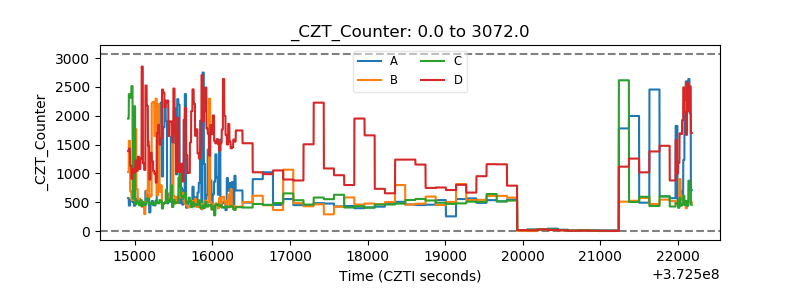 |
| +2.5 Volts monitor |  |
| +5 Volts monitor | 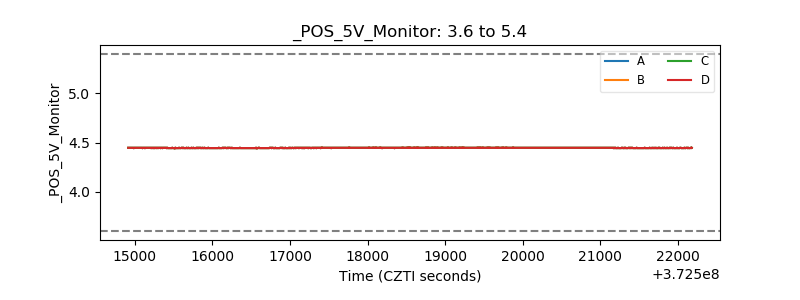 |
| _ROLL_ROT | 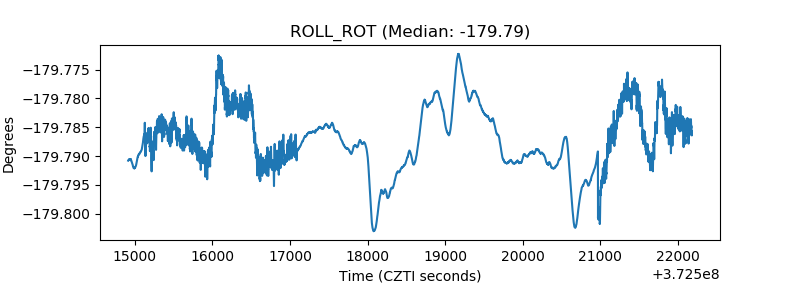 |
| _Roll_DEC | 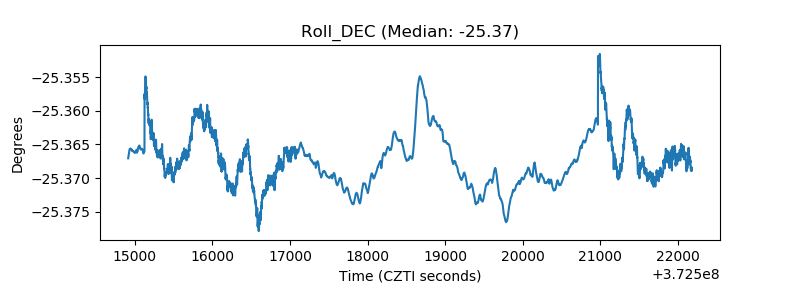 |
| _Roll_RA | 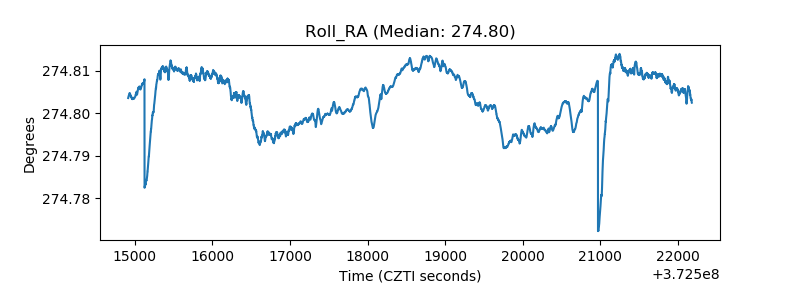 |
| Veto Counter | 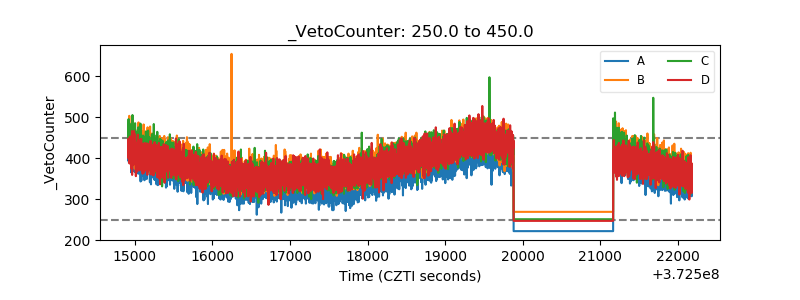 |