| Param | Original file | Final file |
|---|---|---|
| Filename | modeM0/AS1T04_064T01_9000004730_32794cztM0_level2.evt | modeM0/AS1T04_064T01_9000004730_32794cztM0_level2_quad_clean.evt |
| Size (bytes) | 1,125,835,200 | 120,726,720 |
| Size | 1.0 GB | 115.1 MB |
| Events in quadrant A | 7,051,184 | 718,104 |
| Events in quadrant B | 6,185,359 | 773,842 |
| Events in quadrant C | 5,693,547 | 767,150 |
| Events in quadrant D | 14,458,179 | 667,320 |
| Mode M9 | |||
|---|---|---|---|
| Quadrant | BADHDUFLAG | Total packets | Discarded packets |
| A | 0 | 28 | 0 |
| B | 0 | 28 | 0 |
| C | 0 | 28 | 0 |
| D | 0 | 28 | 0 |
| Mode SS | |||
|---|---|---|---|
| Quadrant | BADHDUFLAG | Total packets | Discarded packets |
| A | 0 | 214 | 0 |
| B | 0 | 214 | 0 |
| C | 0 | 214 | 0 |
| D | 0 | 214 | 0 |
| Mode M0 | |||
|---|---|---|---|
| Quadrant | BADHDUFLAG | Total packets | Discarded packets |
| A | 0 | 27944 | 3 |
| B | 0 | 25081 | 2 |
| C | 0 | 23808 | 2 |
| D | 0 | 50405 | 2 |
| Quadrant | Total seconds | Saturated seconds | Saturation percentage |
|---|---|---|---|
| A | 10524 | 728 | 6.917522% |
| B | 10524 | 230 | 2.185481% |
| C | 10524 | 128 | 1.216268% |
| D | 10524 | 1541 | 14.642721% |
Noise dominated data is calculated using 1-second bins in cleaned event files. If a bin has >2000 counts, and if more than 50% of those come from <1% of pixels, then it is considered to be noise-dominated and hence unusable.
| Quadrant | # 1 sec bins | Bins with >0 counts | Bins with >2000 counts | High rate bins dominated by noise | Noise dominated (total time) | Noise dominated (detector-on time) | Marked lightcurve |
|---|---|---|---|---|---|---|---|
| A | 13300 | 10526 | 463 | 463 | 3.48% | 4.40% | 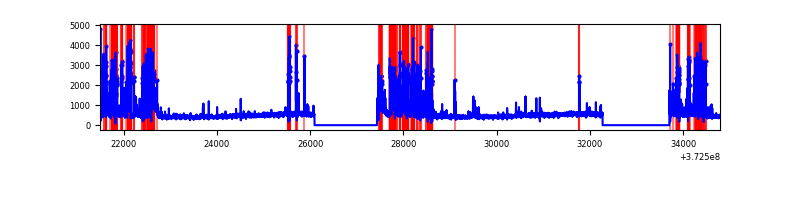 |
| B | 13300 | 10526 | 116 | 116 | 0.87% | 1.10% | 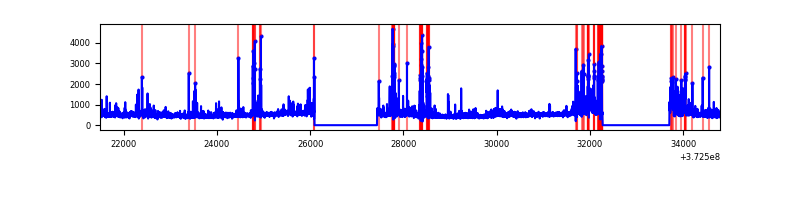 |
| C | 13300 | 10526 | 85 | 85 | 0.64% | 0.81% | 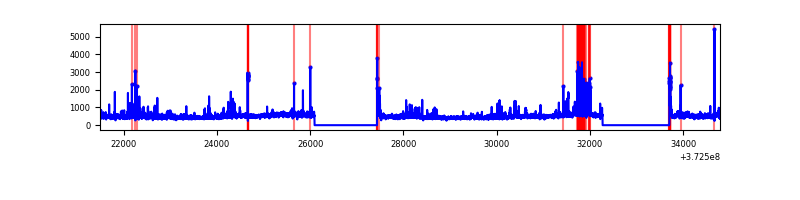 |
| D | 13300 | 10526 | 1572 | 1572 | 11.82% | 14.93% | 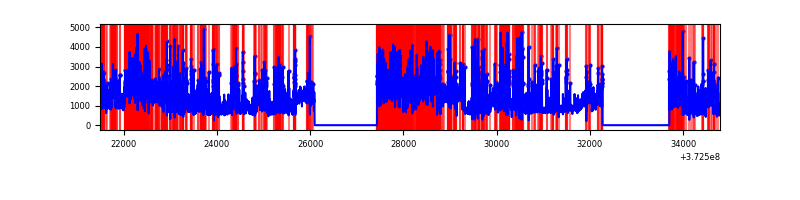 |
Top three noisy pixels from each quadrant. If the there are fewer than three noisy pixels in the level2.evt file, extra rows are filled as -1
| Pixel properties | Quadrant properties | ||||||
|---|---|---|---|---|---|---|---|
| Quadrant | DetID | PixID | Counts | Sigma | Mean | Median | Sigma |
| A | 15 | 237 | 2193893 | 9162.67 | 1188 | 1164 | 239.3 |
| A | 14 | 63 | 75224 | 309.47 | 1188 | 1164 | 239.3 |
| A | 12 | 16 | 54791 | 224.09 | 1188 | 1164 | 239.3 |
| B | 0 | 219 | 454672 | 1918.89 | 1237 | 1209 | 236.3 |
| B | 5 | 172 | 429567 | 1812.65 | 1237 | 1209 | 236.3 |
| B | 0 | 230 | 172337 | 724.15 | 1237 | 1209 | 236.3 |
| C | 0 | 10 | 596882 | 2143.46 | 1194 | 1206 | 277.9 |
| C | 3 | 233 | 159482 | 569.53 | 1194 | 1206 | 277.9 |
| C | 0 | 207 | 77599 | 274.89 | 1194 | 1206 | 277.9 |
| D | 8 | 195 | 4828161 | 16404.42 | 1135 | 1108 | 294.3 |
| D | 10 | 203 | 1309167 | 4445.35 | 1135 | 1108 | 294.3 |
| D | 12 | 6 | 1031487 | 3501.68 | 1135 | 1108 | 294.3 |
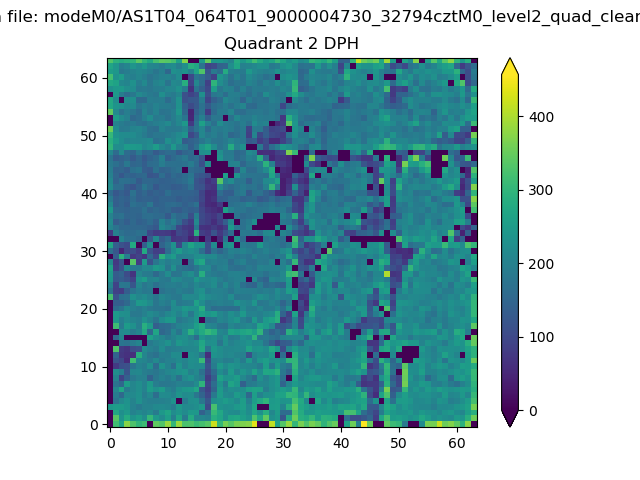
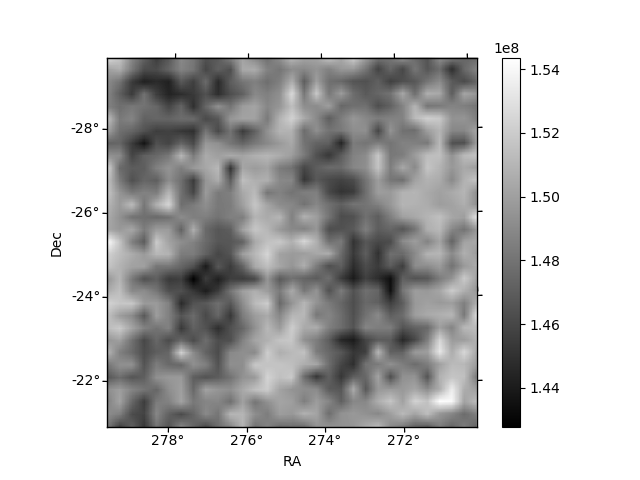
Histogram calculated using DETX and DETY for each event in the final _common_clean file
| Quadrant A | 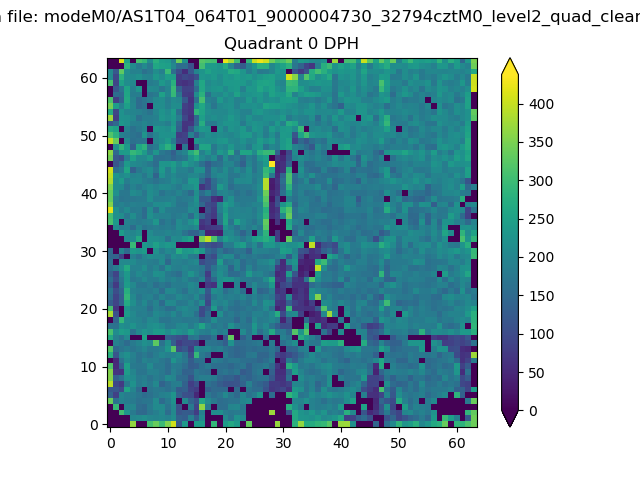 |
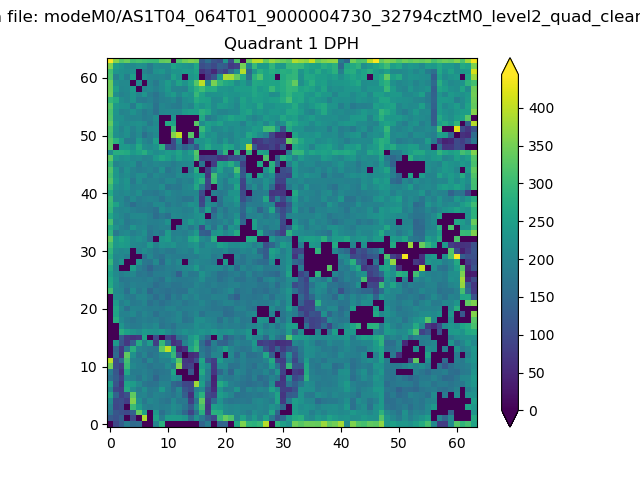 |
Quadrant B |
|---|---|---|---|
| Quadrant D | 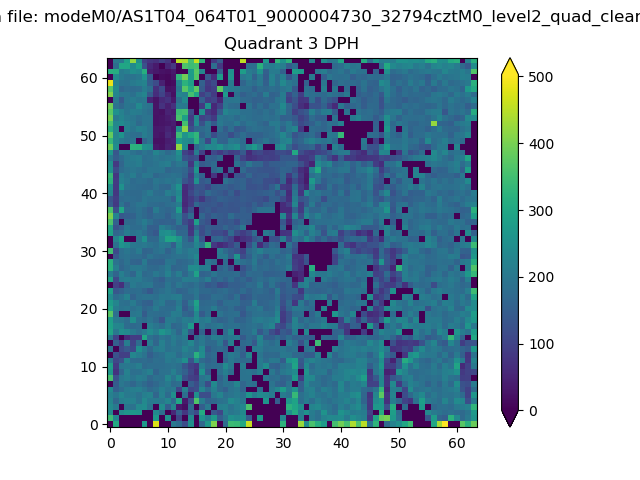 |
 |
Quadrant C |
| Plot type | Count rate plots | Images |
|---|---|---|
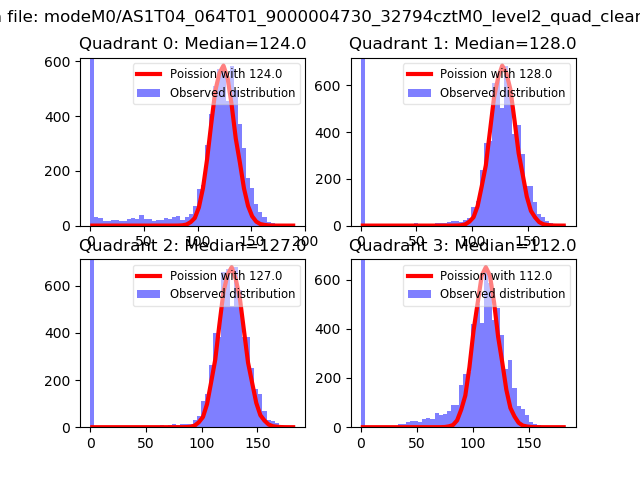
| Comparison with Poisson distribution Blue bars denote a histogram of data divided into 1 sec bins. Red curve is a Poisson curve with rate = median count rate of data. |
 |
 |
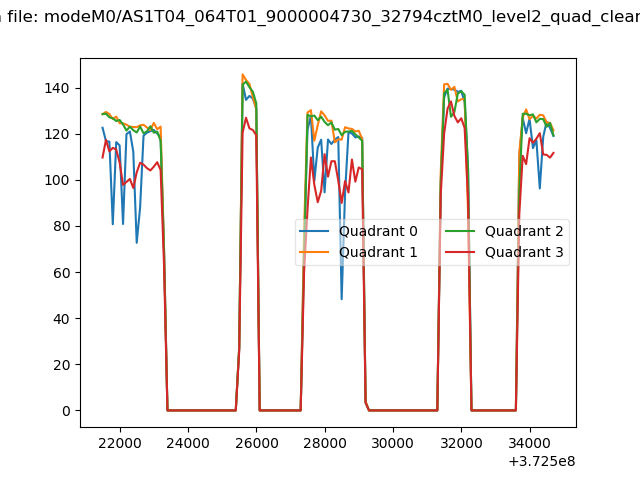
| Quadrant-wise count rates Data is divided into 100 sec bins |
 |
|
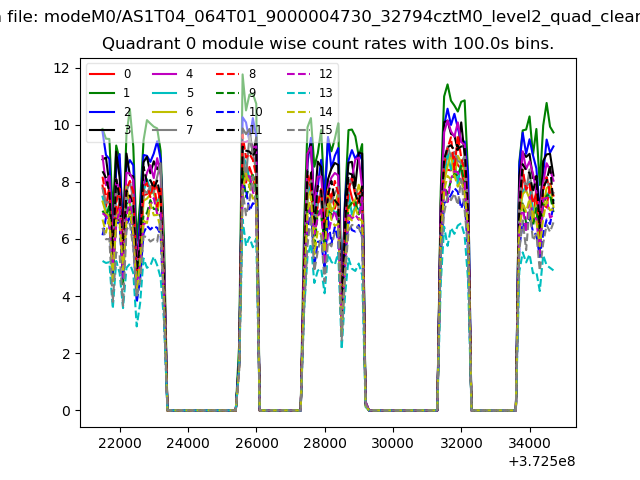
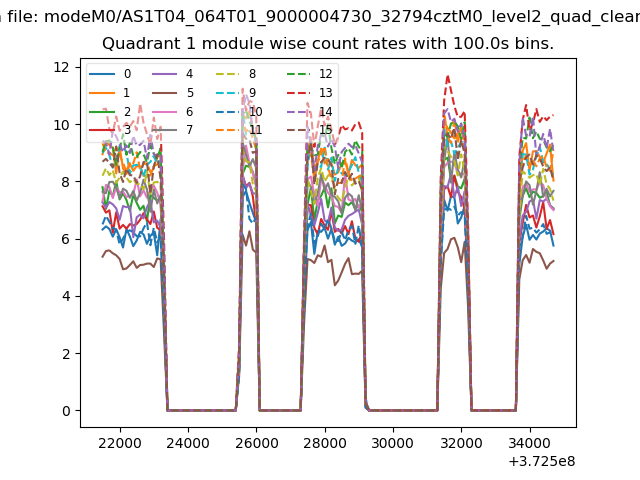
| Module-wise count rates for Quadrant A Data is divided into 100 sec bins |
 |
 |
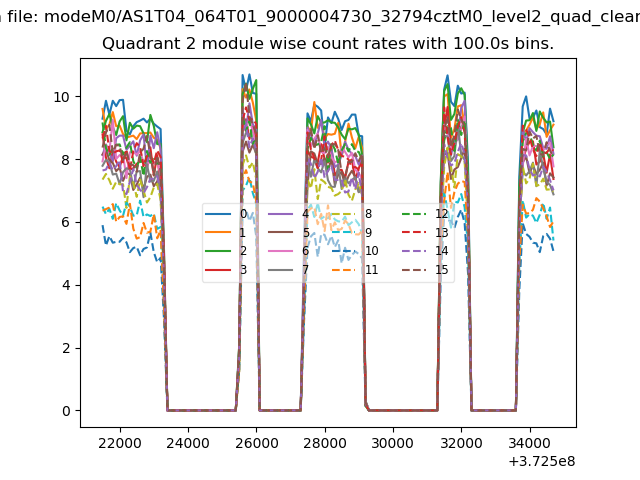
| Module-wise count rates for Quadrant B Data is divided into 100 sec bins |
 |
 |
| Module-wise count rates for Quadrant C Data is divided into 100 sec bins |
 |
 |
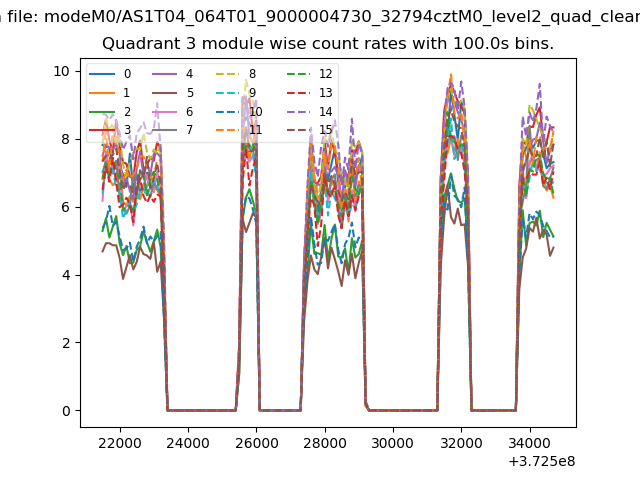
| Module-wise count rates for Quadrant D Data is divided into 100 sec bins |
 |
 |
| Parameter | Plot |
|---|---|
| CZT HV Monitor | 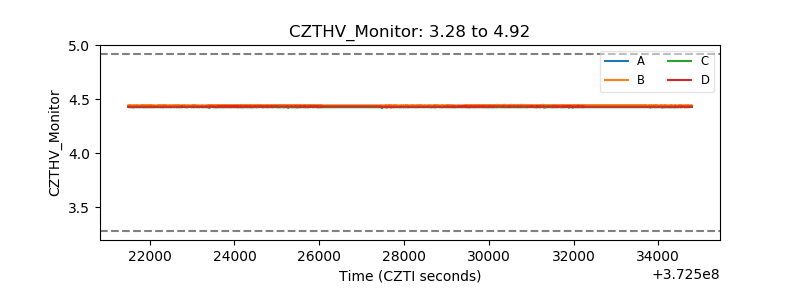 |
| D_VDD | 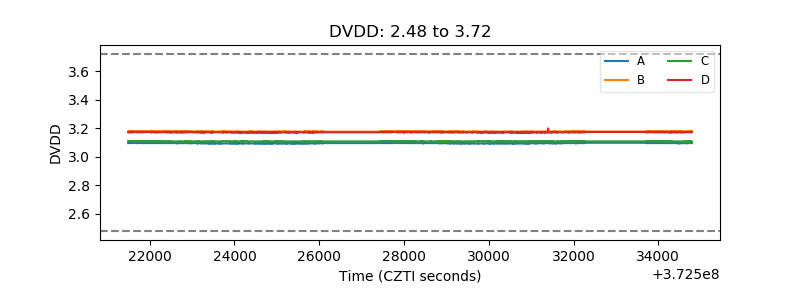 |
| Temperature 1 | 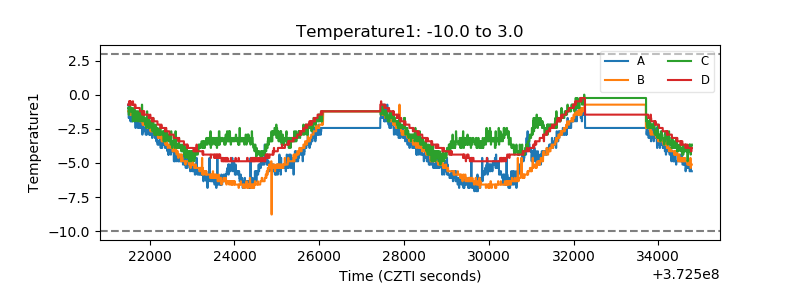 |
| Veto HV Monitor |  |
| Veto LLD | 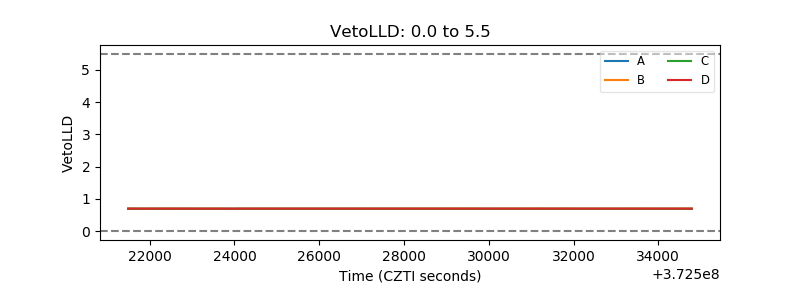 |
| Alpha Counter |  |
| _CPM_Rate | 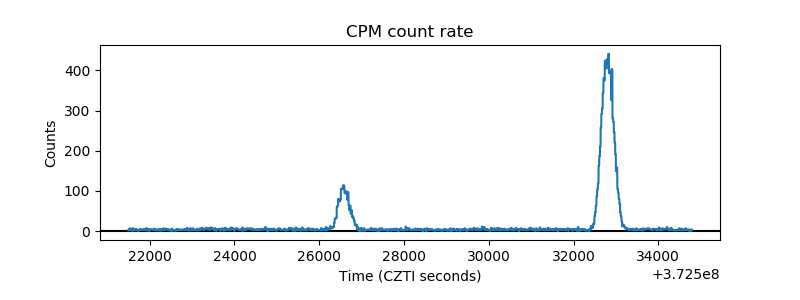 |
| CZT Counter | 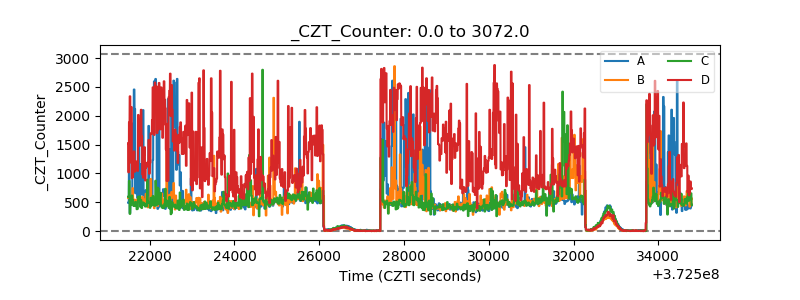 |
| +2.5 Volts monitor | 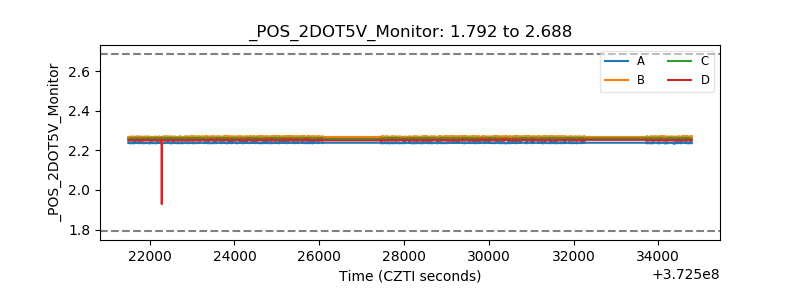 |
| +5 Volts monitor |  |
| _ROLL_ROT | 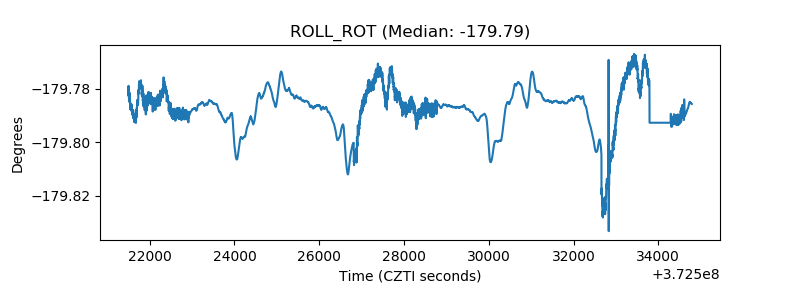 |
| _Roll_DEC | 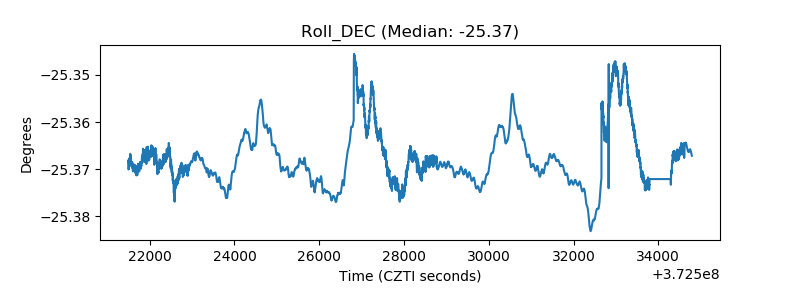 |
| _Roll_RA | 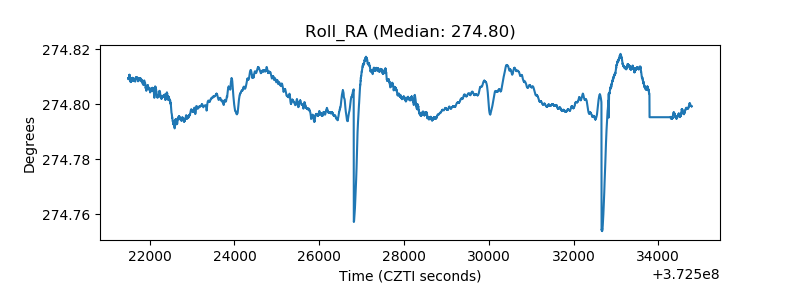 |
| Veto Counter | 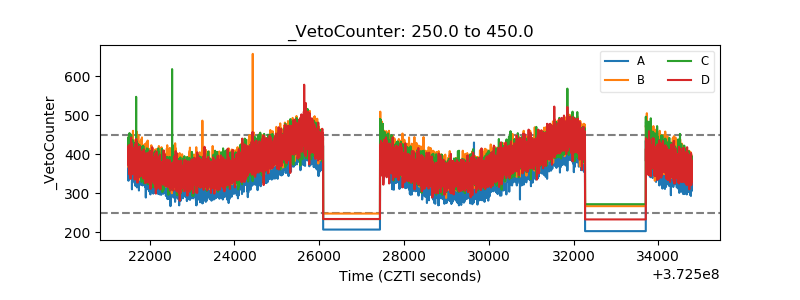 |