| Param | Original file | Final file |
|---|---|---|
| Filename | modeM0/AS1T04_064T01_9000004730_32799cztM0_level2.evt | modeM0/AS1T04_064T01_9000004730_32799cztM0_level2_quad_clean.evt |
| Size (bytes) | 545,932,800 | 51,010,560 |
| Size | 520.6 MB | 48.6 MB |
| Events in quadrant A | 3,062,239 | 297,438 |
| Events in quadrant B | 3,440,569 | 301,720 |
| Events in quadrant C | 2,914,401 | 304,227 |
| Events in quadrant D | 6,751,801 | 263,151 |
| Mode M9 | |||
|---|---|---|---|
| Quadrant | BADHDUFLAG | Total packets | Discarded packets |
| A | 0 | 24 | 0 |
| B | 0 | 24 | 0 |
| C | 0 | 24 | 0 |
| D | 0 | 25 | 0 |
| Mode SS | |||
|---|---|---|---|
| Quadrant | BADHDUFLAG | Total packets | Discarded packets |
| A | 0 | 112 | 0 |
| B | 0 | 112 | 0 |
| C | 0 | 112 | 0 |
| D | 0 | 112 | 0 |
| Mode M0 | |||
|---|---|---|---|
| Quadrant | BADHDUFLAG | Total packets | Discarded packets |
| A | 0 | 12153 | 3 |
| B | 0 | 13561 | 2 |
| C | 0 | 11610 | 2 |
| D | 0 | 23884 | 2 |
| Quadrant | Total seconds | Saturated seconds | Saturation percentage |
|---|---|---|---|
| A | 5382 | 46 | 0.854701% |
| B | 5382 | 130 | 2.415459% |
| C | 5382 | 40 | 0.743218% |
| D | 5382 | 605 | 11.241174% |
Noise dominated data is calculated using 1-second bins in cleaned event files. If a bin has >2000 counts, and if more than 50% of those come from <1% of pixels, then it is considered to be noise-dominated and hence unusable.
| Quadrant | # 1 sec bins | Bins with >0 counts | Bins with >2000 counts | High rate bins dominated by noise | Noise dominated (total time) | Noise dominated (detector-on time) | Marked lightcurve |
|---|---|---|---|---|---|---|---|
| A | 7324 | 5383 | 31 | 31 | 0.42% | 0.58% | 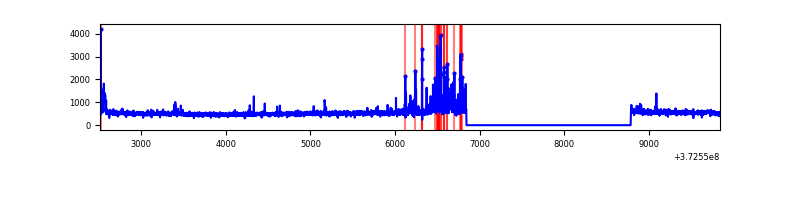 |
| B | 7324 | 5383 | 77 | 77 | 1.05% | 1.43% | 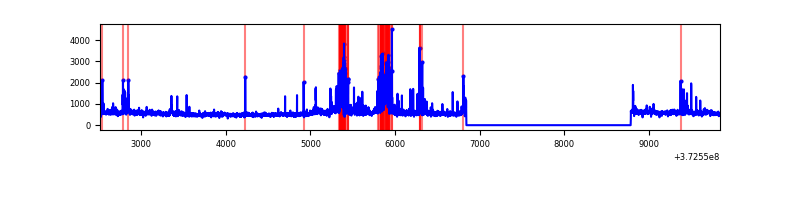 |
| C | 7324 | 5383 | 25 | 25 | 0.34% | 0.46% | 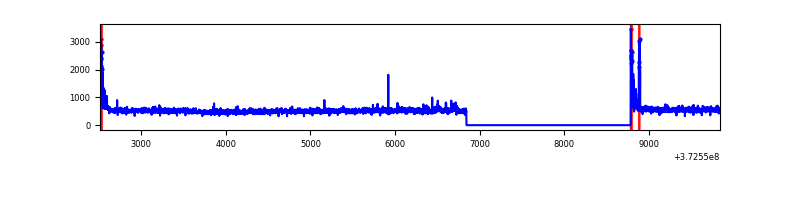 |
| D | 7324 | 5383 | 515 | 515 | 7.03% | 9.57% | 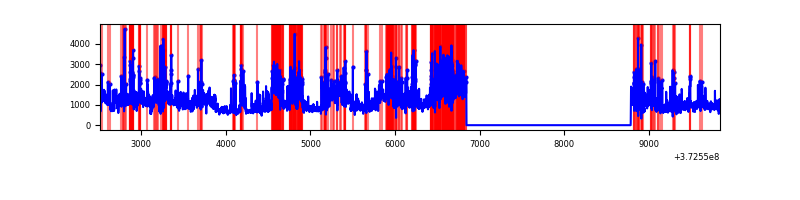 |
Top three noisy pixels from each quadrant. If the there are fewer than three noisy pixels in the level2.evt file, extra rows are filled as -1
| Pixel properties | Quadrant properties | ||||||
|---|---|---|---|---|---|---|---|
| Quadrant | DetID | PixID | Counts | Sigma | Mean | Median | Sigma |
| A | 15 | 237 | 151576 | 1072.76 | 702 | 692 | 140.6 |
| A | 14 | 238 | 73520 | 517.8 | 702 | 692 | 140.6 |
| A | 7 | 16 | 60771 | 427.15 | 702 | 692 | 140.6 |
| B | 5 | 172 | 335173 | 2559.83 | 707 | 693 | 130.7 |
| B | 0 | 189 | 129257 | 983.92 | 707 | 693 | 130.7 |
| B | 0 | 219 | 97803 | 743.19 | 707 | 693 | 130.7 |
| C | 0 | 10 | 137394 | 873.41 | 683 | 691 | 156.5 |
| C | 3 | 233 | 84292 | 534.14 | 683 | 691 | 156.5 |
| C | 15 | 159 | 5542 | 30.99 | 683 | 691 | 156.5 |
| D | 8 | 195 | 1846631 | 11800.49 | 655 | 641 | 156.4 |
| D | 10 | 203 | 714448 | 4563.01 | 655 | 641 | 156.4 |
| D | 2 | 152 | 465122 | 2969.19 | 655 | 641 | 156.4 |
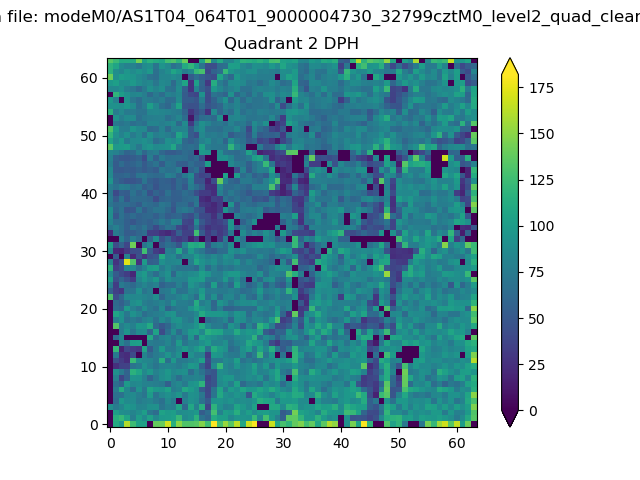
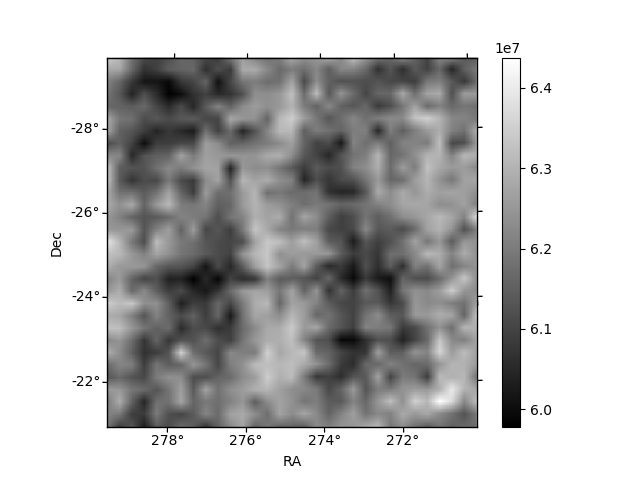
Histogram calculated using DETX and DETY for each event in the final _common_clean file
| Quadrant A | 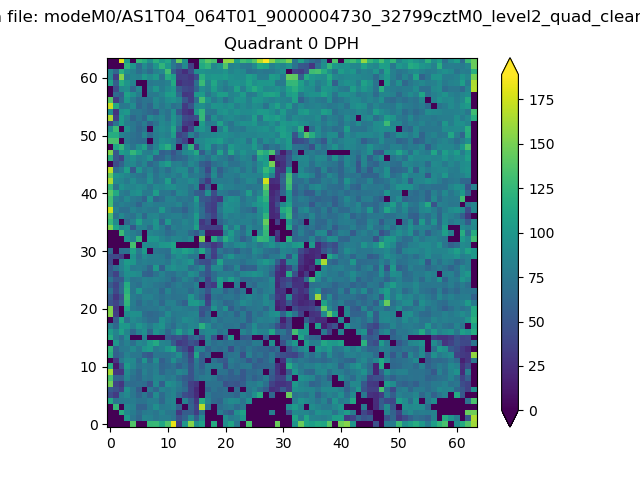 |
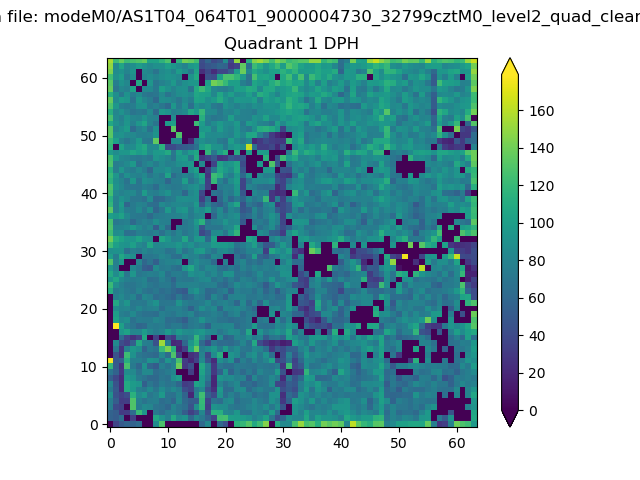 |
Quadrant B |
|---|---|---|---|
| Quadrant D | 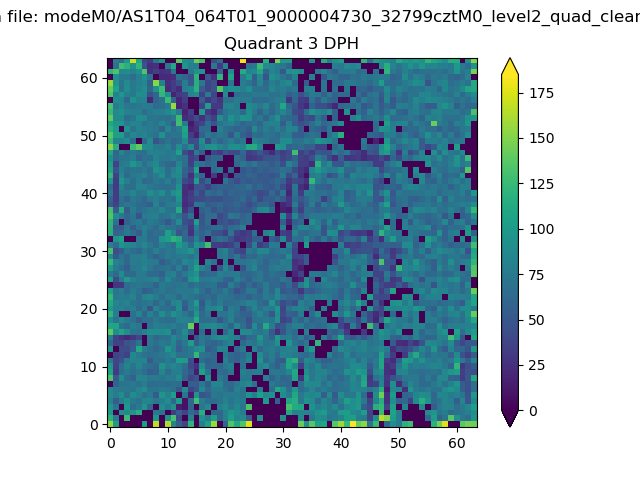 |
 |
Quadrant C |
| Plot type | Count rate plots | Images |
|---|---|---|
| Comparison with Poisson distribution Blue bars denote a histogram of data divided into 1 sec bins. Red curve is a Poisson curve with rate = median count rate of data. |
 |
 |
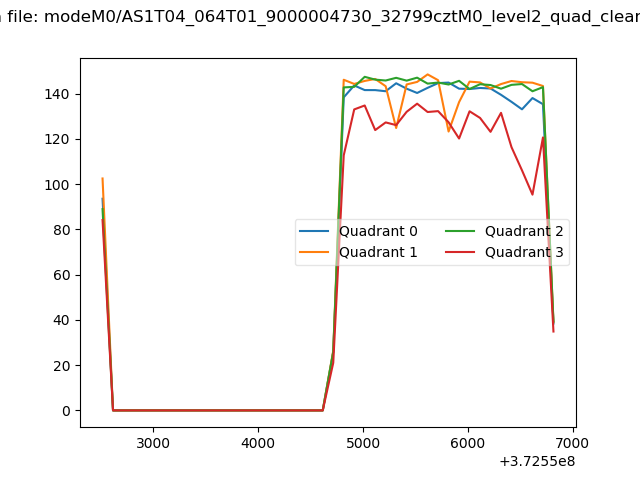
| Quadrant-wise count rates Data is divided into 100 sec bins |
 |
|
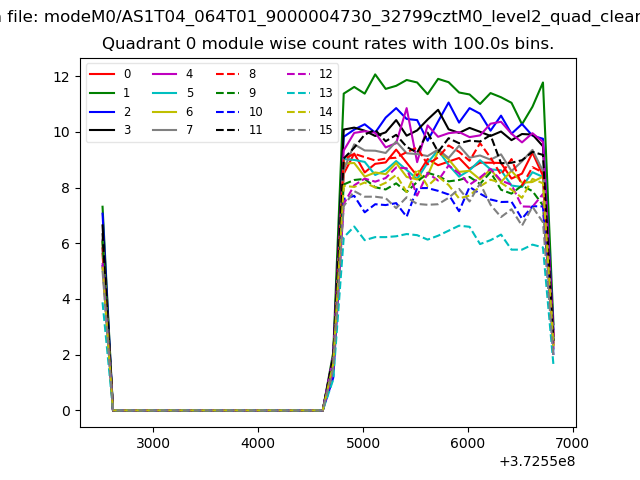
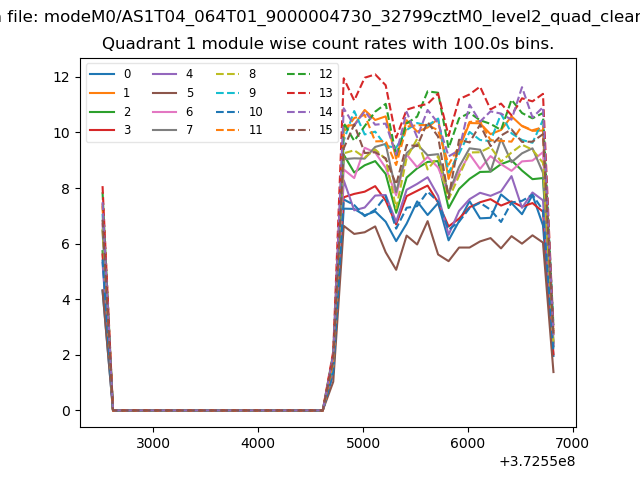
| Module-wise count rates for Quadrant A Data is divided into 100 sec bins |
 |
 |
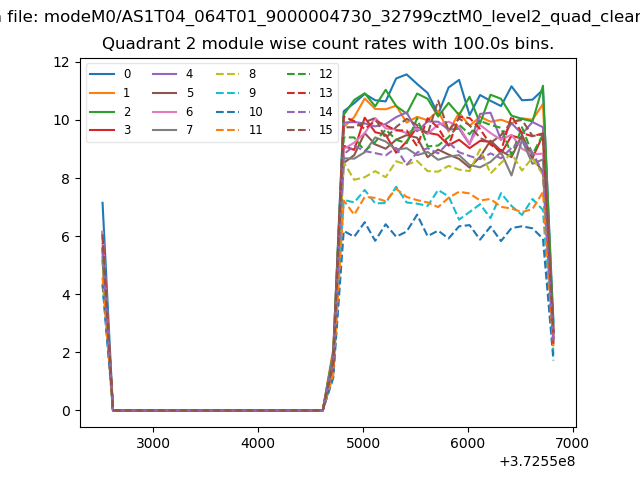
| Module-wise count rates for Quadrant B Data is divided into 100 sec bins |
 |
 |
| Module-wise count rates for Quadrant C Data is divided into 100 sec bins |
 |
 |
| Module-wise count rates for Quadrant D Data is divided into 100 sec bins |
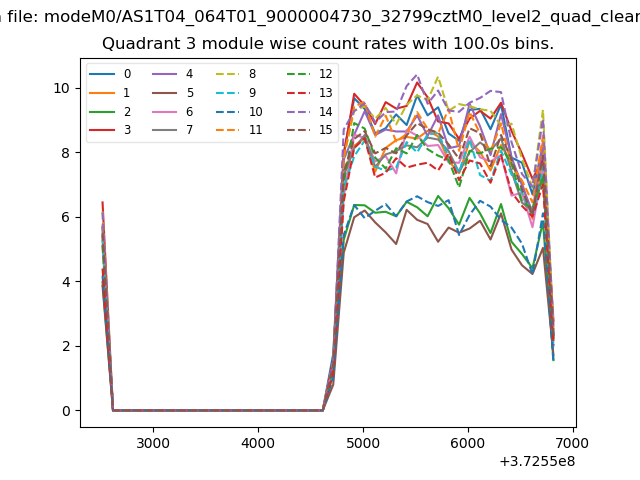 |
 |
| Parameter | Plot |
|---|---|
| CZT HV Monitor | 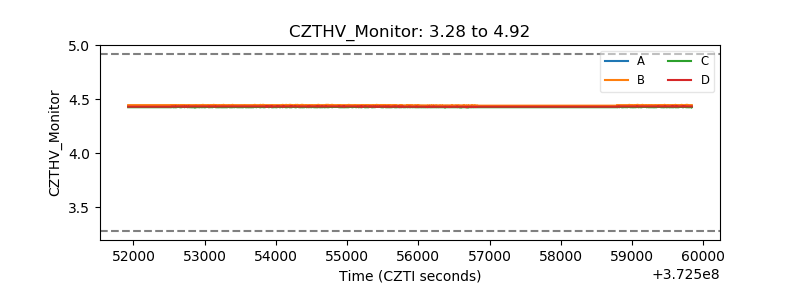 |
| D_VDD | 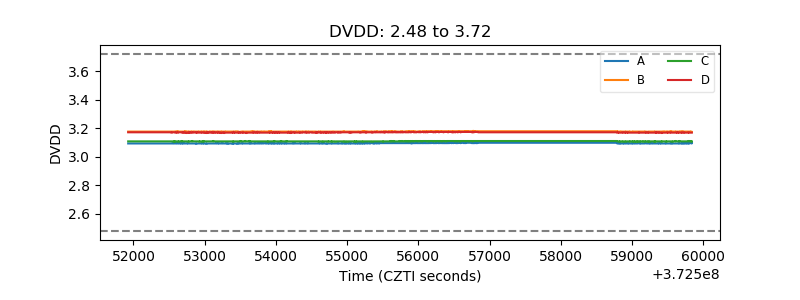 |
| Temperature 1 | 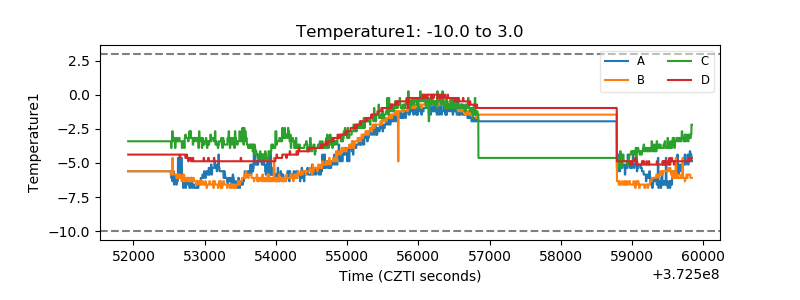 |
| Veto HV Monitor | 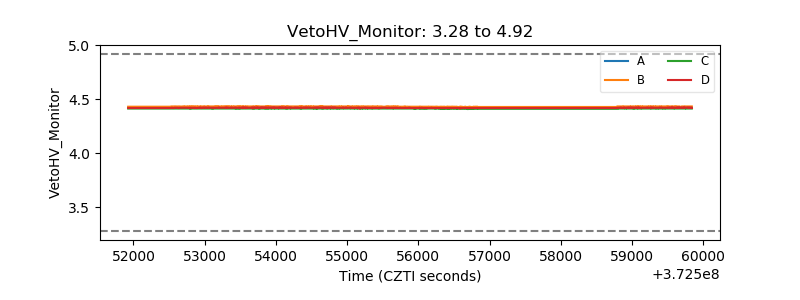 |
| Veto LLD | 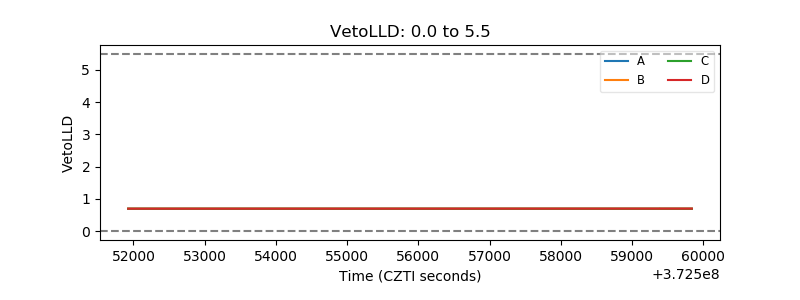 |
| Alpha Counter | 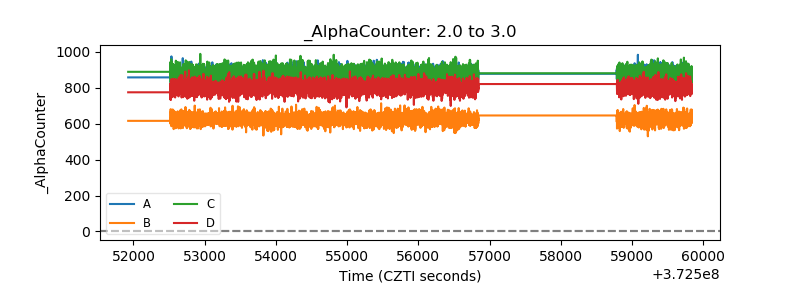 |
| _CPM_Rate |  |
| CZT Counter | 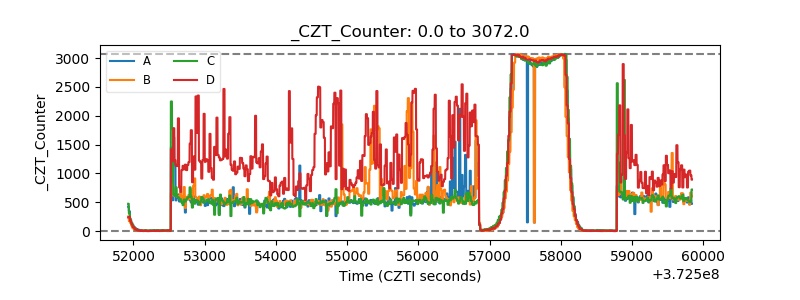 |
| +2.5 Volts monitor |  |
| +5 Volts monitor |  |
| _ROLL_ROT | 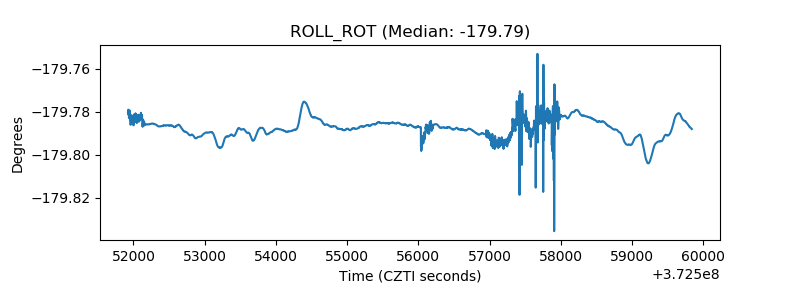 |
| _Roll_DEC | 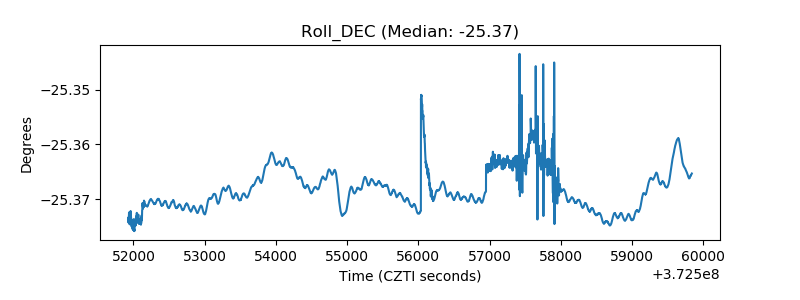 |
| _Roll_RA |  |
| Veto Counter | 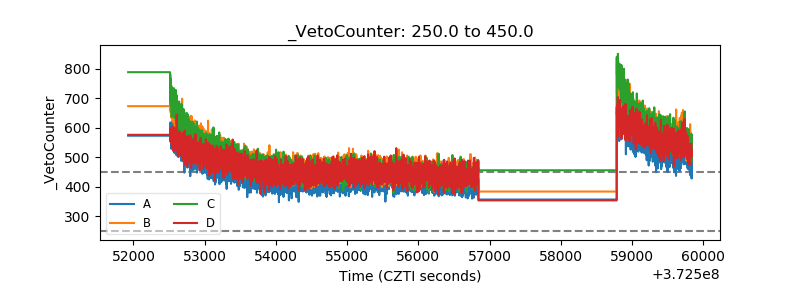 |