| Param | Original file | Final file |
|---|---|---|
| Filename | modeM0/AS1T04_064T01_9000004730_32800cztM0_level2.evt | modeM0/AS1T04_064T01_9000004730_32800cztM0_level2_quad_clean.evt |
| Size (bytes) | 564,929,280 | 54,881,280 |
| Size | 538.8 MB | 52.3 MB |
| Events in quadrant A | 3,756,696 | 300,811 |
| Events in quadrant B | 3,749,942 | 349,866 |
| Events in quadrant C | 2,988,027 | 357,568 |
| Events in quadrant D | 6,276,398 | 302,094 |
| Mode M9 | |||
|---|---|---|---|
| Quadrant | BADHDUFLAG | Total packets | Discarded packets |
| A | 0 | 21 | 0 |
| B | 0 | 21 | 0 |
| C | 0 | 21 | 0 |
| D | 0 | 21 | 0 |
| Mode SS | |||
|---|---|---|---|
| Quadrant | BADHDUFLAG | Total packets | Discarded packets |
| A | 0 | 100 | 0 |
| B | 0 | 100 | 0 |
| C | 0 | 100 | 0 |
| D | 0 | 100 | 0 |
| Mode M0 | |||
|---|---|---|---|
| Quadrant | BADHDUFLAG | Total packets | Discarded packets |
| A | 0 | 13993 | 2 |
| B | 0 | 14406 | 1 |
| C | 0 | 11916 | 1 |
| D | 0 | 22194 | 1 |
| Quadrant | Total seconds | Saturated seconds | Saturation percentage |
|---|---|---|---|
| A | 5005 | 544 | 10.869131% |
| B | 5005 | 255 | 5.094905% |
| C | 5005 | 40 | 0.799201% |
| D | 5005 | 614 | 12.267732% |
Noise dominated data is calculated using 1-second bins in cleaned event files. If a bin has >2000 counts, and if more than 50% of those come from <1% of pixels, then it is considered to be noise-dominated and hence unusable.
| Quadrant | # 1 sec bins | Bins with >0 counts | Bins with >2000 counts | High rate bins dominated by noise | Noise dominated (total time) | Noise dominated (detector-on time) | Marked lightcurve |
|---|---|---|---|---|---|---|---|
| A | 7038 | 5006 | 311 | 311 | 4.42% | 6.21% | 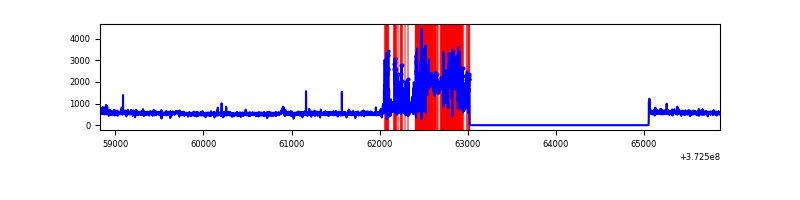 |
| B | 7038 | 5006 | 143 | 143 | 2.03% | 2.86% |  |
| C | 7038 | 5006 | 27 | 27 | 0.38% | 0.54% | 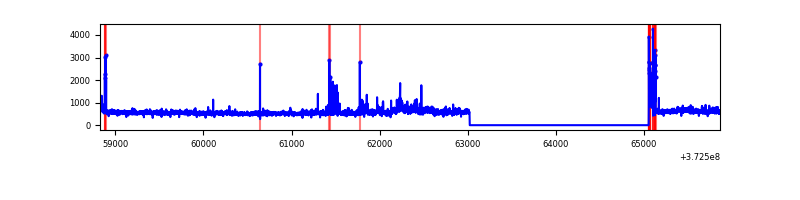 |
| D | 7038 | 5006 | 525 | 525 | 7.46% | 10.49% | 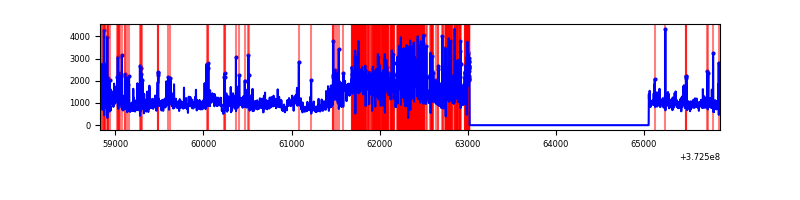 |
Top three noisy pixels from each quadrant. If the there are fewer than three noisy pixels in the level2.evt file, extra rows are filled as -1
| Pixel properties | Quadrant properties | ||||||
|---|---|---|---|---|---|---|---|
| Quadrant | DetID | PixID | Counts | Sigma | Mean | Median | Sigma |
| A | 15 | 237 | 1162720 | 9087.11 | 641 | 632 | 127.9 |
| A | 14 | 238 | 48314 | 372.86 | 641 | 632 | 127.9 |
| A | 14 | 63 | 17760 | 133.93 | 641 | 632 | 127.9 |
| B | 5 | 172 | 619936 | 4943.22 | 677 | 663 | 125.3 |
| B | 0 | 219 | 327834 | 2611.58 | 677 | 663 | 125.3 |
| B | 0 | 189 | 62235 | 491.49 | 677 | 663 | 125.3 |
| C | 3 | 233 | 196539 | 1310.99 | 659 | 666 | 149.4 |
| C | 0 | 10 | 161579 | 1077.0 | 659 | 666 | 149.4 |
| C | 14 | 67 | 19410 | 125.45 | 659 | 666 | 149.4 |
| D | 8 | 195 | 2052175 | 13423.68 | 634 | 623 | 152.8 |
| D | 10 | 203 | 597512 | 3905.55 | 634 | 623 | 152.8 |
| D | 2 | 250 | 543558 | 3552.52 | 634 | 623 | 152.8 |
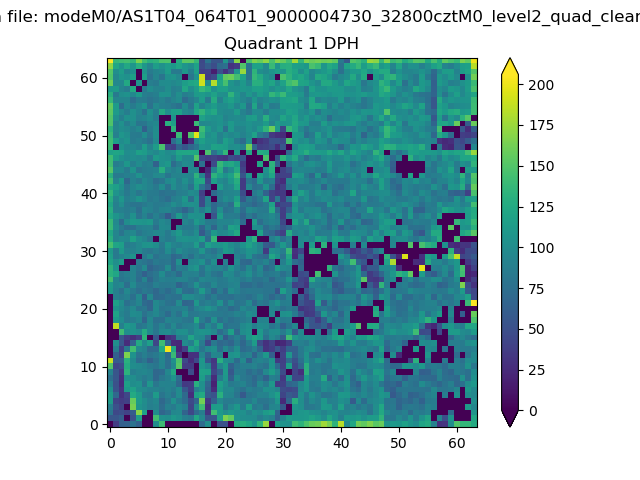
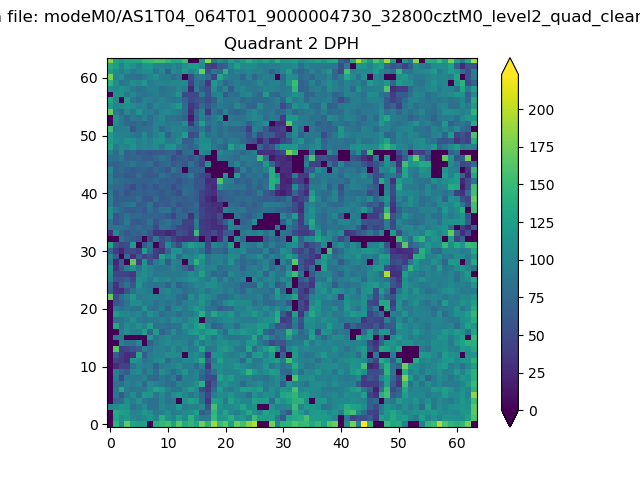
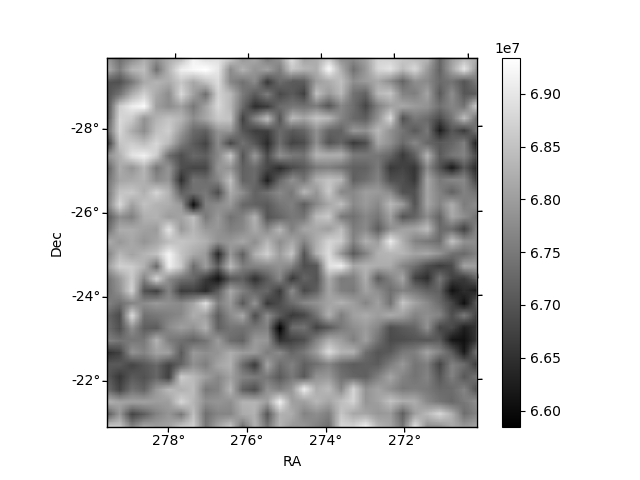
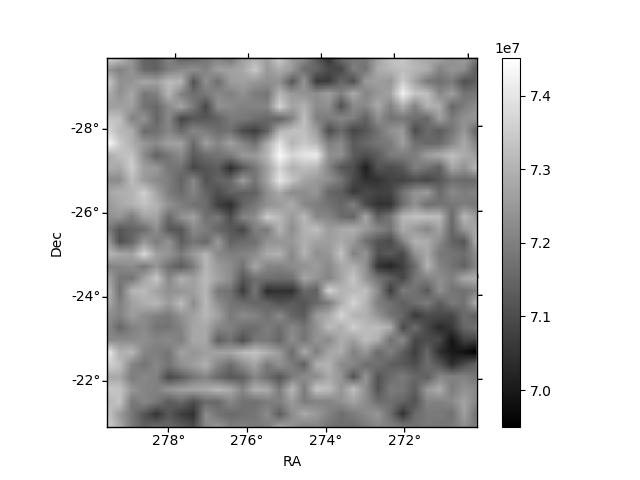
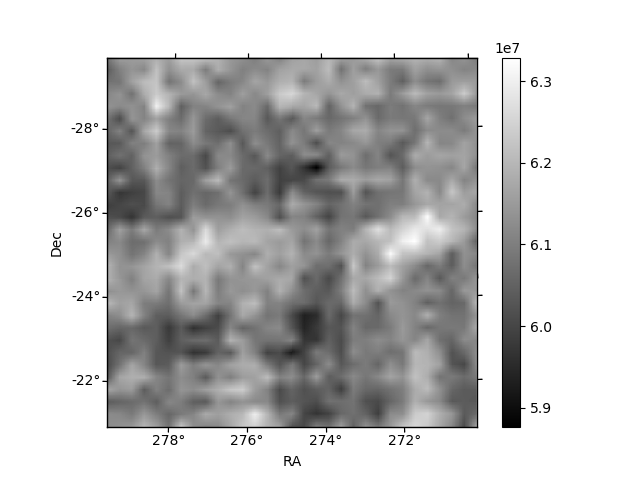
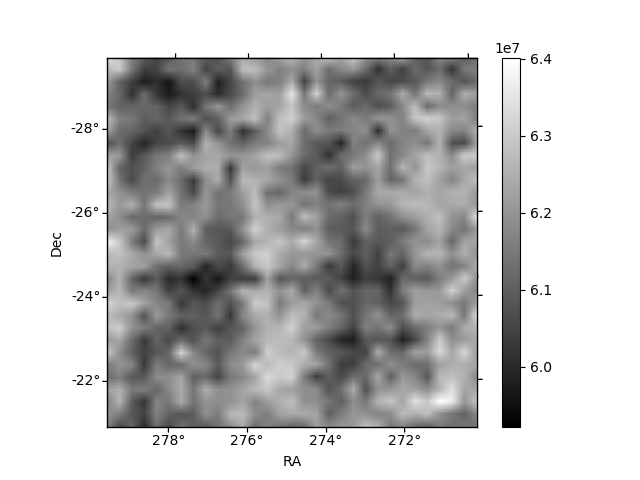
Histogram calculated using DETX and DETY for each event in the final _common_clean file
| Quadrant A | 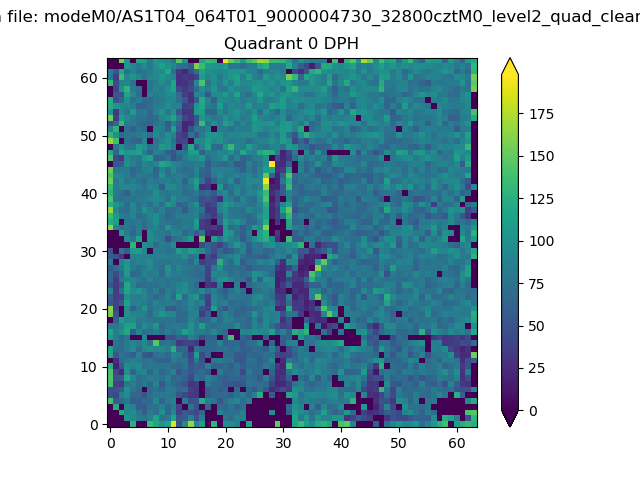 |
 |
Quadrant B |
|---|---|---|---|
| Quadrant D | 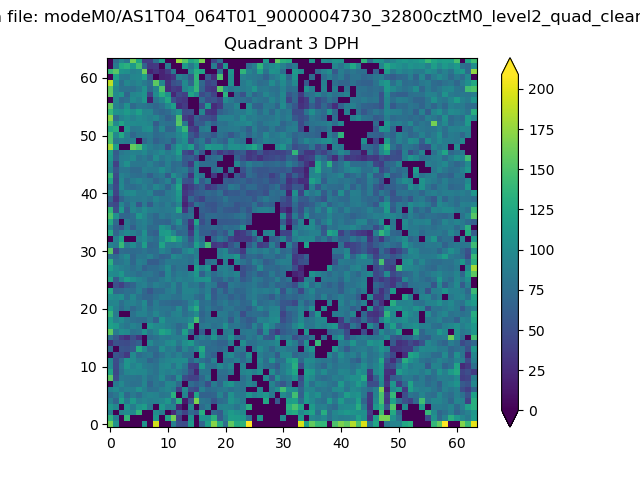 |
 |
Quadrant C |
| Plot type | Count rate plots | Images |
|---|---|---|
| Comparison with Poisson distribution Blue bars denote a histogram of data divided into 1 sec bins. Red curve is a Poisson curve with rate = median count rate of data. |
 |
 |
| Quadrant-wise count rates Data is divided into 100 sec bins |
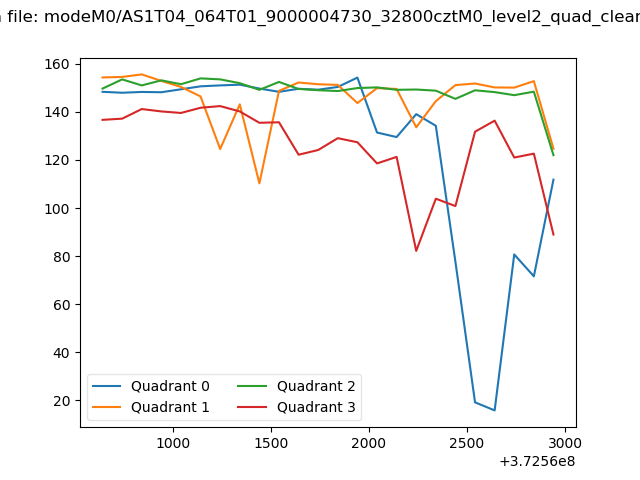 |
|
| Module-wise count rates for Quadrant A Data is divided into 100 sec bins |
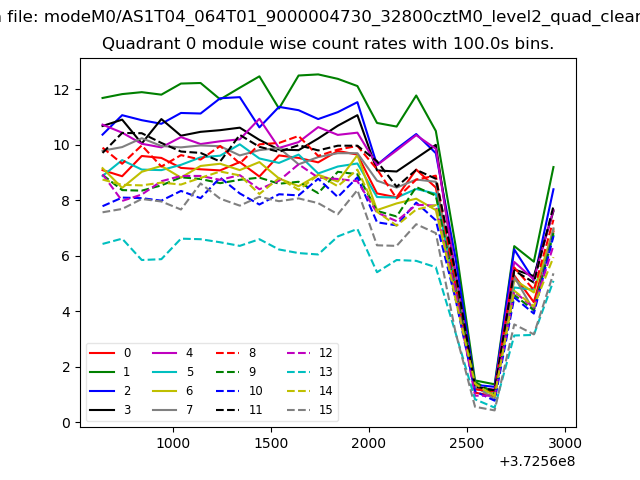 |
 |
| Module-wise count rates for Quadrant B Data is divided into 100 sec bins |
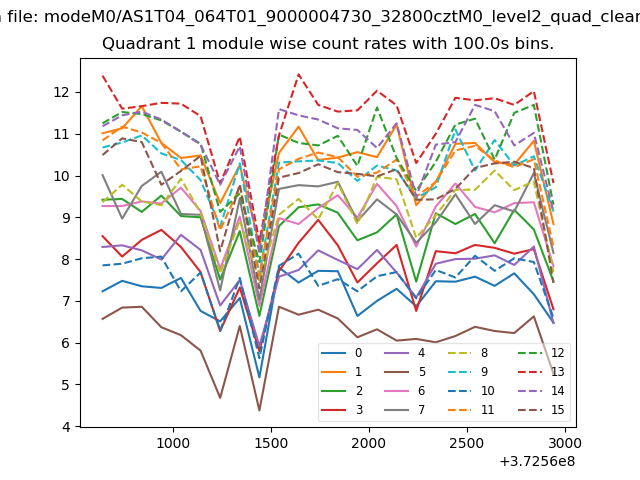 |
 |
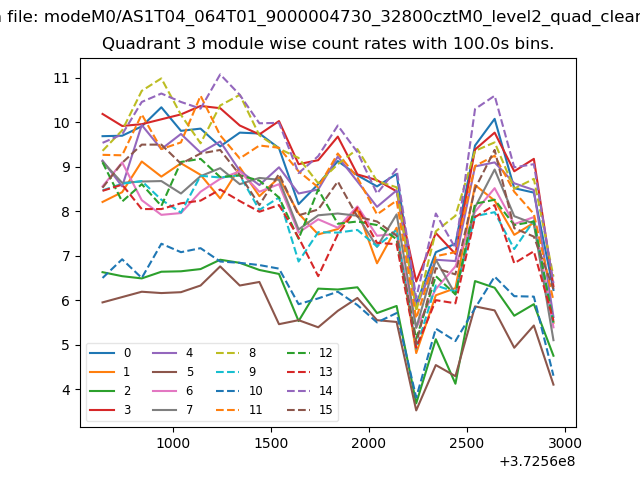
| Module-wise count rates for Quadrant C Data is divided into 100 sec bins |
 |
 |
| Module-wise count rates for Quadrant D Data is divided into 100 sec bins |
 |
 |
| Parameter | Plot |
|---|---|
| CZT HV Monitor |  |
| D_VDD | 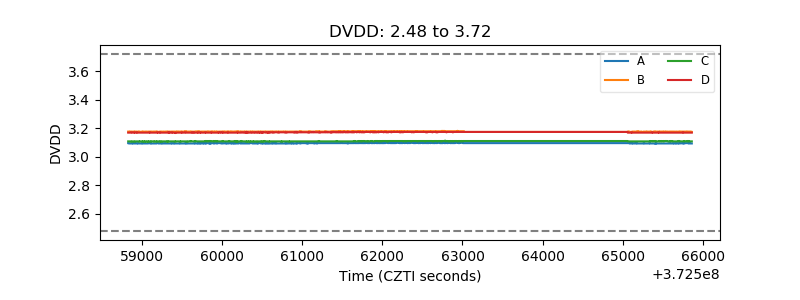 |
| Temperature 1 | 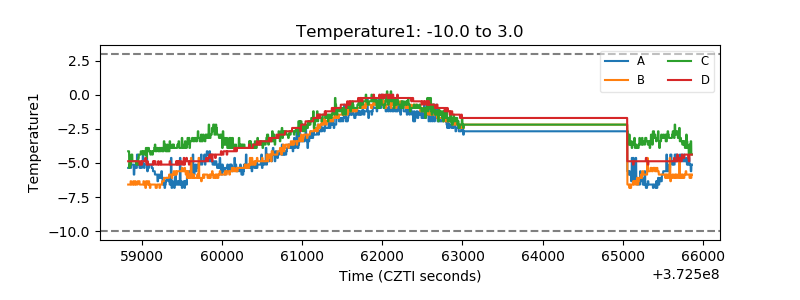 |
| Veto HV Monitor | 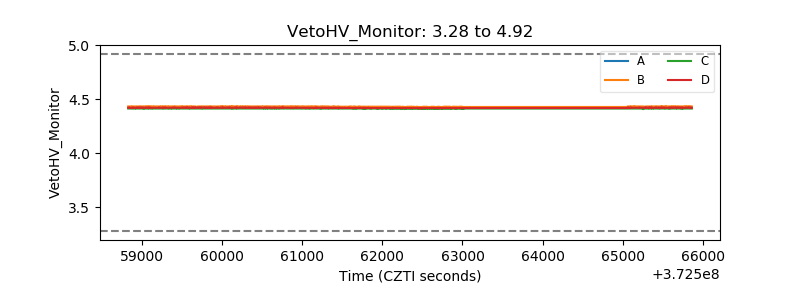 |
| Veto LLD | 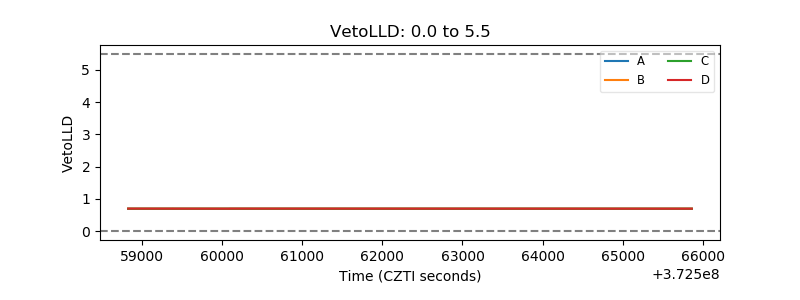 |
| Alpha Counter | 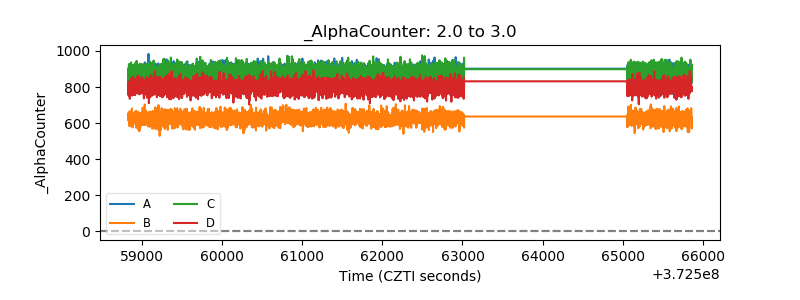 |
| _CPM_Rate | 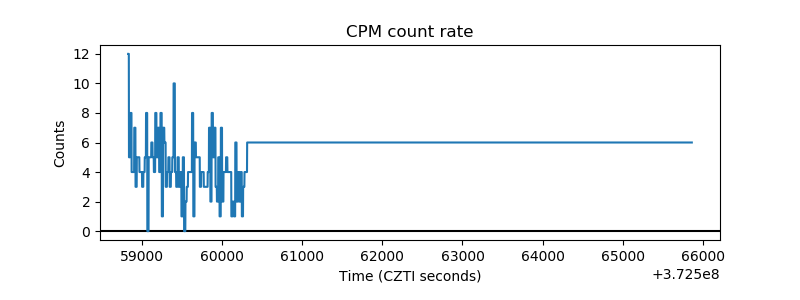 |
| CZT Counter | 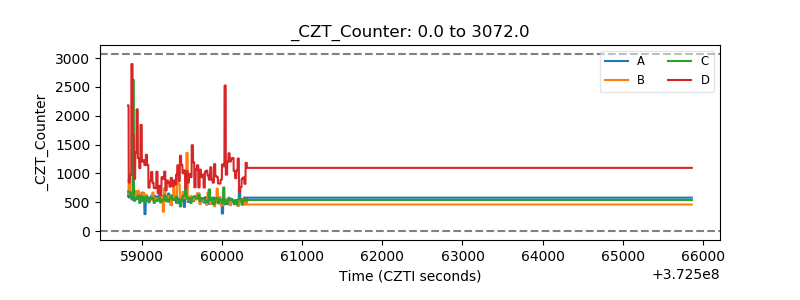 |
| +2.5 Volts monitor | 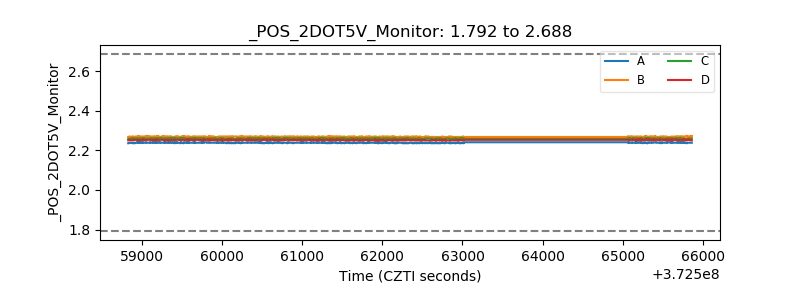 |
| +5 Volts monitor |  |
| _ROLL_ROT | 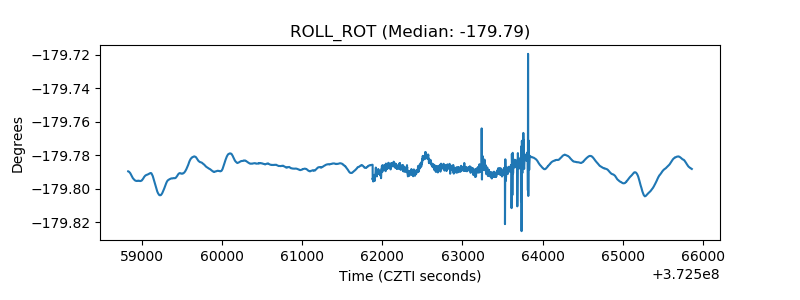 |
| _Roll_DEC | 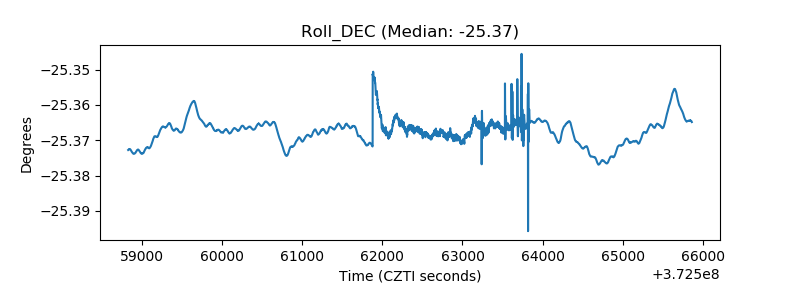 |
| _Roll_RA | 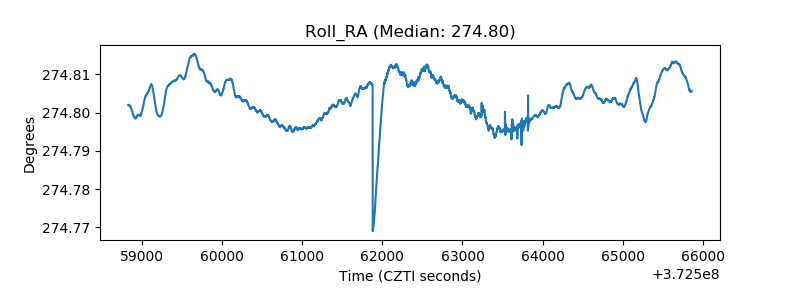 |
| Veto Counter | 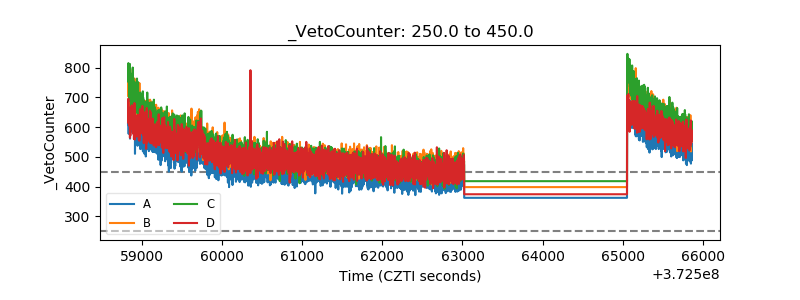 |