| Param | Original file | Final file |
|---|---|---|
| Filename | modeM0/AS1T04_064T01_9000004730_32802cztM0_level2.evt | modeM0/AS1T04_064T01_9000004730_32802cztM0_level2_quad_clean.evt |
| Size (bytes) | 527,299,200 | 75,179,520 |
| Size | 502.9 MB | 71.7 MB |
| Events in quadrant A | 2,792,930 | 496,369 |
| Events in quadrant B | 3,275,109 | 502,277 |
| Events in quadrant C | 3,972,075 | 478,891 |
| Events in quadrant D | 5,595,192 | 452,189 |
| Mode M9 | |||
|---|---|---|---|
| Quadrant | BADHDUFLAG | Total packets | Discarded packets |
| A | 0 | 29 | 0 |
| B | 0 | 29 | 0 |
| C | 0 | 29 | 0 |
| D | 0 | 30 | 0 |
| Mode SS | |||
|---|---|---|---|
| Quadrant | BADHDUFLAG | Total packets | Discarded packets |
| A | 0 | 102 | 0 |
| B | 0 | 102 | 0 |
| C | 0 | 102 | 0 |
| D | 0 | 102 | 0 |
| Mode M0 | |||
|---|---|---|---|
| Quadrant | BADHDUFLAG | Total packets | Discarded packets |
| A | 0 | 10979 | 3 |
| B | 0 | 12839 | 2 |
| C | 0 | 14792 | 2 |
| D | 0 | 20132 | 2 |
| Quadrant | Total seconds | Saturated seconds | Saturation percentage |
|---|---|---|---|
| A | 4937 | 40 | 0.810209% |
| B | 4937 | 89 | 1.802714% |
| C | 4937 | 361 | 7.312133% |
| D | 4937 | 268 | 5.428398% |
Noise dominated data is calculated using 1-second bins in cleaned event files. If a bin has >2000 counts, and if more than 50% of those come from <1% of pixels, then it is considered to be noise-dominated and hence unusable.
| Quadrant | # 1 sec bins | Bins with >0 counts | Bins with >2000 counts | High rate bins dominated by noise | Noise dominated (total time) | Noise dominated (detector-on time) | Marked lightcurve |
|---|---|---|---|---|---|---|---|
| A | 7060 | 4938 | 11 | 11 | 0.16% | 0.22% | 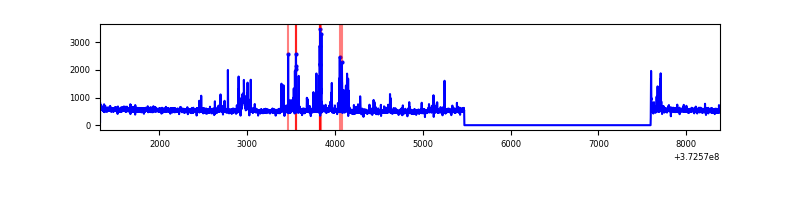 |
| B | 7060 | 4938 | 55 | 55 | 0.78% | 1.11% | 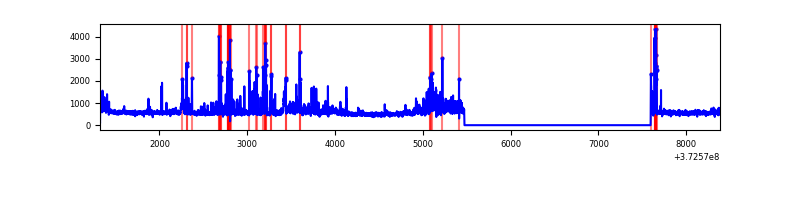 |
| C | 7060 | 4938 | 309 | 309 | 4.38% | 6.26% | 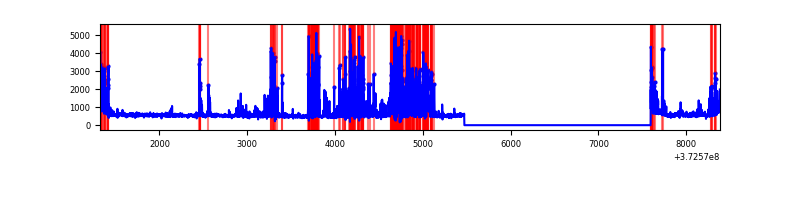 |
| D | 7060 | 4938 | 267 | 267 | 3.78% | 5.41% | 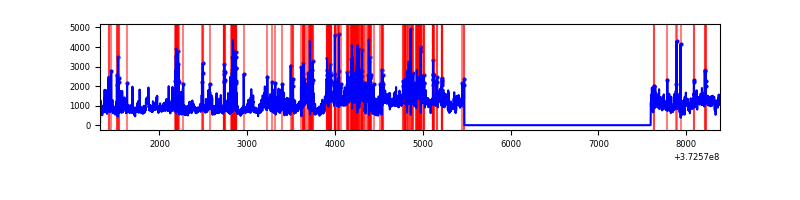 |
Top three noisy pixels from each quadrant. If the there are fewer than three noisy pixels in the level2.evt file, extra rows are filled as -1
| Pixel properties | Quadrant properties | ||||||
|---|---|---|---|---|---|---|---|
| Quadrant | DetID | PixID | Counts | Sigma | Mean | Median | Sigma |
| A | 14 | 238 | 99867 | 763.59 | 654 | 645 | 129.9 |
| A | 15 | 237 | 49962 | 379.53 | 654 | 645 | 129.9 |
| A | 10 | 228 | 36789 | 278.16 | 654 | 645 | 129.9 |
| B | 5 | 172 | 299488 | 2464.51 | 649 | 637 | 121.3 |
| B | 0 | 219 | 244015 | 2007.04 | 649 | 637 | 121.3 |
| B | 15 | 54 | 79564 | 650.88 | 649 | 637 | 121.3 |
| C | 0 | 10 | 1434095 | 10141.91 | 617 | 624 | 141.3 |
| C | 0 | 207 | 33091 | 229.71 | 617 | 624 | 141.3 |
| C | 3 | 233 | 23873 | 164.49 | 617 | 624 | 141.3 |
| D | 8 | 195 | 1957895 | 13035.13 | 622 | 610 | 150.2 |
| D | 2 | 250 | 243318 | 1616.39 | 622 | 610 | 150.2 |
| D | 2 | 249 | 188988 | 1254.56 | 622 | 610 | 150.2 |
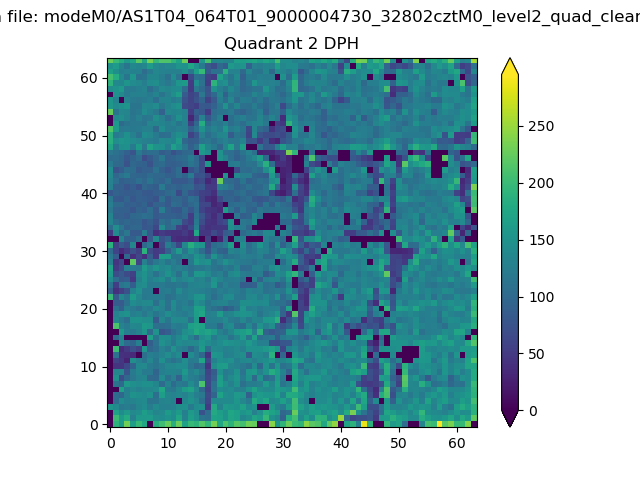
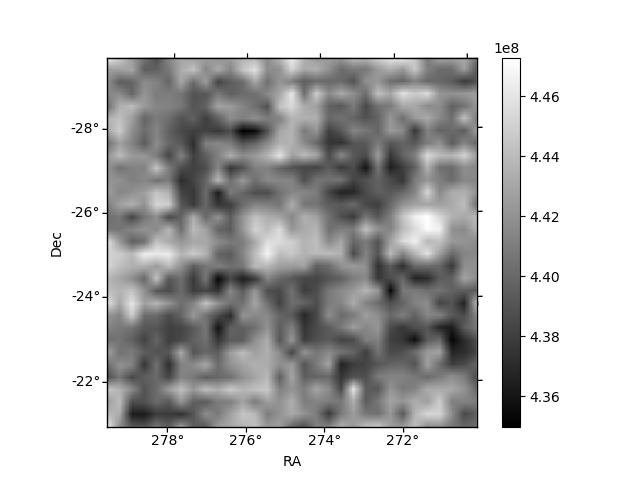
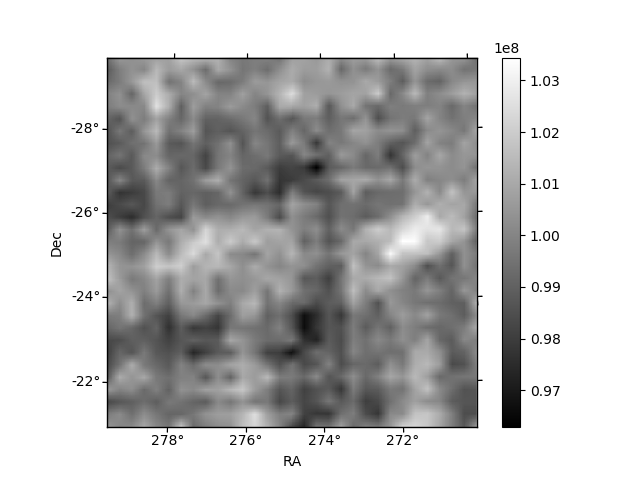
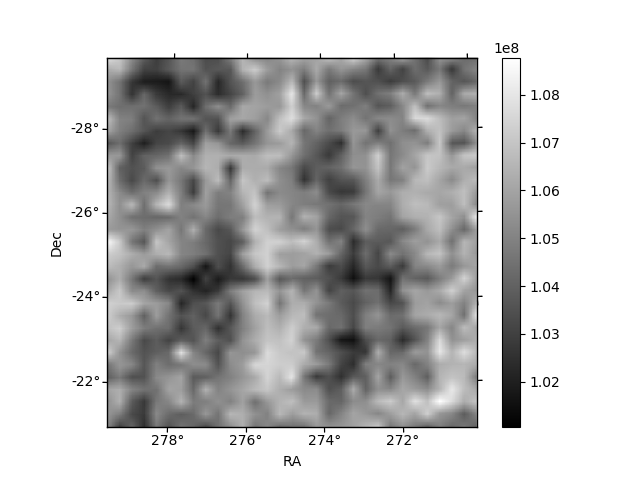
Histogram calculated using DETX and DETY for each event in the final _common_clean file
| Quadrant A | 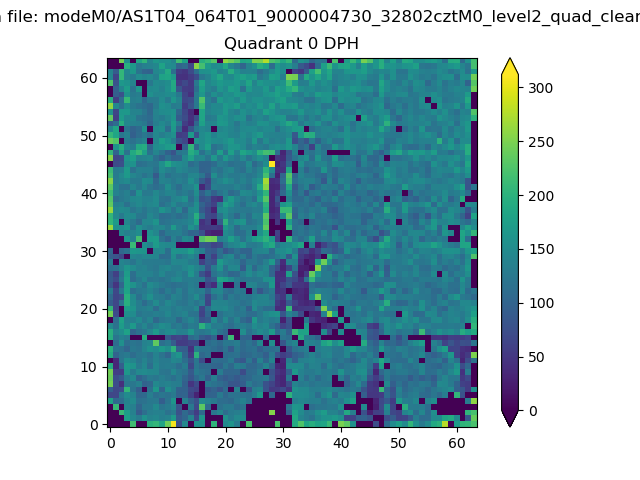 |
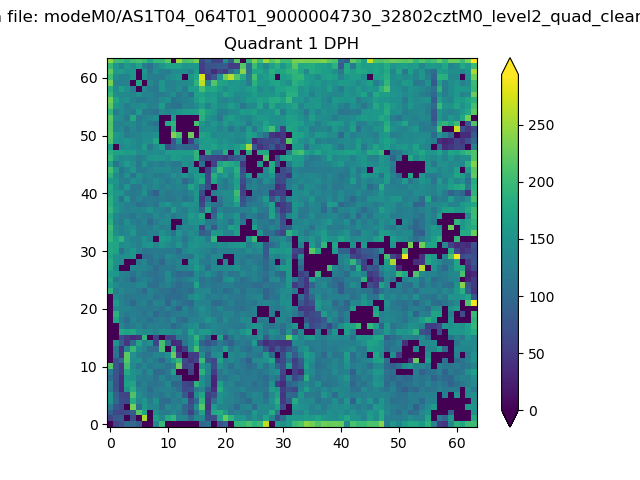 |
Quadrant B |
|---|---|---|---|
| Quadrant D | 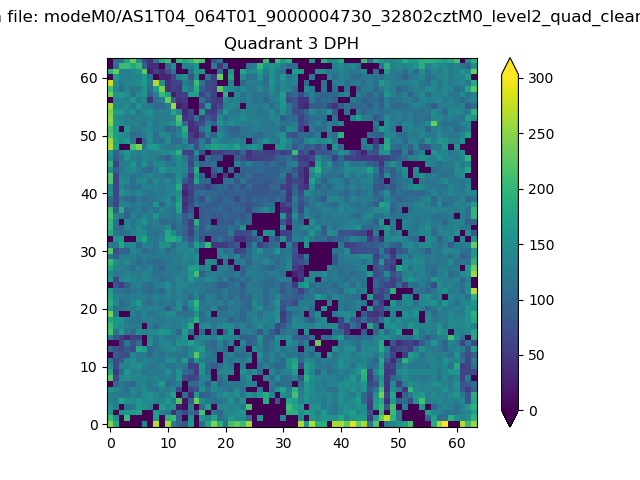 |
 |
Quadrant C |
| Plot type | Count rate plots | Images |
|---|---|---|
| Comparison with Poisson distribution Blue bars denote a histogram of data divided into 1 sec bins. Red curve is a Poisson curve with rate = median count rate of data. |
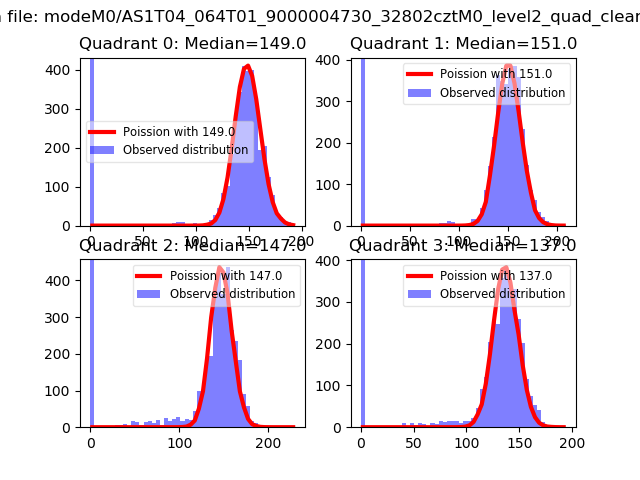 |
 |
| Quadrant-wise count rates Data is divided into 100 sec bins |
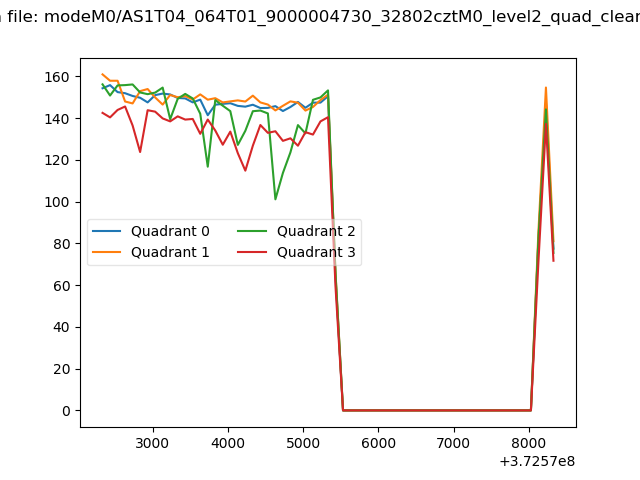 |
|
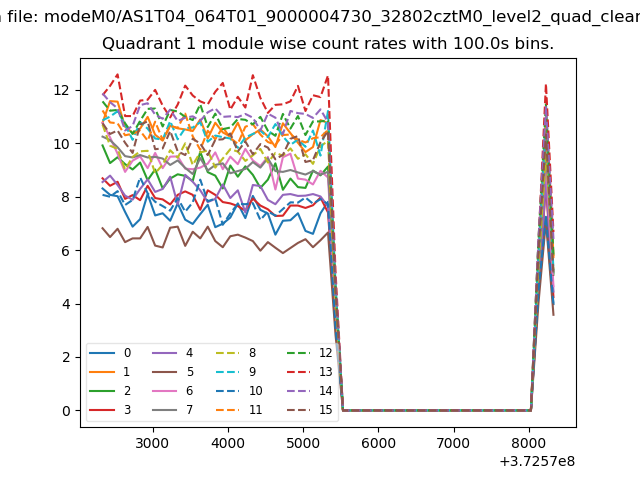
| Module-wise count rates for Quadrant A Data is divided into 100 sec bins |
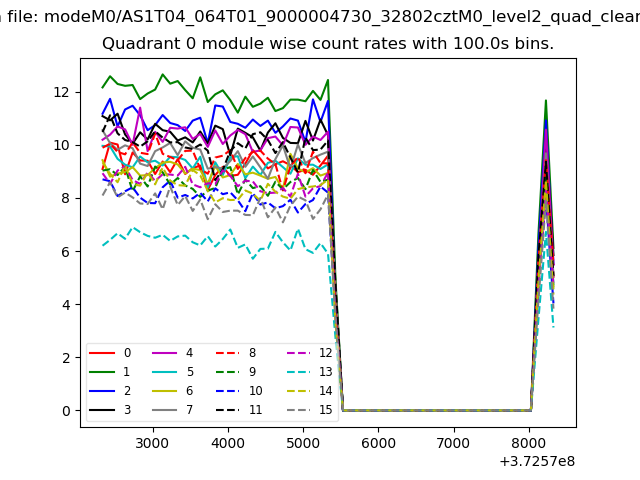 |
 |
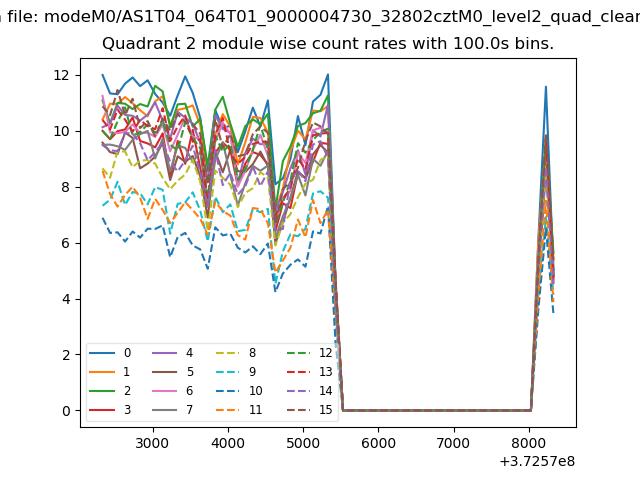
| Module-wise count rates for Quadrant B Data is divided into 100 sec bins |
 |
 |
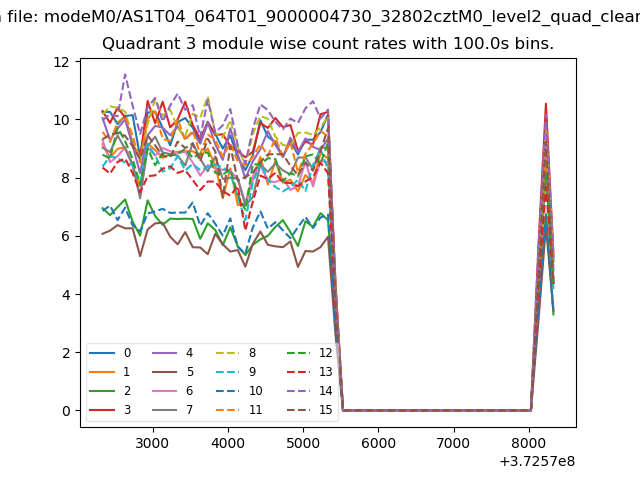
| Module-wise count rates for Quadrant C Data is divided into 100 sec bins |
 |
 |
| Module-wise count rates for Quadrant D Data is divided into 100 sec bins |
 |
 |
| Parameter | Plot |
|---|---|
| CZT HV Monitor |  |
| D_VDD | 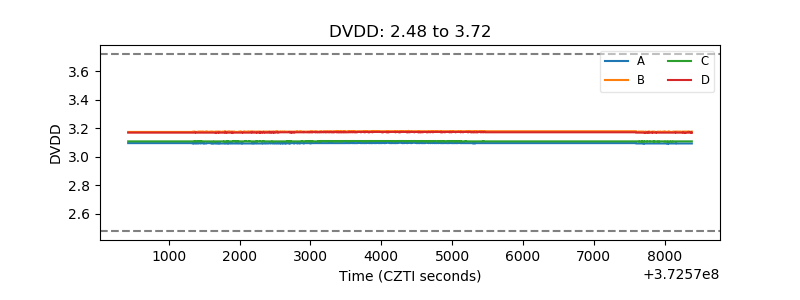 |
| Temperature 1 | 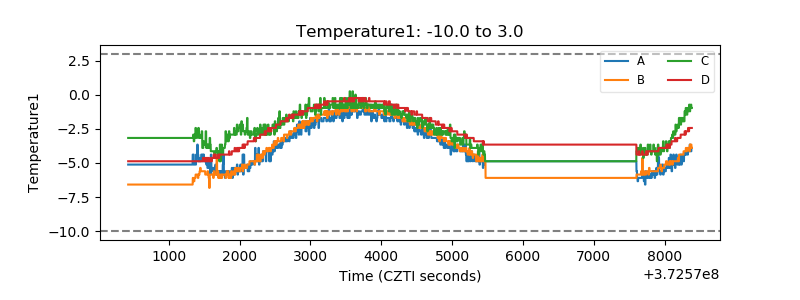 |
| Veto HV Monitor | 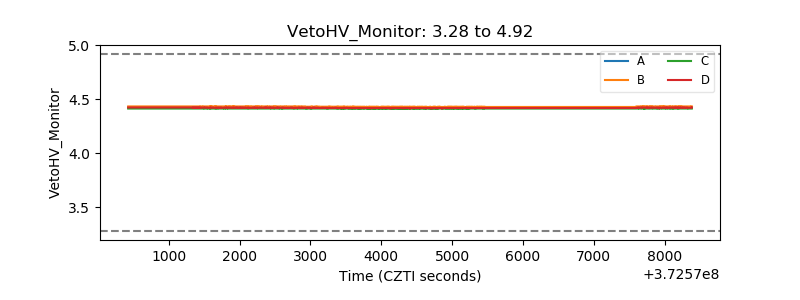 |
| Veto LLD | 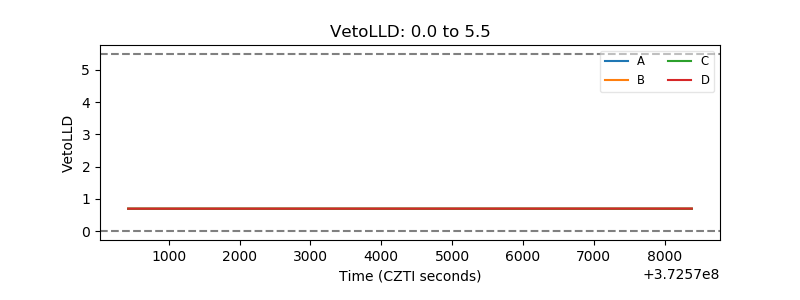 |
| Alpha Counter | 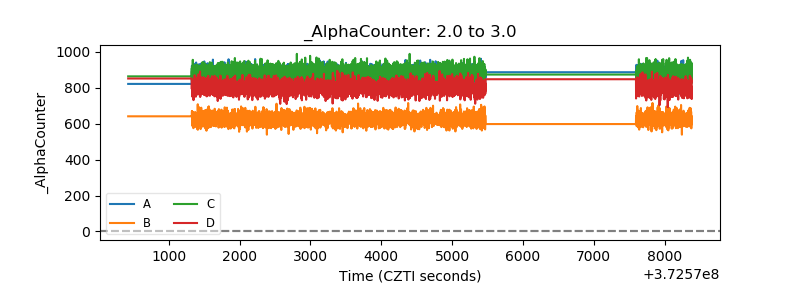 |
| _CPM_Rate | 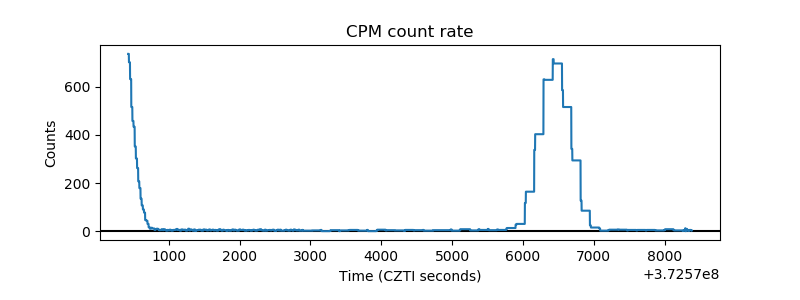 |
| CZT Counter | 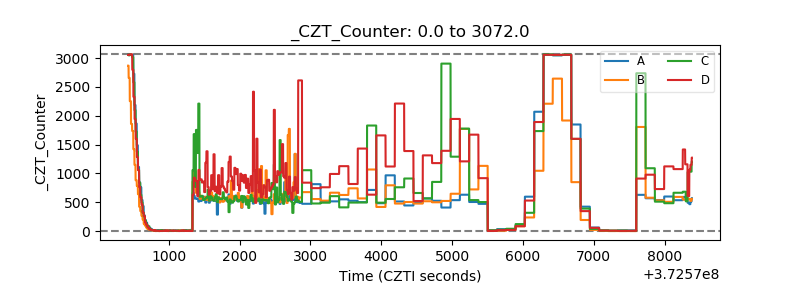 |
| +2.5 Volts monitor |  |
| +5 Volts monitor |  |
| _ROLL_ROT | 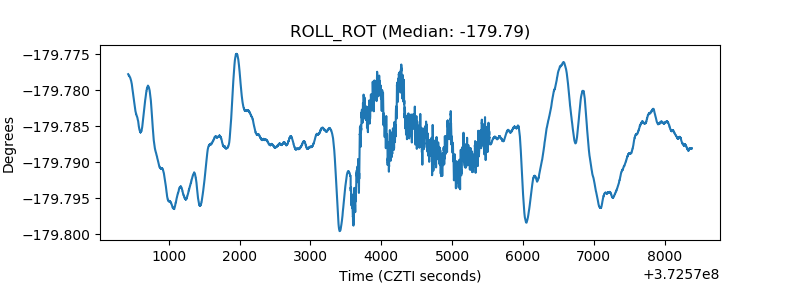 |
| _Roll_DEC | 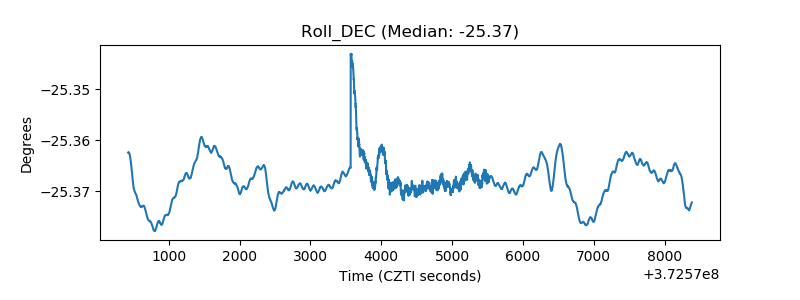 |
| _Roll_RA | 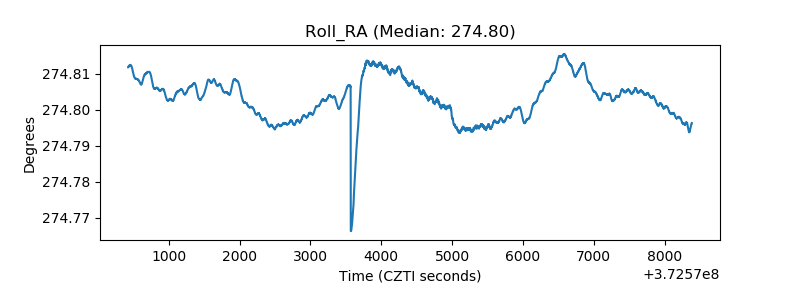 |
| Veto Counter | 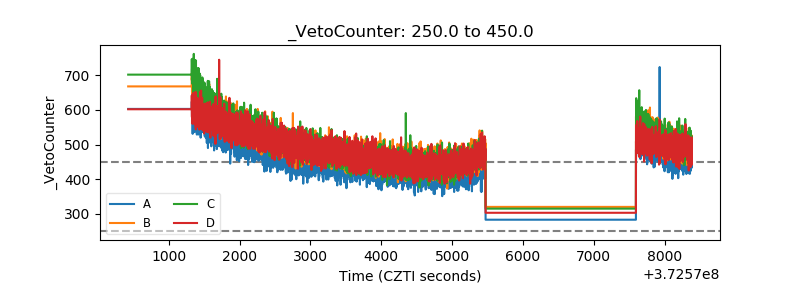 |