| Param | Original file | Final file |
|---|---|---|
| Filename | modeM0/AS1T04_064T01_9000004730_32803cztM0_level2.evt | modeM0/AS1T04_064T01_9000004730_32803cztM0_level2_quad_clean.evt |
| Size (bytes) | 532,019,520 | 87,324,480 |
| Size | 507.4 MB | 83.3 MB |
| Events in quadrant A | 2,807,571 | 593,914 |
| Events in quadrant B | 3,761,504 | 581,960 |
| Events in quadrant C | 2,973,297 | 594,594 |
| Events in quadrant D | 6,231,282 | 522,728 |
| Mode M9 | |||
|---|---|---|---|
| Quadrant | BADHDUFLAG | Total packets | Discarded packets |
| A | 0 | 33 | 0 |
| B | 0 | 33 | 0 |
| C | 0 | 33 | 0 |
| D | 0 | 34 | 0 |
| Mode SS | |||
|---|---|---|---|
| Quadrant | BADHDUFLAG | Total packets | Discarded packets |
| A | 0 | 104 | 0 |
| B | 0 | 104 | 0 |
| C | 0 | 104 | 0 |
| D | 0 | 104 | 0 |
| Mode M0 | |||
|---|---|---|---|
| Quadrant | BADHDUFLAG | Total packets | Discarded packets |
| A | 0 | 11238 | 3 |
| B | 0 | 14341 | 2 |
| C | 0 | 11867 | 2 |
| D | 0 | 22000 | 2 |
| Quadrant | Total seconds | Saturated seconds | Saturation percentage |
|---|---|---|---|
| A | 4998 | 39 | 0.780312% |
| B | 4998 | 336 | 6.722689% |
| C | 4998 | 88 | 1.760704% |
| D | 4998 | 619 | 12.384954% |
Noise dominated data is calculated using 1-second bins in cleaned event files. If a bin has >2000 counts, and if more than 50% of those come from <1% of pixels, then it is considered to be noise-dominated and hence unusable.
| Quadrant | # 1 sec bins | Bins with >0 counts | Bins with >2000 counts | High rate bins dominated by noise | Noise dominated (total time) | Noise dominated (detector-on time) | Marked lightcurve |
|---|---|---|---|---|---|---|---|
| A | 7032 | 4999 | 13 | 13 | 0.18% | 0.26% | 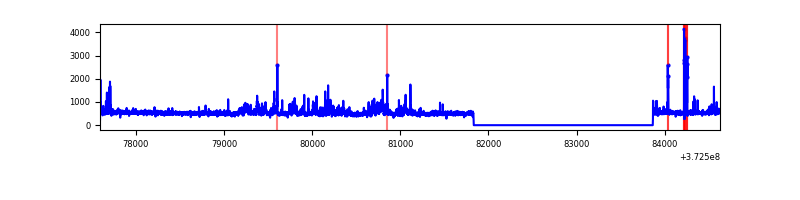 |
| B | 7032 | 4999 | 213 | 213 | 3.03% | 4.26% | 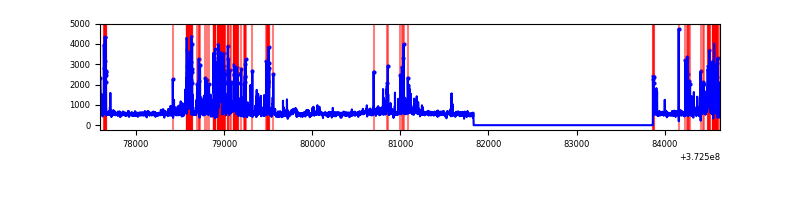 |
| C | 7032 | 4999 | 54 | 54 | 0.77% | 1.08% | 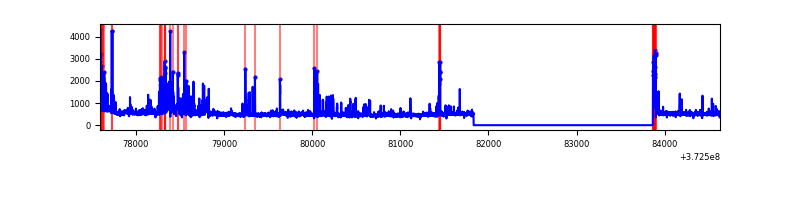 |
| D | 7032 | 4999 | 596 | 596 | 8.48% | 11.92% | 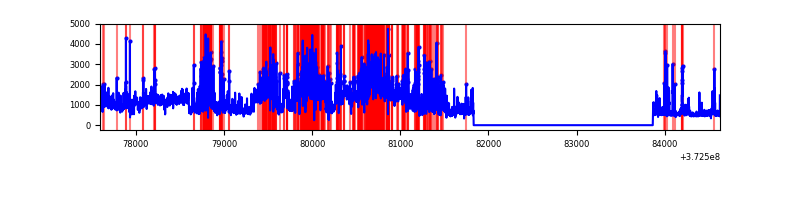 |
Top three noisy pixels from each quadrant. If the there are fewer than three noisy pixels in the level2.evt file, extra rows are filled as -1
| Pixel properties | Quadrant properties | ||||||
|---|---|---|---|---|---|---|---|
| Quadrant | DetID | PixID | Counts | Sigma | Mean | Median | Sigma |
| A | 12 | 16 | 174231 | 1371.91 | 630 | 617 | 126.5 |
| A | 15 | 17 | 72066 | 564.59 | 630 | 617 | 126.5 |
| A | 9 | 143 | 39136 | 304.38 | 630 | 617 | 126.5 |
| B | 5 | 172 | 879692 | 7588.82 | 609 | 598 | 115.8 |
| B | 0 | 197 | 182102 | 1566.84 | 609 | 598 | 115.8 |
| B | 0 | 219 | 141728 | 1218.31 | 609 | 598 | 115.8 |
| C | 0 | 10 | 485380 | 3465.14 | 604 | 610 | 139.9 |
| C | 3 | 233 | 36894 | 259.36 | 604 | 610 | 139.9 |
| C | 3 | 110 | 25669 | 179.12 | 604 | 610 | 139.9 |
| D | 8 | 195 | 2204637 | 15525.44 | 584 | 572 | 142.0 |
| D | 2 | 250 | 540481 | 3803.12 | 584 | 572 | 142.0 |
| D | 12 | 233 | 454099 | 3194.65 | 584 | 572 | 142.0 |
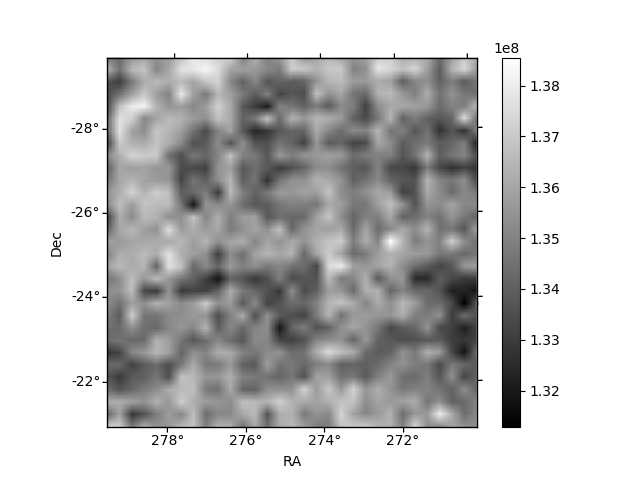
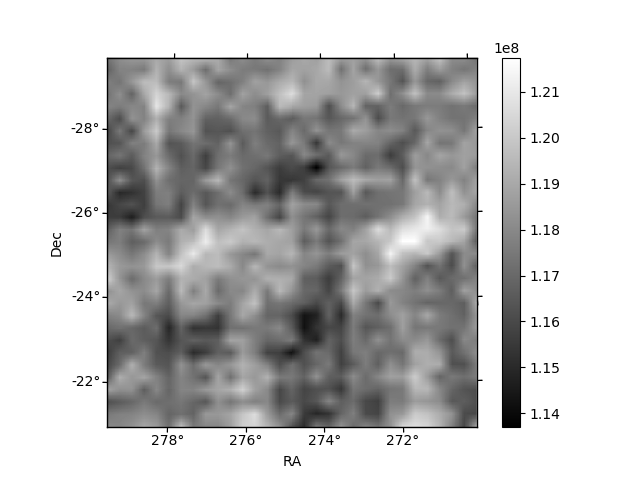
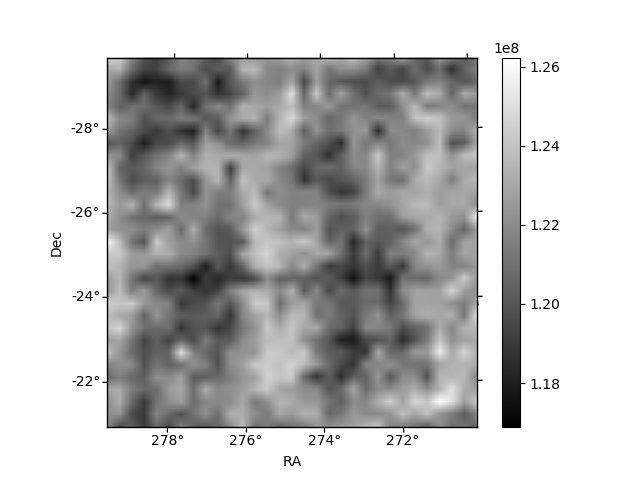
Histogram calculated using DETX and DETY for each event in the final _common_clean file
| Quadrant A | 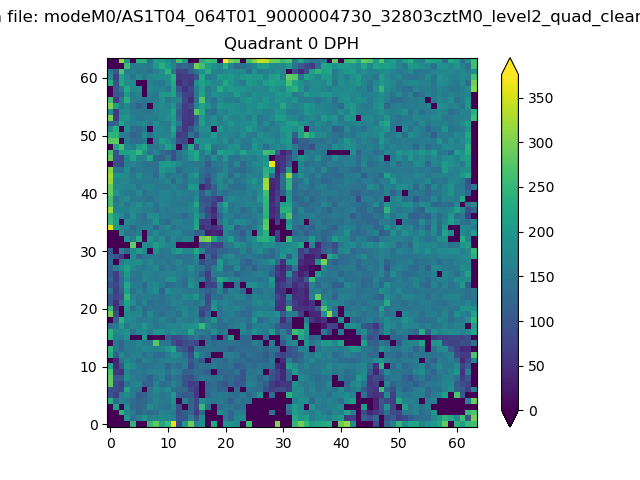 |
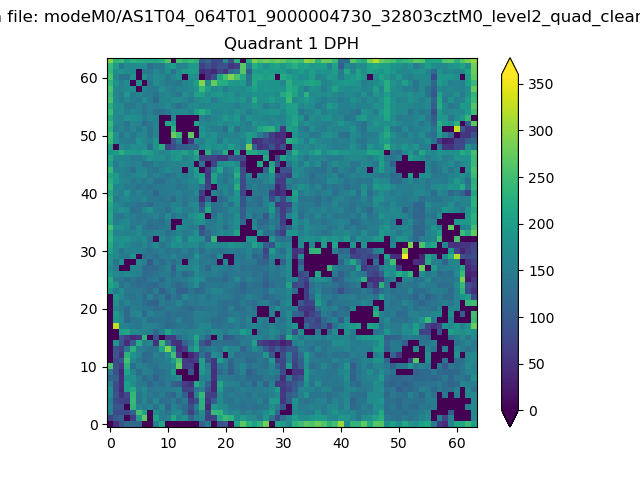 |
Quadrant B |
|---|---|---|---|
| Quadrant D | 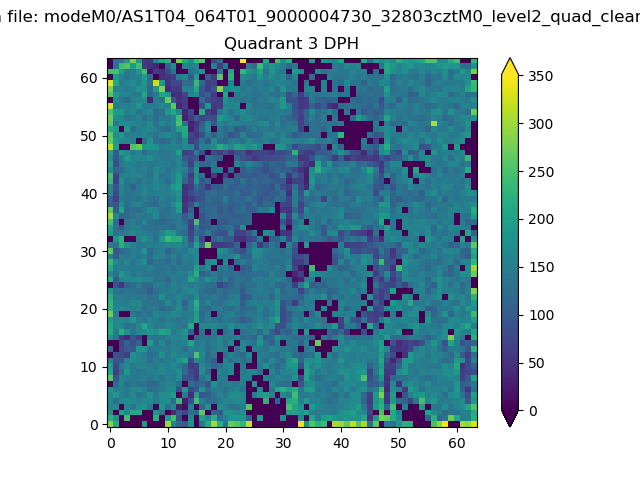 |
 |
Quadrant C |
| Plot type | Count rate plots | Images |
|---|---|---|
| Comparison with Poisson distribution Blue bars denote a histogram of data divided into 1 sec bins. Red curve is a Poisson curve with rate = median count rate of data. |
 |
 |
| Quadrant-wise count rates Data is divided into 100 sec bins |
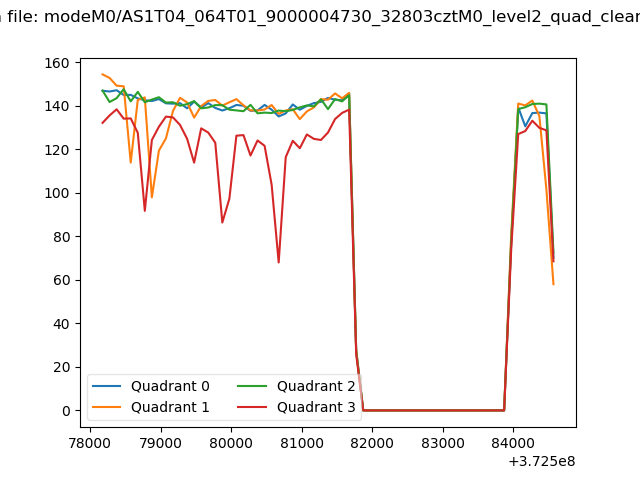 |
|
| Module-wise count rates for Quadrant A Data is divided into 100 sec bins |
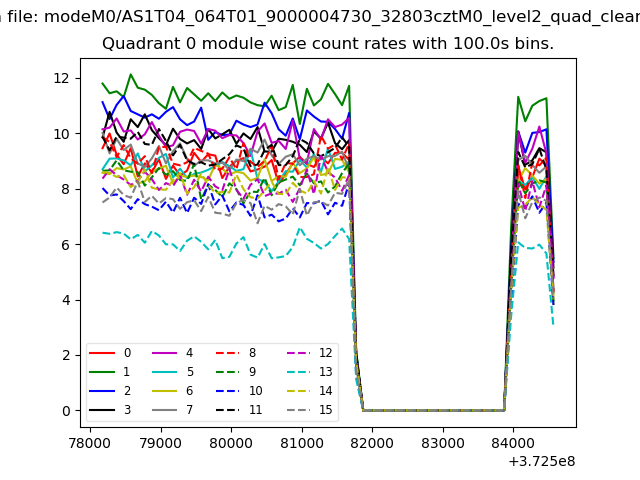 |
 |
| Module-wise count rates for Quadrant B Data is divided into 100 sec bins |
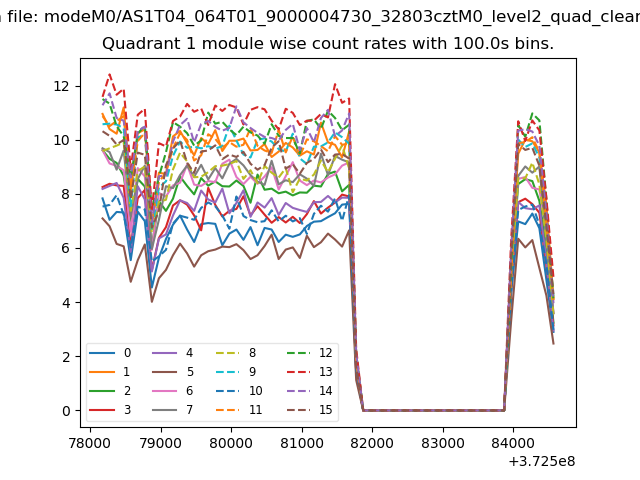 |
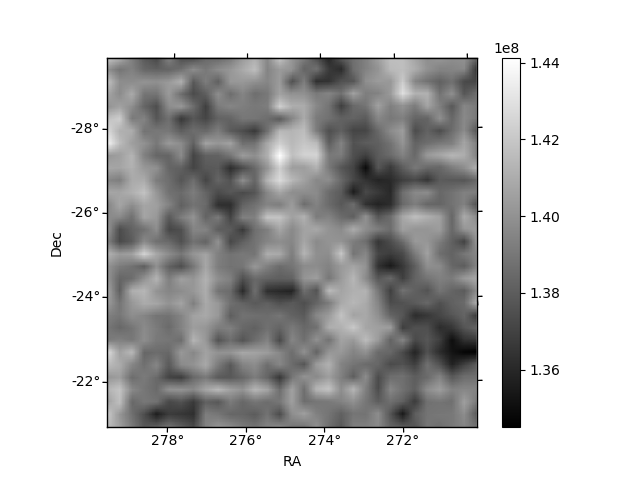 |
| Module-wise count rates for Quadrant C Data is divided into 100 sec bins |
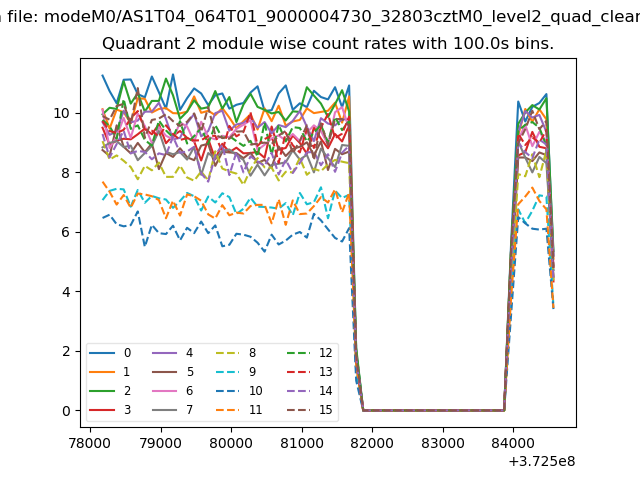 |
 |
| Module-wise count rates for Quadrant D Data is divided into 100 sec bins |
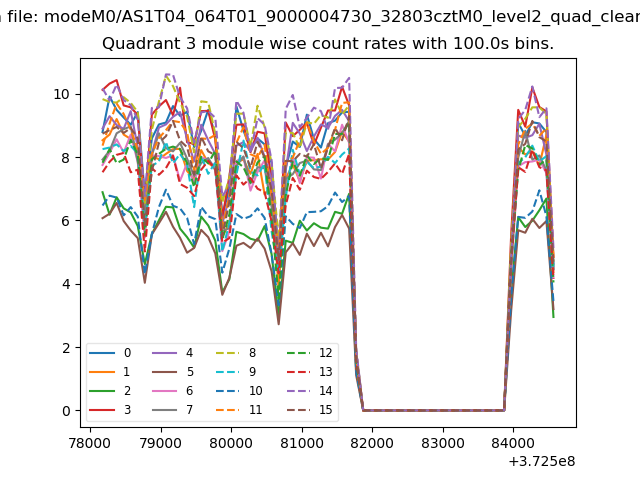 |
 |
| Parameter | Plot |
|---|---|
| CZT HV Monitor | 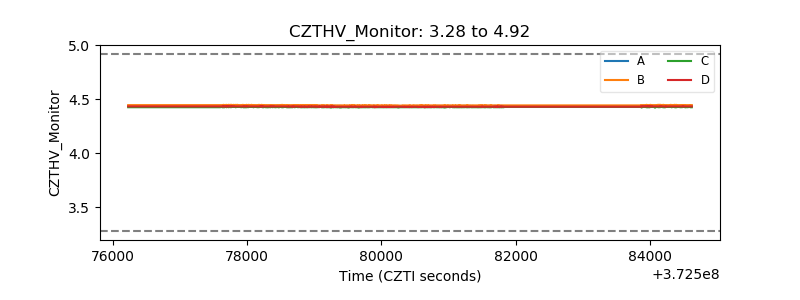 |
| D_VDD | 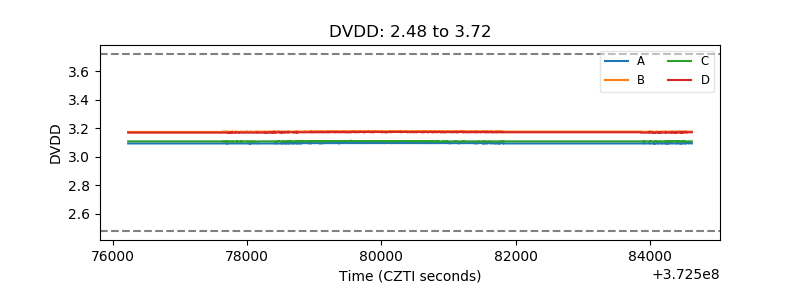 |
| Temperature 1 | 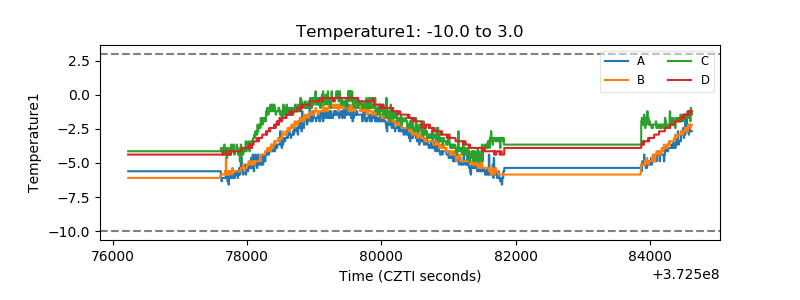 |
| Veto HV Monitor | 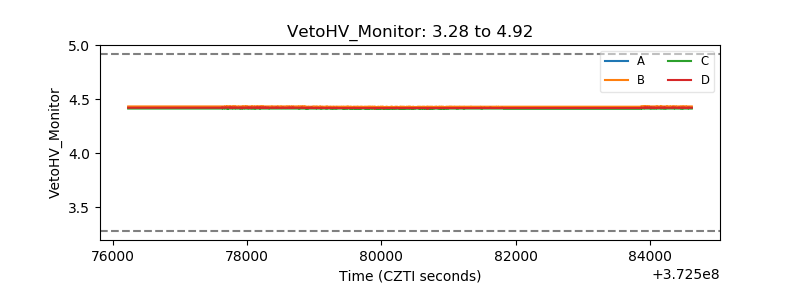 |
| Veto LLD | 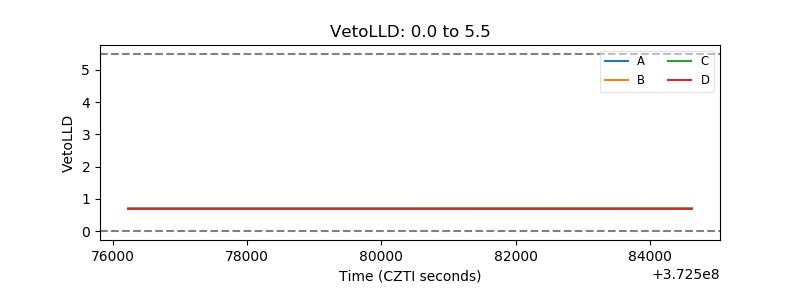 |
| Alpha Counter | 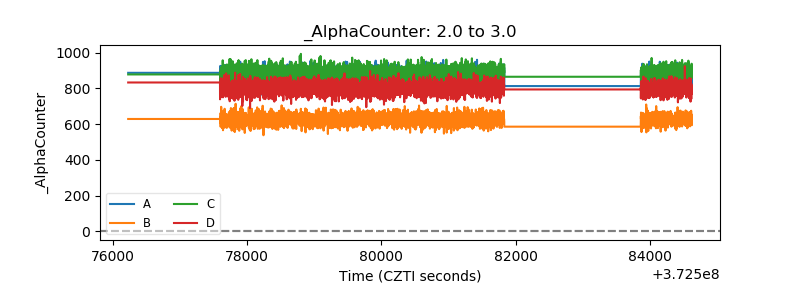 |
| _CPM_Rate | 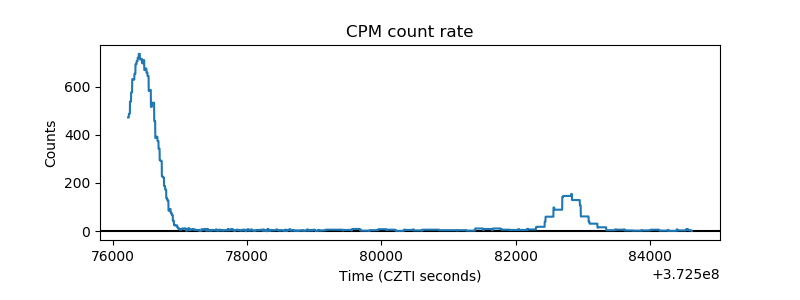 |
| CZT Counter |  |
| +2.5 Volts monitor |  |
| +5 Volts monitor |  |
| _ROLL_ROT | 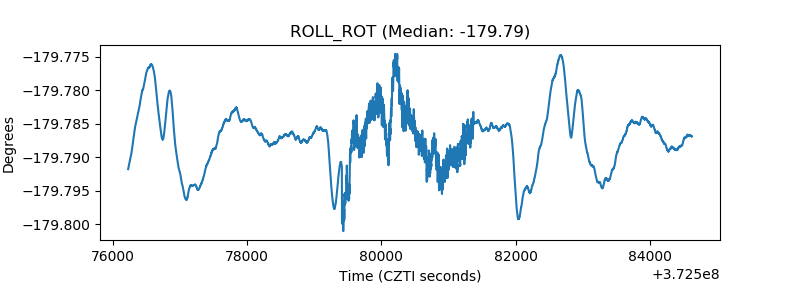 |
| _Roll_DEC | 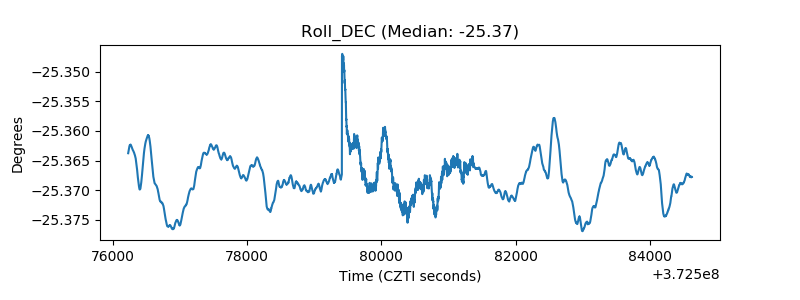 |
| _Roll_RA |  |
| Veto Counter | 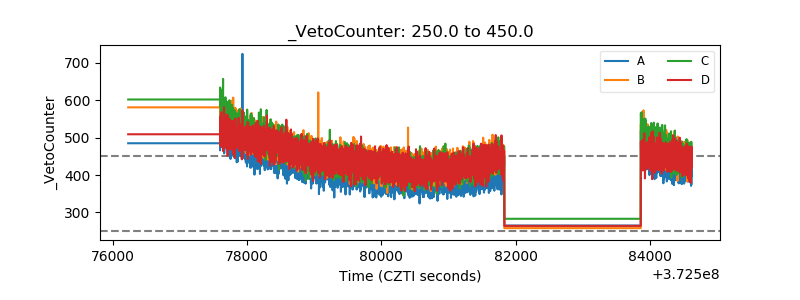 |