| Param | Original file | Final file |
|---|---|---|
| Filename | modeM0/AS1T04_064T01_9000004730_32806cztM0_level2.evt | modeM0/AS1T04_064T01_9000004730_32806cztM0_level2_quad_clean.evt |
| Size (bytes) | 600,721,920 | 77,296,320 |
| Size | 572.9 MB | 73.7 MB |
| Events in quadrant A | 2,982,425 | 498,550 |
| Events in quadrant B | 3,816,176 | 492,321 |
| Events in quadrant C | 3,352,756 | 492,990 |
| Events in quadrant D | 7,639,638 | 440,840 |
| Mode M9 | |||
|---|---|---|---|
| Quadrant | BADHDUFLAG | Total packets | Discarded packets |
| A | 0 | 16 | 0 |
| B | 0 | 16 | 0 |
| C | 0 | 16 | 0 |
| D | 0 | 17 | 0 |
| Mode SS | |||
|---|---|---|---|
| Quadrant | BADHDUFLAG | Total packets | Discarded packets |
| A | 0 | 122 | 0 |
| B | 0 | 122 | 0 |
| C | 0 | 122 | 0 |
| D | 0 | 122 | 0 |
| Mode M0 | |||
|---|---|---|---|
| Quadrant | BADHDUFLAG | Total packets | Discarded packets |
| A | 0 | 12705 | 3 |
| B | 0 | 15048 | 2 |
| C | 0 | 13821 | 2 |
| D | 0 | 26917 | 2 |
| Quadrant | Total seconds | Saturated seconds | Saturation percentage |
|---|---|---|---|
| A | 5946 | 53 | 0.891356% |
| B | 5946 | 194 | 3.262698% |
| C | 5946 | 105 | 1.765893% |
| D | 5946 | 579 | 9.737639% |
Noise dominated data is calculated using 1-second bins in cleaned event files. If a bin has >2000 counts, and if more than 50% of those come from <1% of pixels, then it is considered to be noise-dominated and hence unusable.
| Quadrant | # 1 sec bins | Bins with >0 counts | Bins with >2000 counts | High rate bins dominated by noise | Noise dominated (total time) | Noise dominated (detector-on time) | Marked lightcurve |
|---|---|---|---|---|---|---|---|
| A | 7259 | 5947 | 39 | 39 | 0.54% | 0.66% | 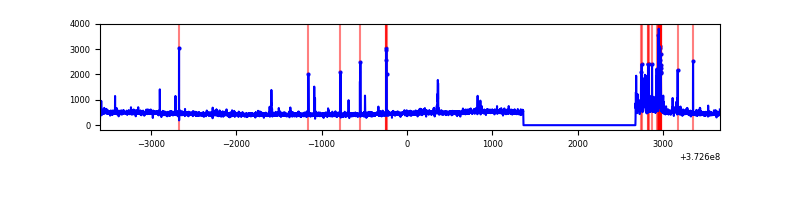 |
| B | 7259 | 5947 | 113 | 113 | 1.56% | 1.90% | 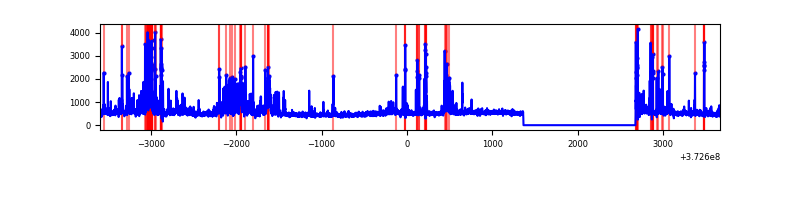 |
| C | 7259 | 5947 | 65 | 65 | 0.90% | 1.09% | 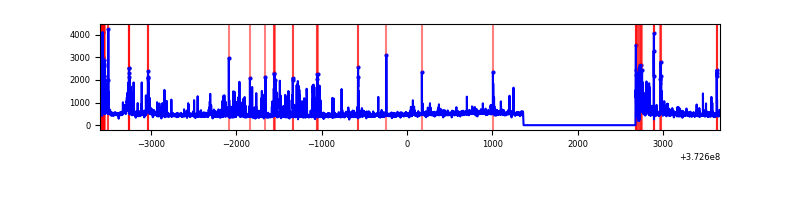 |
| D | 7259 | 5947 | 565 | 565 | 7.78% | 9.50% | 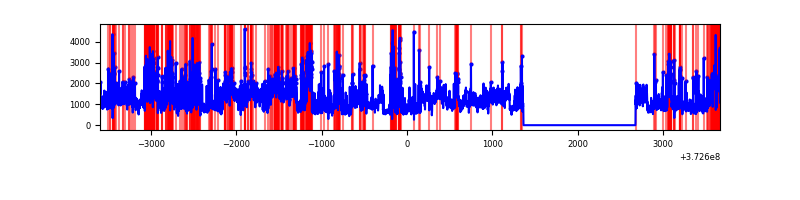 |
Top three noisy pixels from each quadrant. If the there are fewer than three noisy pixels in the level2.evt file, extra rows are filled as -1
| Pixel properties | Quadrant properties | ||||||
|---|---|---|---|---|---|---|---|
| Quadrant | DetID | PixID | Counts | Sigma | Mean | Median | Sigma |
| A | 14 | 238 | 153853 | 1076.72 | 701 | 688 | 142.3 |
| A | 9 | 143 | 41588 | 287.52 | 701 | 688 | 142.3 |
| A | 7 | 16 | 16532 | 111.38 | 701 | 688 | 142.3 |
| B | 5 | 172 | 451301 | 3349.55 | 699 | 683 | 134.5 |
| B | 0 | 219 | 253315 | 1877.87 | 699 | 683 | 134.5 |
| B | 15 | 54 | 157161 | 1163.14 | 699 | 683 | 134.5 |
| C | 0 | 10 | 449337 | 2856.68 | 675 | 681 | 157.1 |
| C | 3 | 233 | 65957 | 415.63 | 675 | 681 | 157.1 |
| C | 0 | 207 | 61453 | 386.95 | 675 | 681 | 157.1 |
| D | 8 | 195 | 3228769 | 20472.54 | 655 | 642 | 157.7 |
| D | 2 | 250 | 850193 | 5387.79 | 655 | 642 | 157.7 |
| D | 2 | 249 | 261252 | 1652.77 | 655 | 642 | 157.7 |
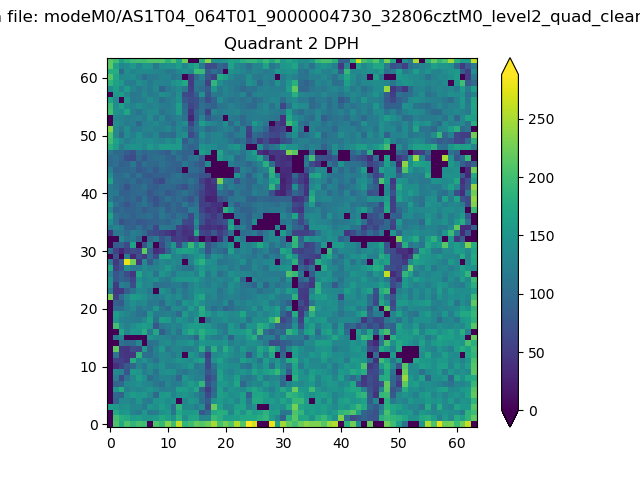
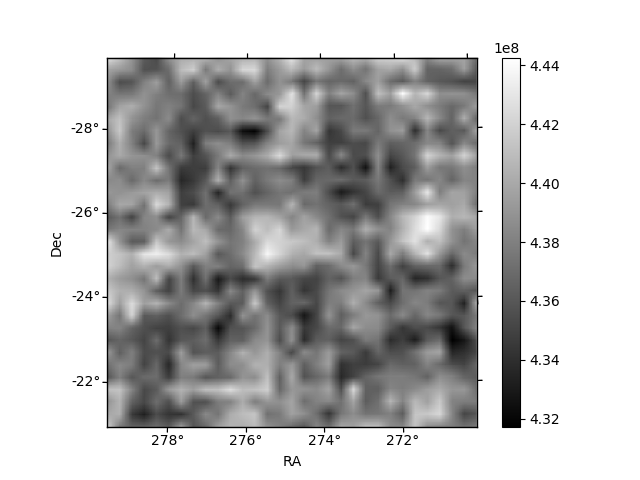
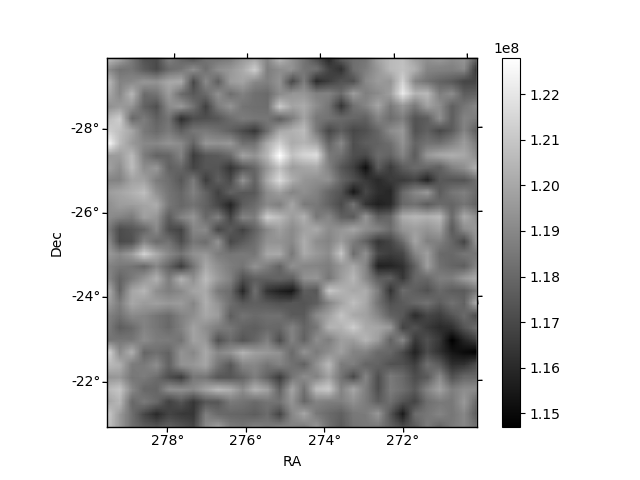
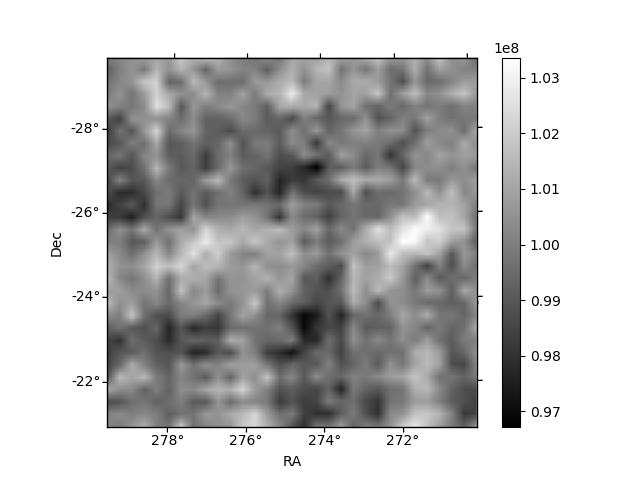
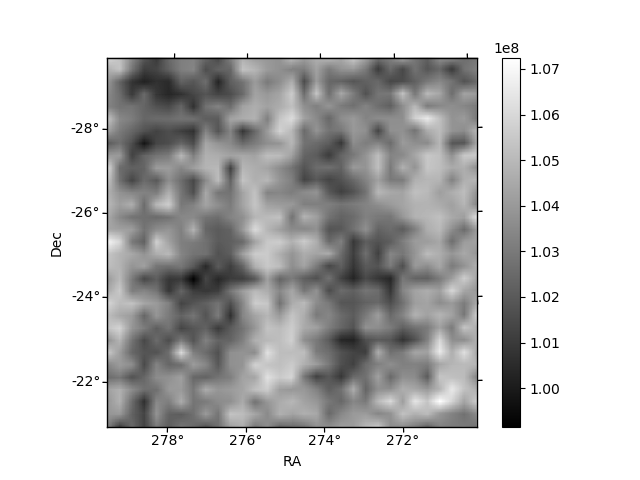
Histogram calculated using DETX and DETY for each event in the final _common_clean file
| Quadrant A | 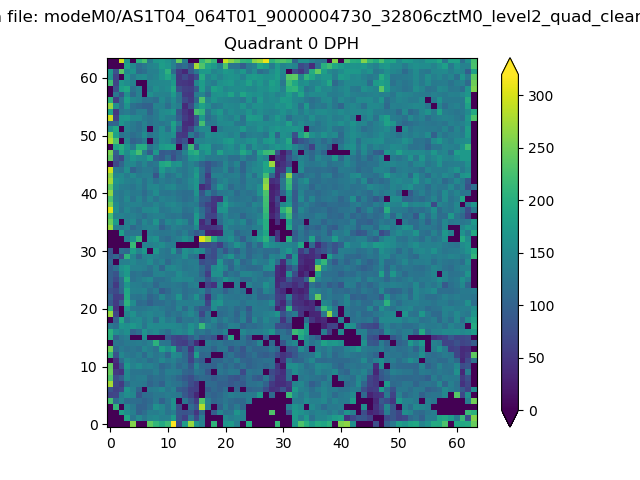 |
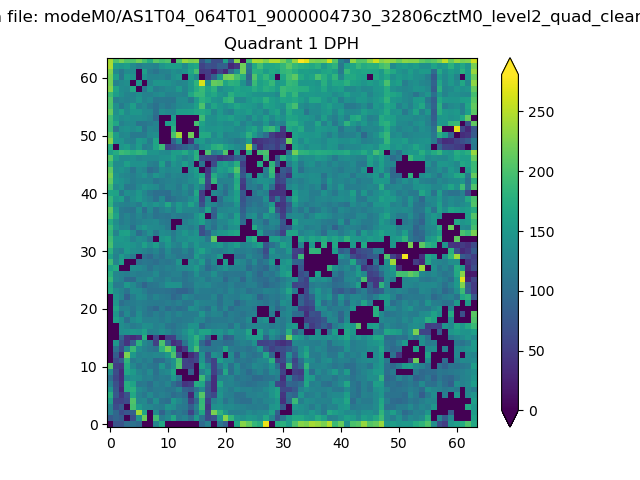 |
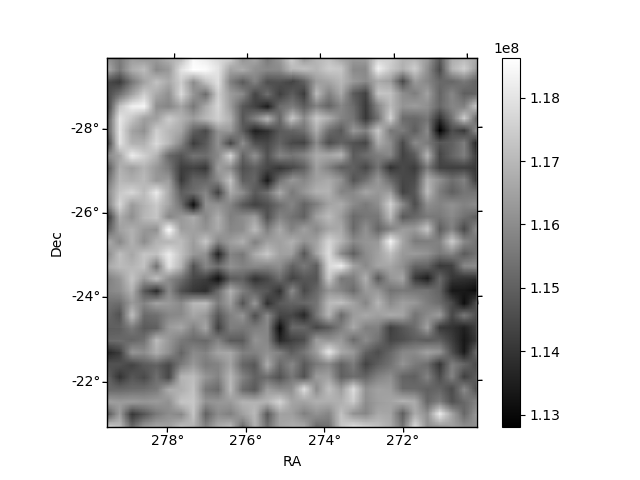
Quadrant B |
|---|---|---|---|
| Quadrant D | 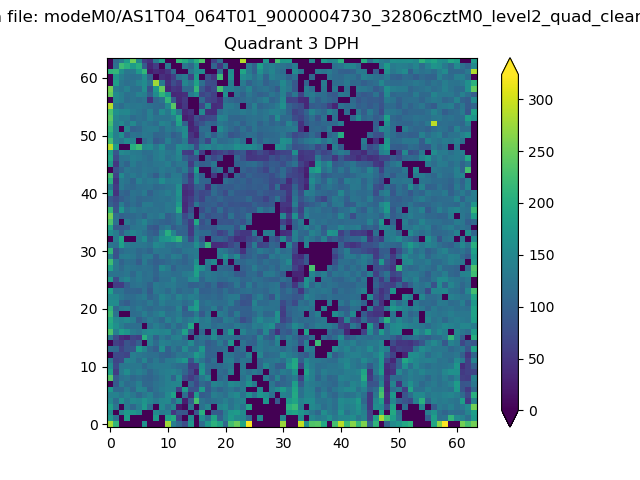 |
 |
Quadrant C |
| Plot type | Count rate plots | Images |
|---|---|---|
| Comparison with Poisson distribution Blue bars denote a histogram of data divided into 1 sec bins. Red curve is a Poisson curve with rate = median count rate of data. |
 |
 |
| Quadrant-wise count rates Data is divided into 100 sec bins |
 |
|
| Module-wise count rates for Quadrant A Data is divided into 100 sec bins |
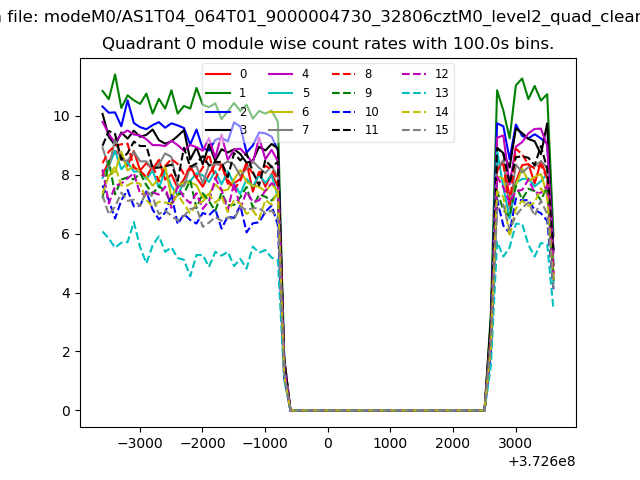 |
 |
| Module-wise count rates for Quadrant B Data is divided into 100 sec bins |
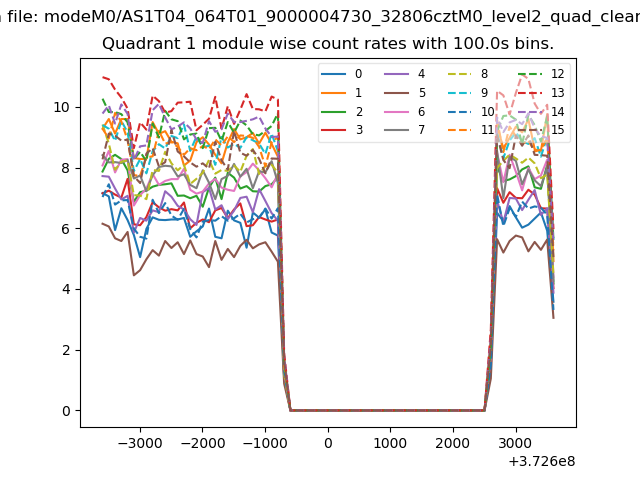 |
 |
| Module-wise count rates for Quadrant C Data is divided into 100 sec bins |
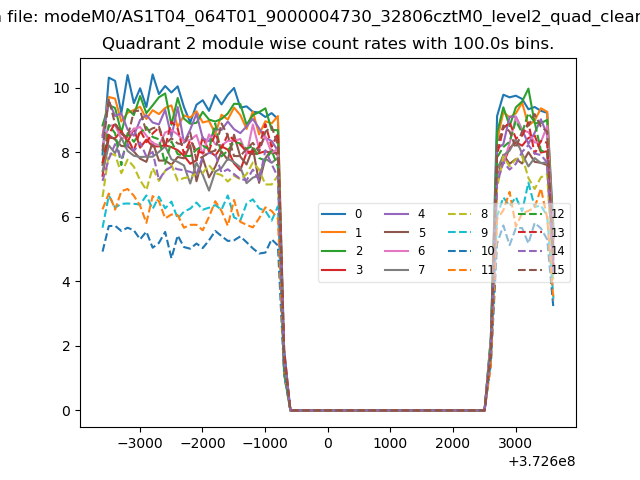 |
 |
| Module-wise count rates for Quadrant D Data is divided into 100 sec bins |
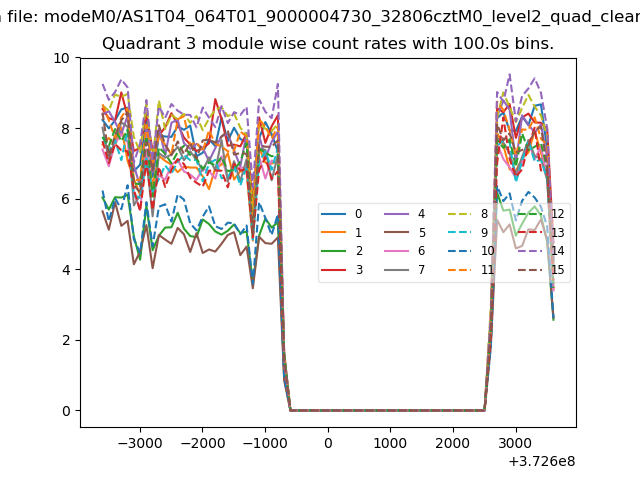 |
 |
| Parameter | Plot |
|---|---|
| CZT HV Monitor | 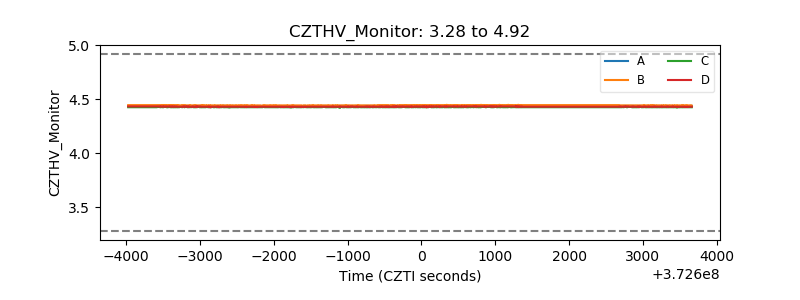 |
| D_VDD | 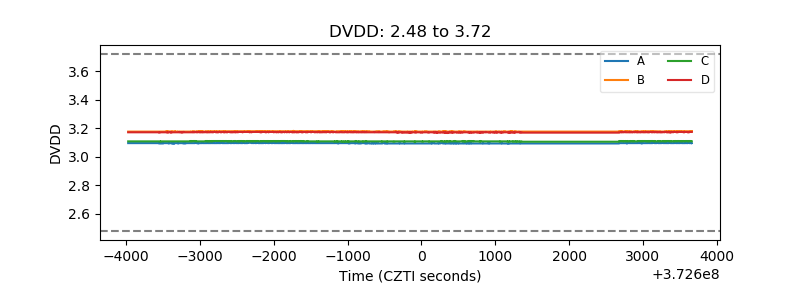 |
| Temperature 1 | 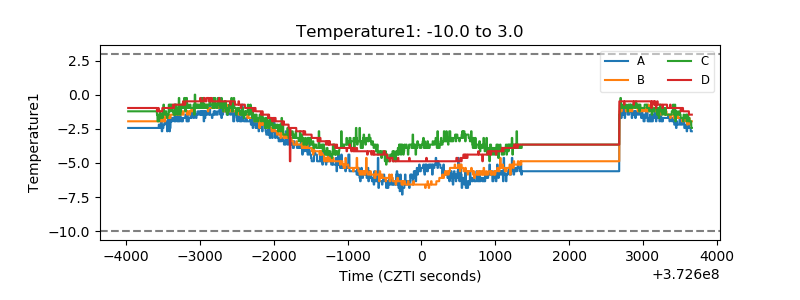 |
| Veto HV Monitor | 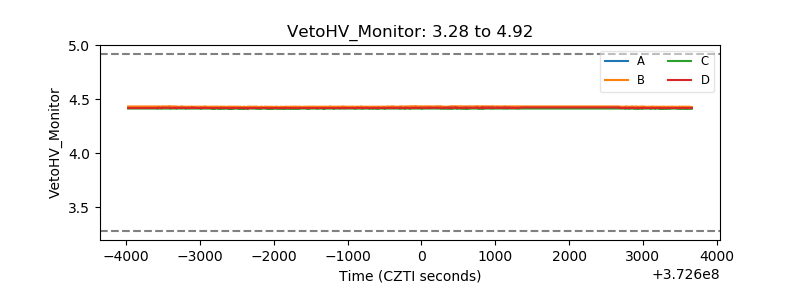 |
| Veto LLD | 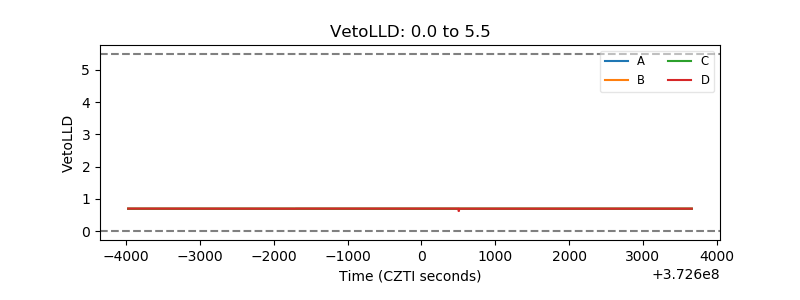 |
| Alpha Counter | 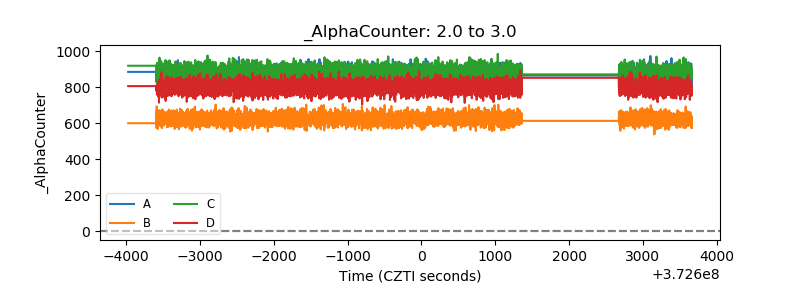 |
| _CPM_Rate |  |
| CZT Counter | 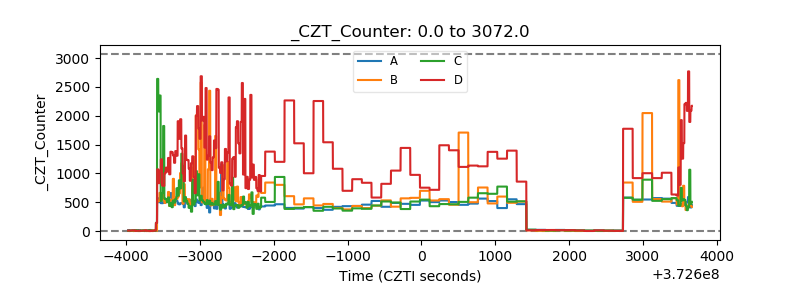 |
| +2.5 Volts monitor |  |
| +5 Volts monitor |  |
| _ROLL_ROT | 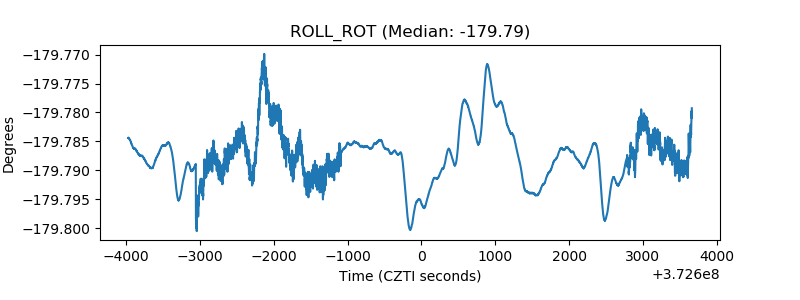 |
| _Roll_DEC | 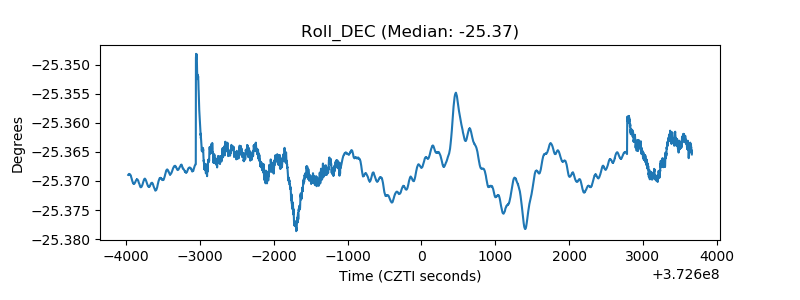 |
| _Roll_RA | 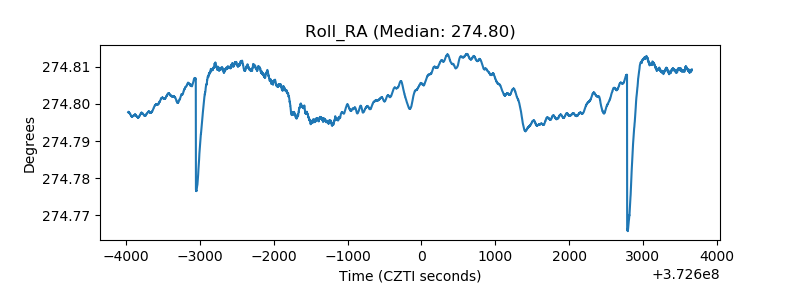 |
| Veto Counter | 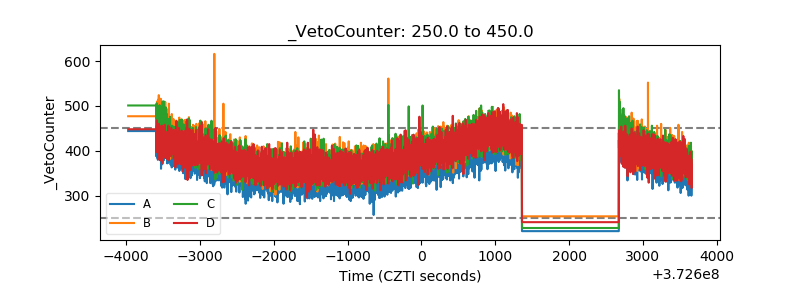 |