| Param | Original file | Final file |
|---|---|---|
| Filename | modeM0/AS1A11_044T01_9000004732cztM0_level2.fits | modeM0/AS1A11_044T01_9000004732cztM0_level2_quad_clean.evt |
| Size (bytes) | 594,835,200 | 762,353,280 |
| Size | 567.3 MB | 727.0 MB |
| Events in quadrant A | 3,665,636 | 4,982,592 |
| Events in quadrant B | 3,479,752 | 4,903,524 |
| Events in quadrant C | 3,645,442 | 4,922,333 |
| Events in quadrant D | 2,924,184 | 3,984,838 |
| Mode M9 | |||
|---|---|---|---|
| Quadrant | BADHDUFLAG | Total packets | Discarded packets |
| A | 0 | 238 | 0 |
| B | 0 | 238 | 0 |
| C | 0 | 238 | 0 |
| D | 0 | 238 | 0 |
| Mode M0 | |||
|---|---|---|---|
| Quadrant | BADHDUFLAG | Total packets | Discarded packets |
| A | 0 | 139469 | 0 |
| B | 0 | 156753 | 0 |
| C | 0 | 138352 | 0 |
| D | 0 | 275054 | 0 |
| Mode SS | |||
|---|---|---|---|
| Quadrant | BADHDUFLAG | Total packets | Discarded packets |
| A | 0 | 1284 | 0 |
| B | 0 | 1284 | 0 |
| C | 0 | 1284 | 0 |
| D | 0 | 1284 | 0 |
| Quadrant | Total seconds | Saturated seconds | Saturation percentage |
|---|---|---|---|
| A | 62613 | 897 | 1.432610% |
| B | 62613 | 2577 | 4.115759% |
| C | 62613 | 700 | 1.117979% |
| D | 62613 | 7850 | 12.537333% |
Noise dominated data is calculated using 1-second bins in cleaned event files. If a bin has >2000 counts, and if more than 50% of those come from <1% of pixels, then it is considered to be noise-dominated and hence unusable.
| Quadrant | # 1 sec bins | Bins with >0 counts | Bins with >2000 counts | High rate bins dominated by noise | Noise dominated (total time) | Noise dominated (detector-on time) | Marked lightcurve |
|---|---|---|---|---|---|---|---|
| A | 86657 | 62598 | 0 | 0 | 0.00% | 0.00% |  |
| B | 86657 | 62580 | 0 | 0 | 0.00% | 0.00% |  |
| C | 86657 | 62606 | 0 | 0 | 0.00% | 0.00% |  |
| D | 86657 | 62574 | 0 | 0 | 0.00% | 0.00% |  |
Top three noisy pixels from each quadrant. If the there are fewer than three noisy pixels in the level2.evt file, extra rows are filled as -1
| Pixel properties | Quadrant properties | ||||||
|---|---|---|---|---|---|---|---|
| Quadrant | DetID | PixID | Counts | Sigma | Mean | Median | Sigma |
| A | 7 | 110 | 3008 | 9.03 | 958 | 908 | 232.5 |
| A | 9 | 19 | 2981 | 8.92 | 958 | 908 | 232.5 |
| A | 0 | 29 | 2884 | 8.5 | 958 | 908 | 232.5 |
| B | 2 | 9 | 2977 | 11.73 | 926 | 890 | 177.9 |
| B | 3 | 80 | 2644 | 9.86 | 926 | 890 | 177.9 |
| B | 5 | 128 | 2413 | 8.56 | 926 | 890 | 177.9 |
| C | 1 | 81 | 3321 | 9.93 | 967 | 917 | 242.0 |
| C | 1 | 80 | 3078 | 8.93 | 967 | 917 | 242.0 |
| C | 3 | 187 | 2609 | 6.99 | 967 | 917 | 242.0 |
| D | 6 | 67 | 2184 | 6.4 | 840 | 770 | 221.0 |
| D | 10 | 113 | 2169 | 6.33 | 840 | 770 | 221.0 |
| D | 4 | 160 | 2139 | 6.2 | 840 | 770 | 221.0 |
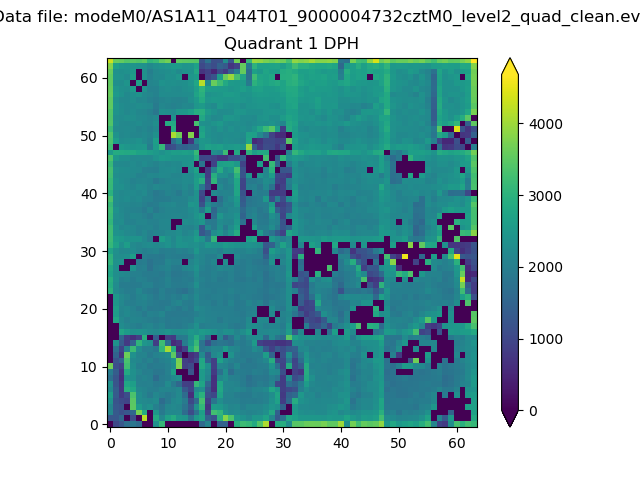
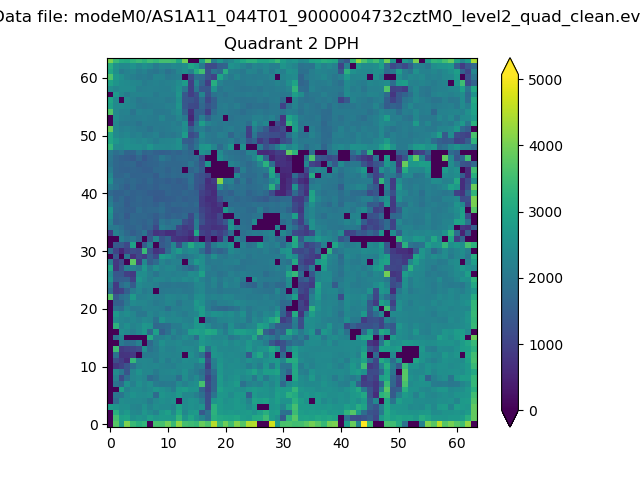
Histogram calculated using DETX and DETY for each event in the final _common_clean file
| Quadrant A |  |
 |
Quadrant B |
|---|---|---|---|
| Quadrant D | 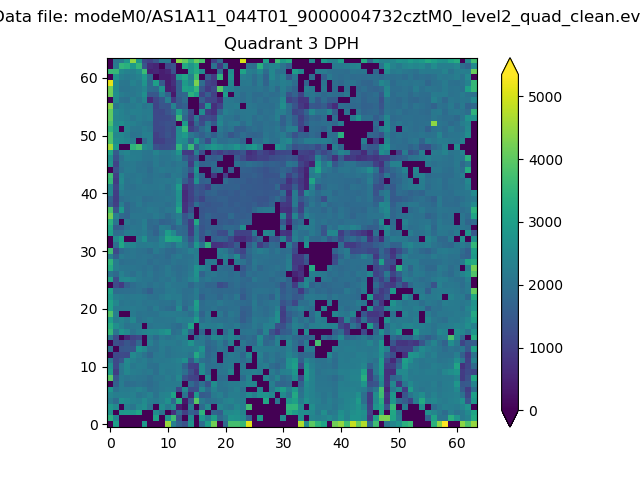 |
 |
Quadrant C |
| Plot type | Count rate plots | Images |
|---|---|---|
| Comparison with Poisson distribution Blue bars denote a histogram of data divided into 1 sec bins. Red curve is a Poisson curve with rate = median count rate of data. |
 |
 |
| Quadrant-wise count rates Data is divided into 100 sec bins |
 |
|
| Module-wise count rates for Quadrant A Data is divided into 100 sec bins |
 |
 |
| Module-wise count rates for Quadrant B Data is divided into 100 sec bins |
 |
 |
| Module-wise count rates for Quadrant C Data is divided into 100 sec bins |
 |
 |
| Module-wise count rates for Quadrant D Data is divided into 100 sec bins |
 |
 |
| Parameter | Plot |
|---|---|
| CZT HV Monitor | 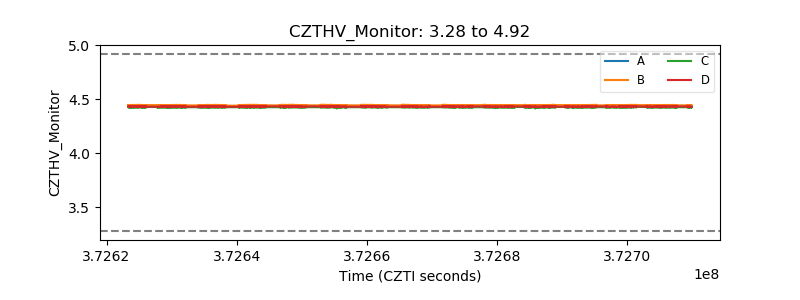 |
| D_VDD | 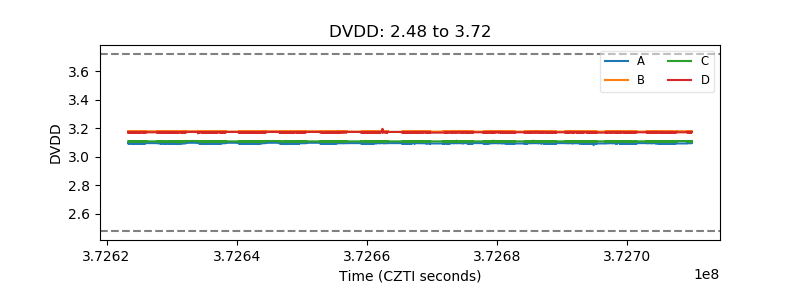 |
| Temperature 1 | 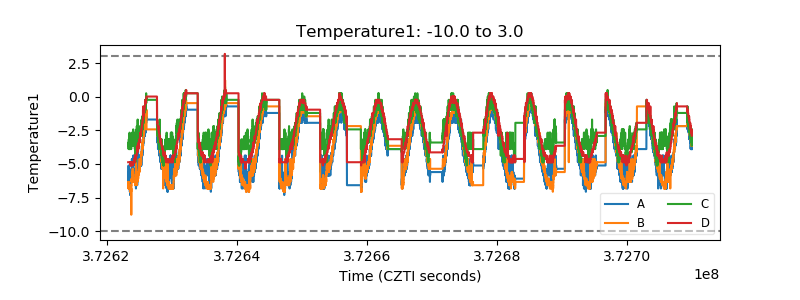 |
| Veto HV Monitor |  |
| Veto LLD | 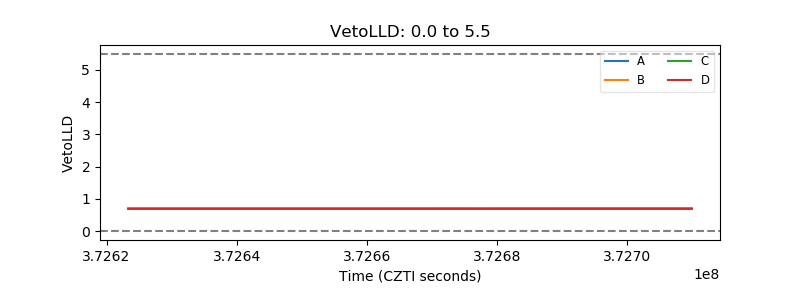 |
| Alpha Counter |  |
| _CPM_Rate |  |
| CZT Counter |  |
| +2.5 Volts monitor | 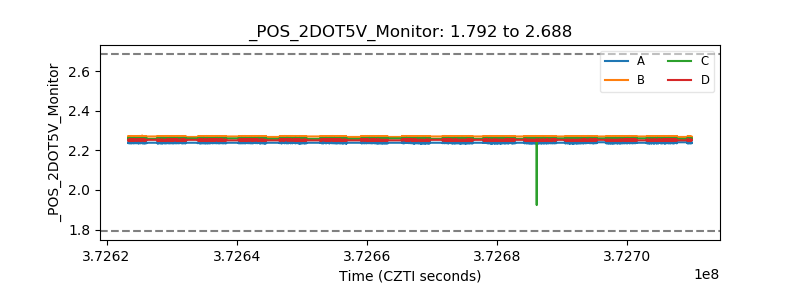 |
| +5 Volts monitor |  |
| _ROLL_ROT | 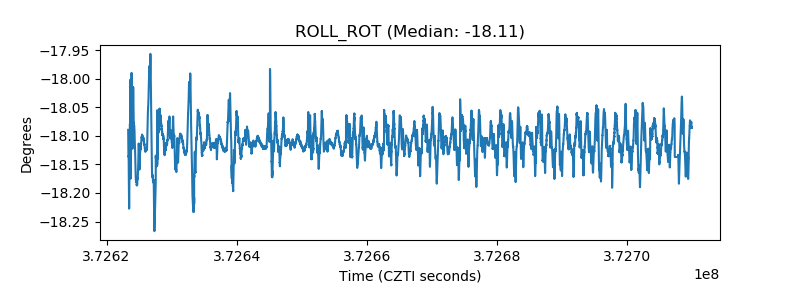 |
| _Roll_DEC |  |
| _Roll_RA | 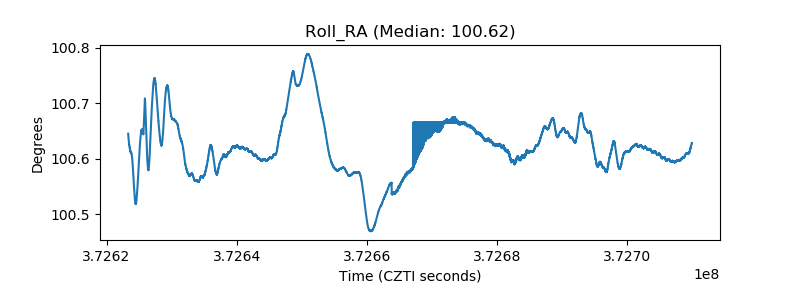 |
| Veto Counter |  |