| Param | Original file | Final file |
|---|---|---|
| Filename | modeM0/AS1A11_044T01_9000004732_32810cztM0_level2.evt | modeM0/AS1A11_044T01_9000004732_32810cztM0_level2_quad_clean.evt |
| Size (bytes) | 344,848,320 | 69,704,640 |
| Size | 328.9 MB | 66.5 MB |
| Events in quadrant A | 1,773,893 | 475,366 |
| Events in quadrant B | 2,226,247 | 472,878 |
| Events in quadrant C | 2,229,486 | 467,232 |
| Events in quadrant D | 3,963,118 | 434,528 |
| Mode M9 | |||
|---|---|---|---|
| Quadrant | BADHDUFLAG | Total packets | Discarded packets |
| A | 0 | 16 | 0 |
| B | 0 | 16 | 0 |
| C | 0 | 16 | 0 |
| D | 0 | 16 | 0 |
| Mode M0 | |||
|---|---|---|---|
| Quadrant | BADHDUFLAG | Total packets | Discarded packets |
| A | 0 | 7651 | 2 |
| B | 0 | 9053 | 1 |
| C | 0 | 8933 | 1 |
| D | 0 | 14380 | 1 |
| Mode SS | |||
|---|---|---|---|
| Quadrant | BADHDUFLAG | Total packets | Discarded packets |
| A | 0 | 76 | 0 |
| B | 0 | 76 | 0 |
| C | 0 | 76 | 0 |
| D | 0 | 76 | 0 |
| Quadrant | Total seconds | Saturated seconds | Saturation percentage |
|---|---|---|---|
| A | 3685 | 17 | 0.461330% |
| B | 3685 | 166 | 4.504749% |
| C | 3685 | 130 | 3.527815% |
| D | 3685 | 255 | 6.919946% |
Noise dominated data is calculated using 1-second bins in cleaned event files. If a bin has >2000 counts, and if more than 50% of those come from <1% of pixels, then it is considered to be noise-dominated and hence unusable.
| Quadrant | # 1 sec bins | Bins with >0 counts | Bins with >2000 counts | High rate bins dominated by noise | Noise dominated (total time) | Noise dominated (detector-on time) | Marked lightcurve |
|---|---|---|---|---|---|---|---|
| A | 5297 | 3686 | 5 | 5 | 0.09% | 0.14% | 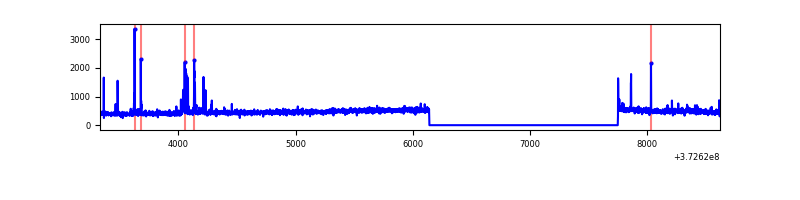 |
| B | 5297 | 3686 | 92 | 92 | 1.74% | 2.50% | 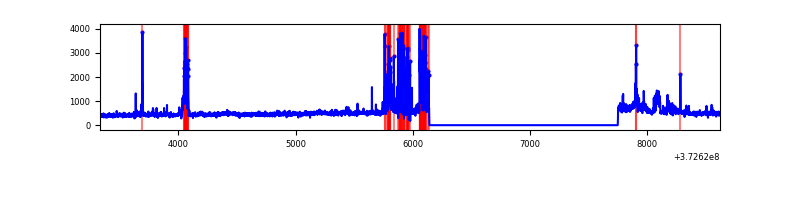 |
| C | 5297 | 3686 | 108 | 108 | 2.04% | 2.93% | 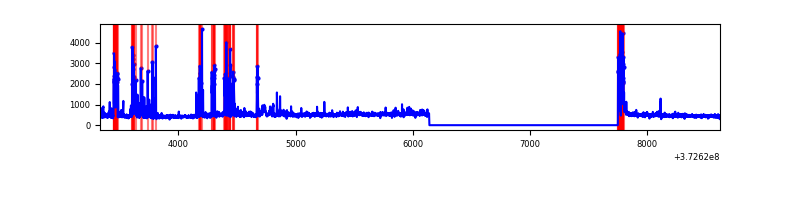 |
| D | 5297 | 3686 | 192 | 192 | 3.62% | 5.21% | 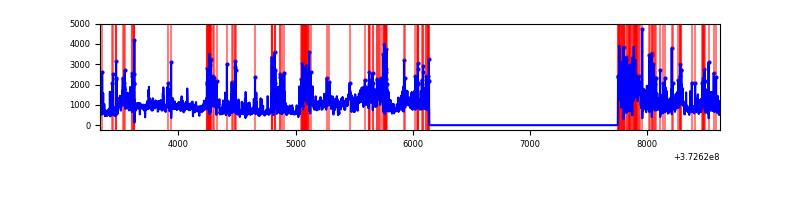 |
Top three noisy pixels from each quadrant. If the there are fewer than three noisy pixels in the level2.evt file, extra rows are filled as -1
| Pixel properties | Quadrant properties | ||||||
|---|---|---|---|---|---|---|---|
| Quadrant | DetID | PixID | Counts | Sigma | Mean | Median | Sigma |
| A | 14 | 238 | 56377 | 643.78 | 432 | 423 | 86.9 |
| A | 9 | 143 | 26616 | 301.37 | 432 | 423 | 86.9 |
| A | 15 | 17 | 8844 | 96.89 | 432 | 423 | 86.9 |
| B | 5 | 172 | 379894 | 4622.24 | 428 | 416 | 82.1 |
| B | 0 | 219 | 91012 | 1103.51 | 428 | 416 | 82.1 |
| B | 5 | 200 | 20888 | 249.36 | 428 | 416 | 82.1 |
| C | 0 | 10 | 497358 | 5024.52 | 420 | 424 | 98.9 |
| C | 3 | 233 | 23444 | 232.76 | 420 | 424 | 98.9 |
| C | 14 | 67 | 23272 | 231.02 | 420 | 424 | 98.9 |
| D | 8 | 195 | 1375320 | 13379.18 | 412 | 401 | 102.8 |
| D | 2 | 250 | 285562 | 2774.87 | 412 | 401 | 102.8 |
| D | 2 | 120 | 149752 | 1453.32 | 412 | 401 | 102.8 |
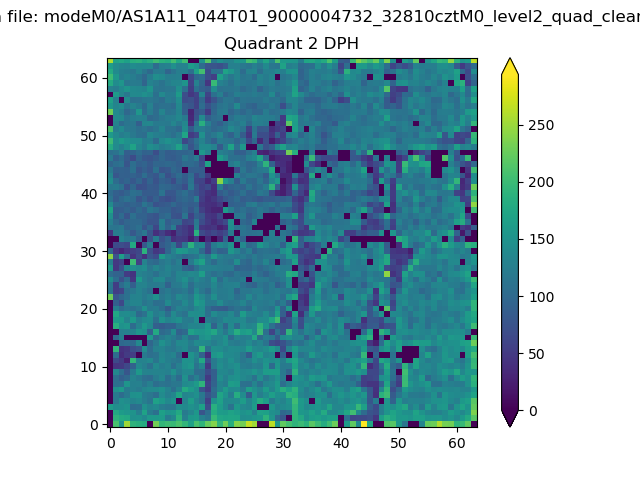
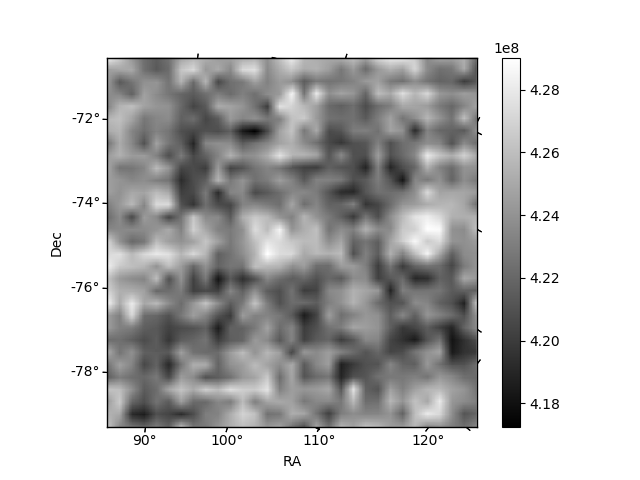
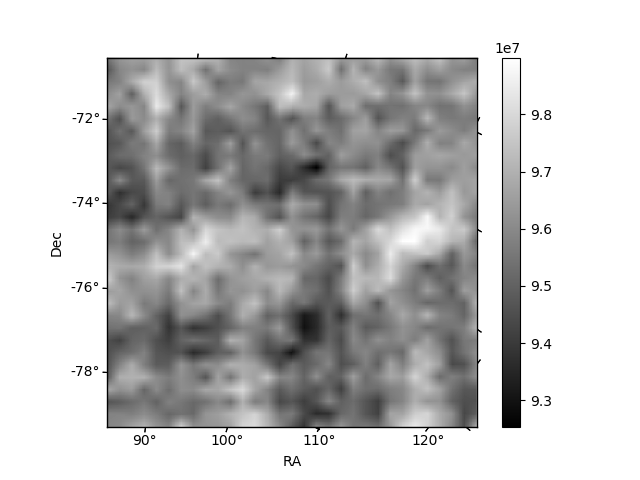
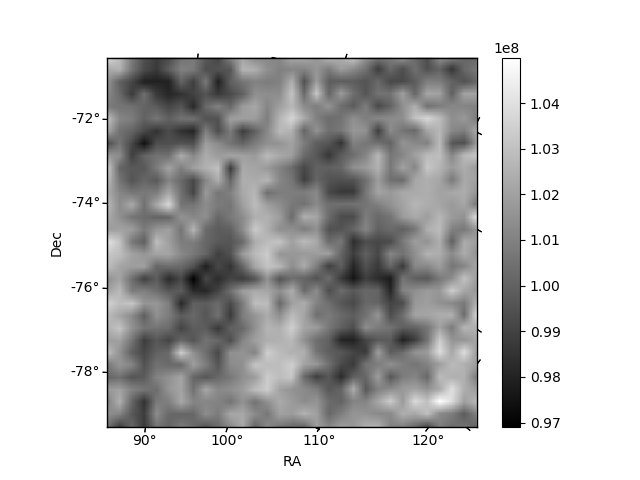
Histogram calculated using DETX and DETY for each event in the final _common_clean file
| Quadrant A | 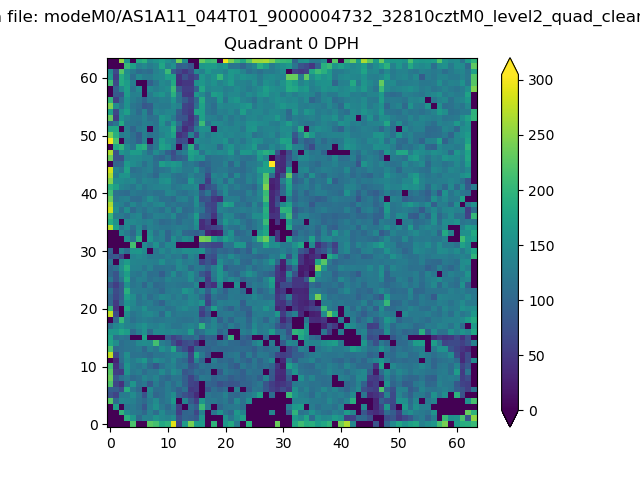 |
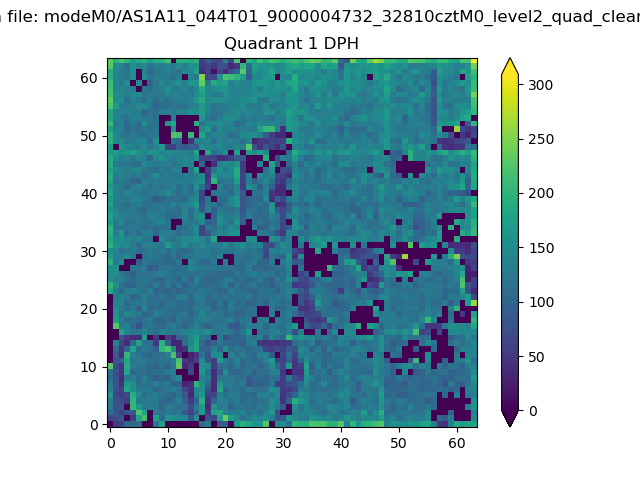 |
Quadrant B |
|---|---|---|---|
| Quadrant D | 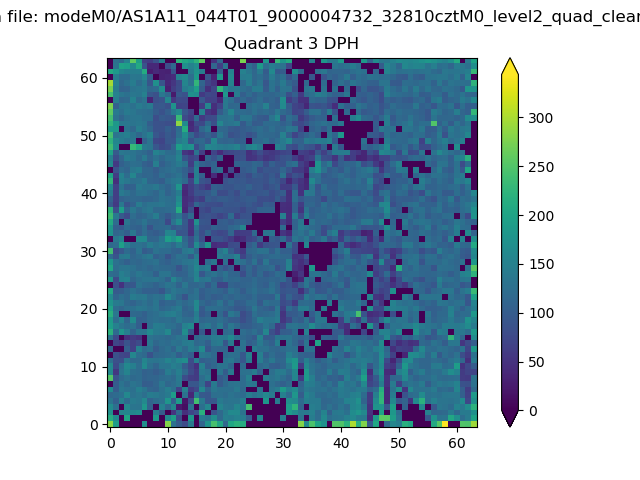 |
 |
Quadrant C |
| Plot type | Count rate plots | Images |
|---|---|---|
| Comparison with Poisson distribution Blue bars denote a histogram of data divided into 1 sec bins. Red curve is a Poisson curve with rate = median count rate of data. |
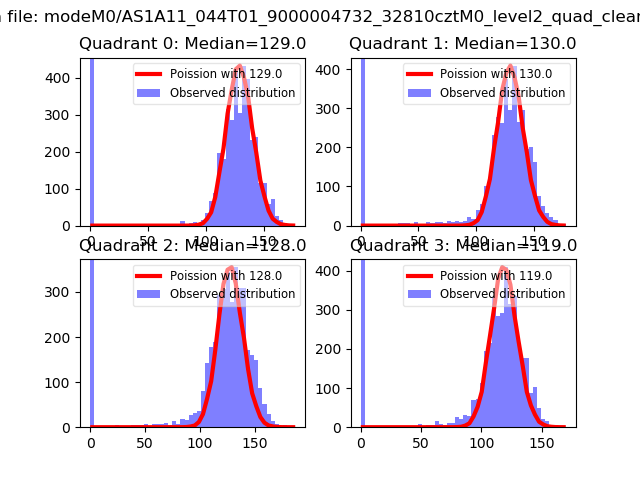 |
 |
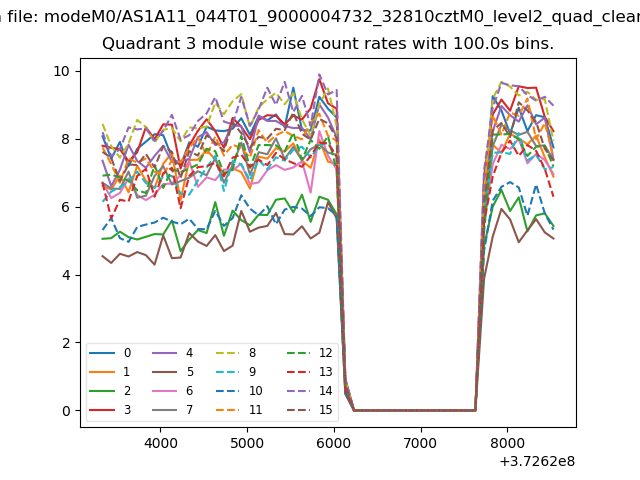
| Quadrant-wise count rates Data is divided into 100 sec bins |
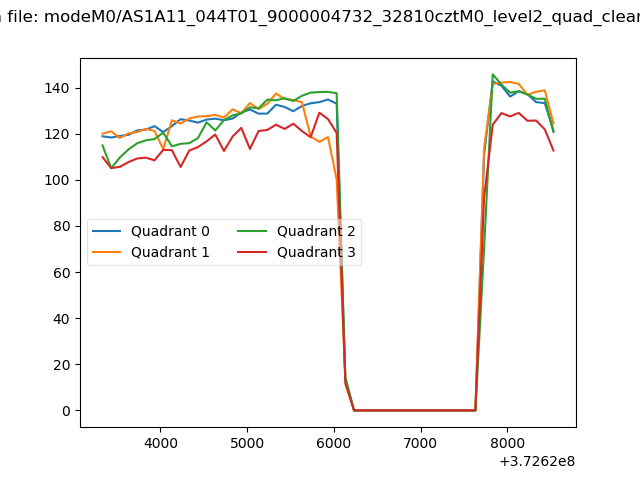 |
|
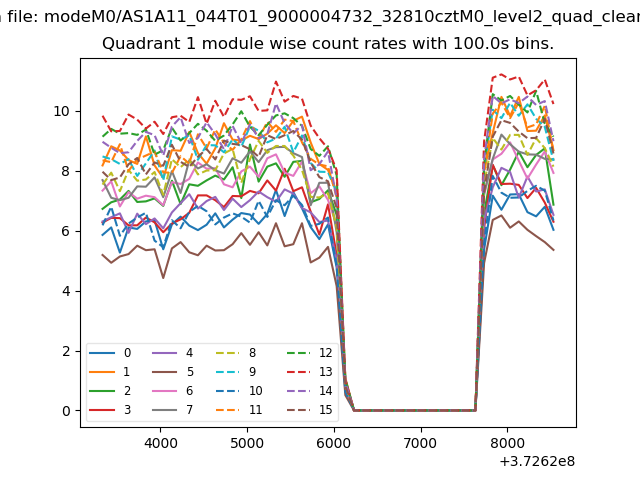
| Module-wise count rates for Quadrant A Data is divided into 100 sec bins |
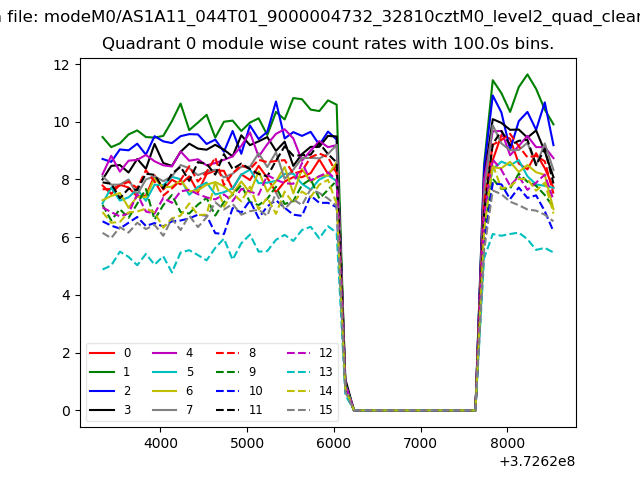 |
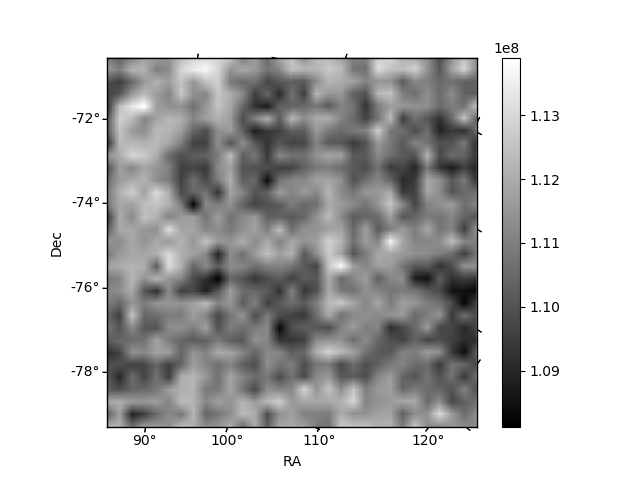 |
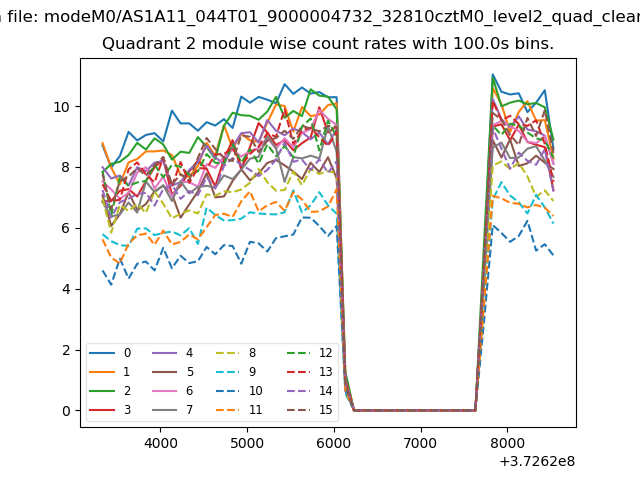
| Module-wise count rates for Quadrant B Data is divided into 100 sec bins |
 |
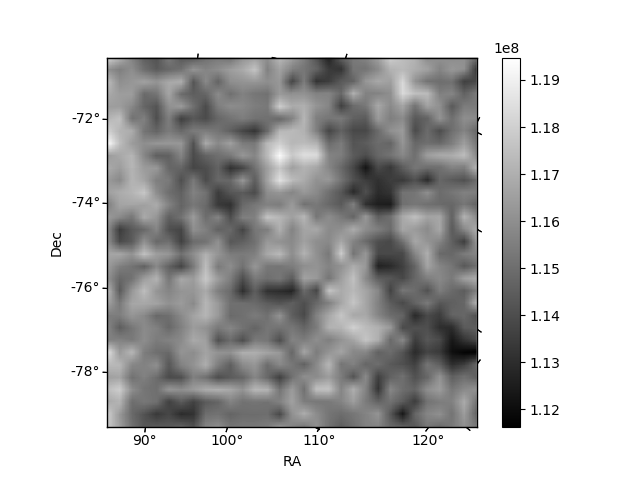 |
| Module-wise count rates for Quadrant C Data is divided into 100 sec bins |
 |
 |
| Module-wise count rates for Quadrant D Data is divided into 100 sec bins |
 |
 |
| Parameter | Plot |
|---|---|
| CZT HV Monitor | 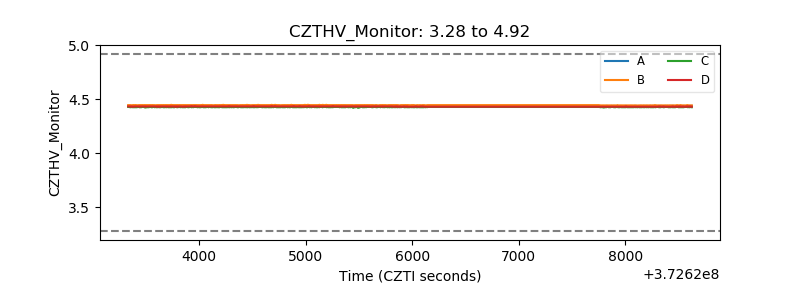 |
| D_VDD | 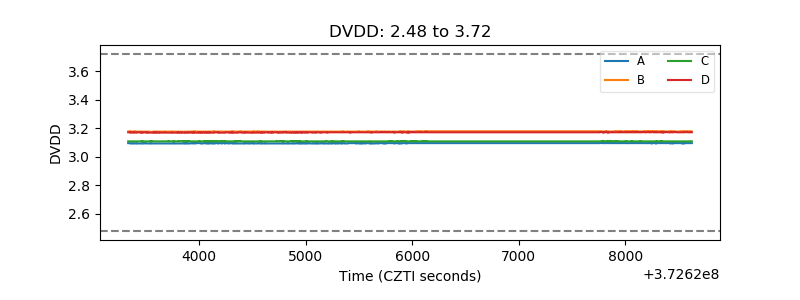 |
| Temperature 1 | 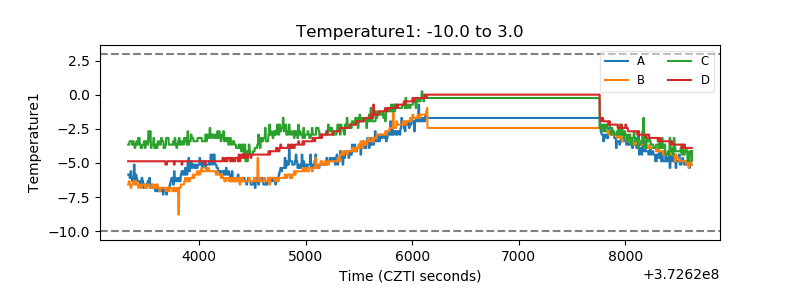 |
| Veto HV Monitor | 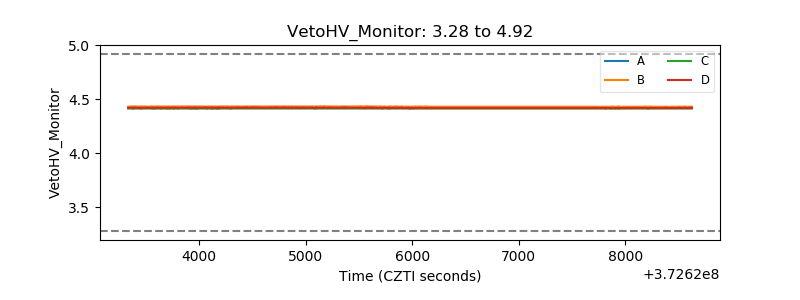 |
| Veto LLD | 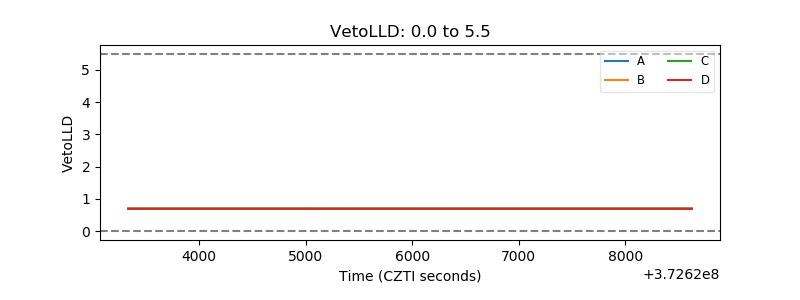 |
| Alpha Counter | 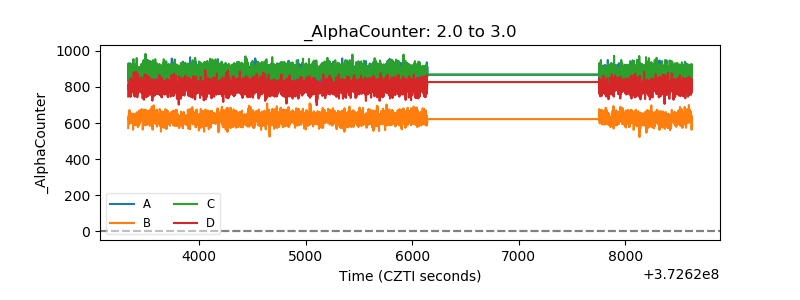 |
| _CPM_Rate | 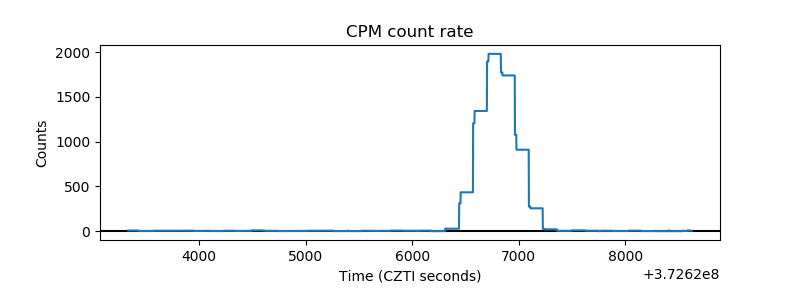 |
| CZT Counter | 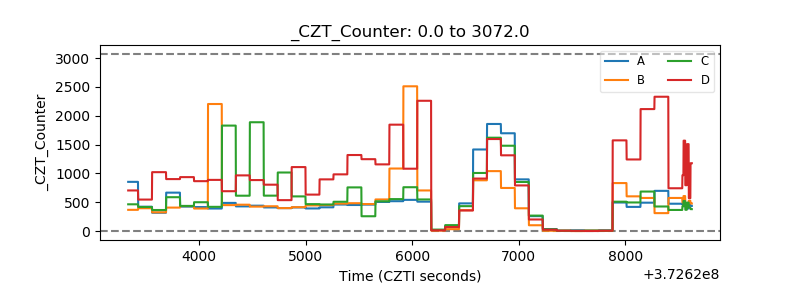 |
| +2.5 Volts monitor | 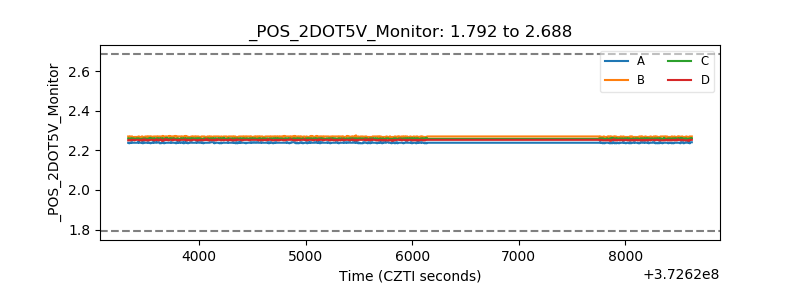 |
| +5 Volts monitor |  |
| _ROLL_ROT | 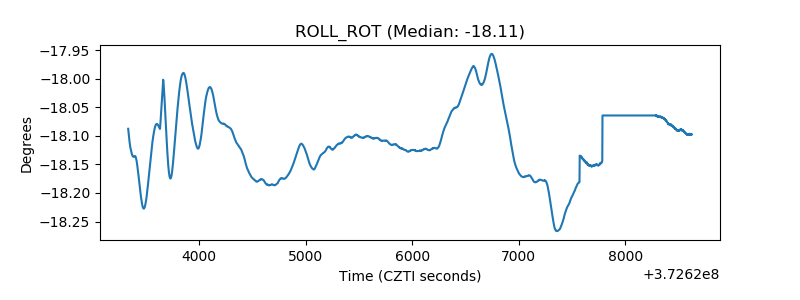 |
| _Roll_DEC | 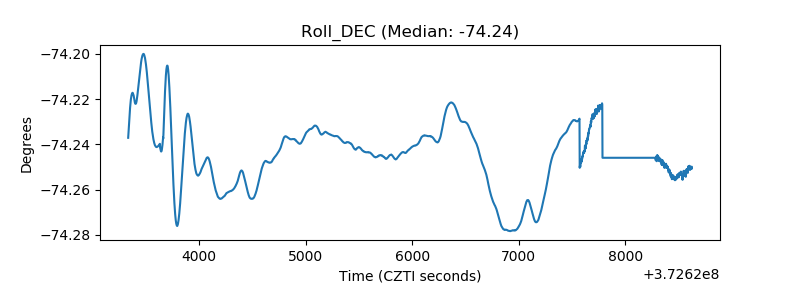 |
| _Roll_RA | 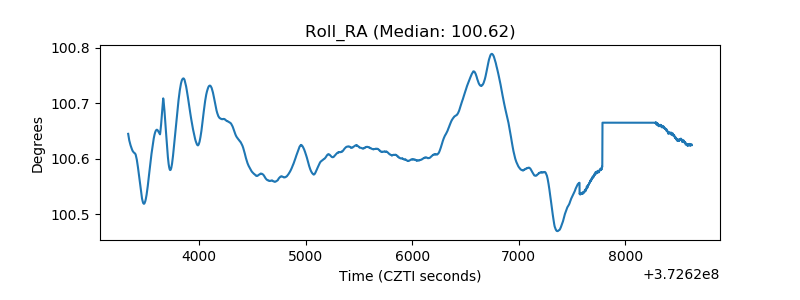 |
| Veto Counter | 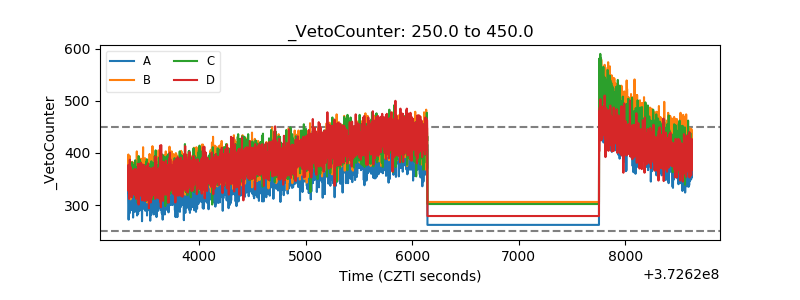 |