| Param | Original file | Final file |
|---|---|---|
| Filename | modeM0/AS1A11_044T01_9000004732_32812cztM0_level2.evt | modeM0/AS1A11_044T01_9000004732_32812cztM0_level2_quad_clean.evt |
| Size (bytes) | 487,739,520 | 104,469,120 |
| Size | 465.1 MB | 99.6 MB |
| Events in quadrant A | 2,542,067 | 714,584 |
| Events in quadrant B | 3,153,629 | 722,361 |
| Events in quadrant C | 3,063,593 | 700,554 |
| Events in quadrant D | 5,646,900 | 649,301 |
| Mode M9 | |||
|---|---|---|---|
| Quadrant | BADHDUFLAG | Total packets | Discarded packets |
| A | 0 | 28 | 0 |
| B | 0 | 28 | 0 |
| C | 0 | 28 | 0 |
| D | 0 | 29 | 0 |
| Mode M0 | |||
|---|---|---|---|
| Quadrant | BADHDUFLAG | Total packets | Discarded packets |
| A | 0 | 11063 | 3 |
| B | 0 | 12976 | 2 |
| C | 0 | 12605 | 2 |
| D | 0 | 20707 | 2 |
| Mode SS | |||
|---|---|---|---|
| Quadrant | BADHDUFLAG | Total packets | Discarded packets |
| A | 0 | 110 | 0 |
| B | 0 | 110 | 0 |
| C | 0 | 110 | 0 |
| D | 0 | 110 | 0 |
| Quadrant | Total seconds | Saturated seconds | Saturation percentage |
|---|---|---|---|
| A | 5382 | 12 | 0.222965% |
| B | 5382 | 159 | 2.954292% |
| C | 5382 | 173 | 3.214418% |
| D | 5382 | 380 | 7.060572% |
Noise dominated data is calculated using 1-second bins in cleaned event files. If a bin has >2000 counts, and if more than 50% of those come from <1% of pixels, then it is considered to be noise-dominated and hence unusable.
| Quadrant | # 1 sec bins | Bins with >0 counts | Bins with >2000 counts | High rate bins dominated by noise | Noise dominated (total time) | Noise dominated (detector-on time) | Marked lightcurve |
|---|---|---|---|---|---|---|---|
| A | 7144 | 5383 | 3 | 3 | 0.04% | 0.06% | 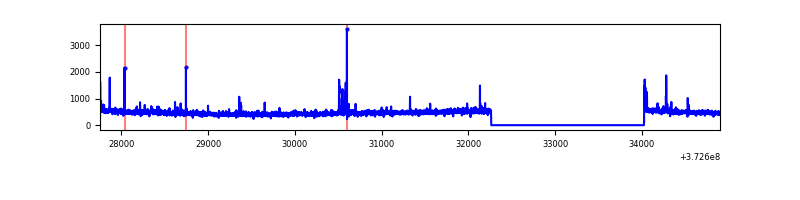 |
| B | 7144 | 5383 | 96 | 96 | 1.34% | 1.78% | 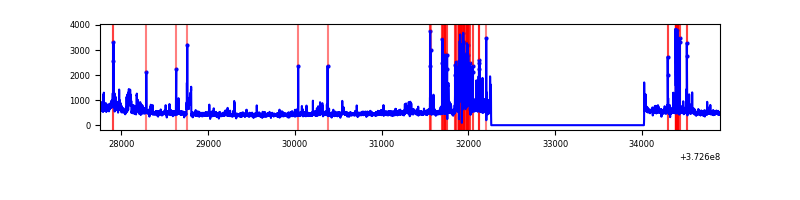 |
| C | 7144 | 5383 | 142 | 142 | 1.99% | 2.64% | 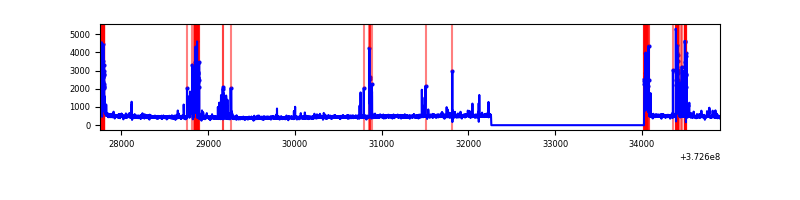 |
| D | 7144 | 5383 | 324 | 324 | 4.54% | 6.02% | 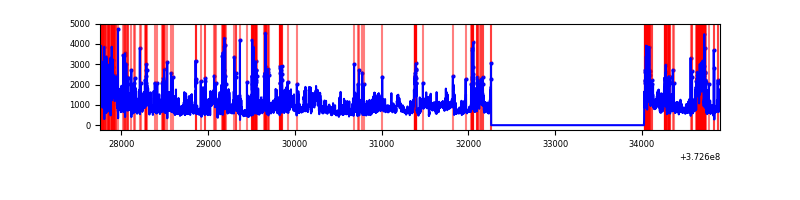 |
Top three noisy pixels from each quadrant. If the there are fewer than three noisy pixels in the level2.evt file, extra rows are filled as -1
| Pixel properties | Quadrant properties | ||||||
|---|---|---|---|---|---|---|---|
| Quadrant | DetID | PixID | Counts | Sigma | Mean | Median | Sigma |
| A | 14 | 238 | 37186 | 290.23 | 631 | 618 | 126.0 |
| A | 9 | 143 | 27220 | 211.13 | 631 | 618 | 126.0 |
| A | 15 | 17 | 13654 | 103.46 | 631 | 618 | 126.0 |
| B | 5 | 172 | 273936 | 2312.26 | 632 | 617 | 118.2 |
| B | 0 | 219 | 101202 | 850.94 | 632 | 617 | 118.2 |
| B | 5 | 200 | 85585 | 718.82 | 632 | 617 | 118.2 |
| C | 0 | 10 | 456246 | 3246.76 | 609 | 615 | 140.3 |
| C | 1 | 23 | 133119 | 944.2 | 609 | 615 | 140.3 |
| C | 3 | 233 | 22902 | 158.81 | 609 | 615 | 140.3 |
| D | 8 | 195 | 1848574 | 12032.61 | 596 | 583 | 153.6 |
| D | 2 | 250 | 371279 | 2413.67 | 596 | 583 | 153.6 |
| D | 12 | 6 | 222037 | 1441.93 | 596 | 583 | 153.6 |
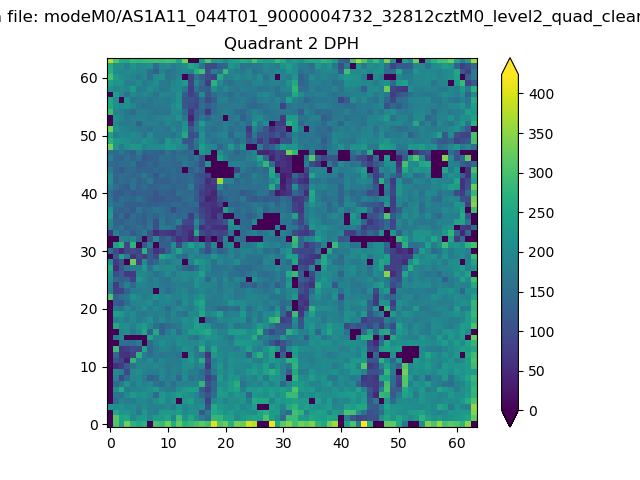
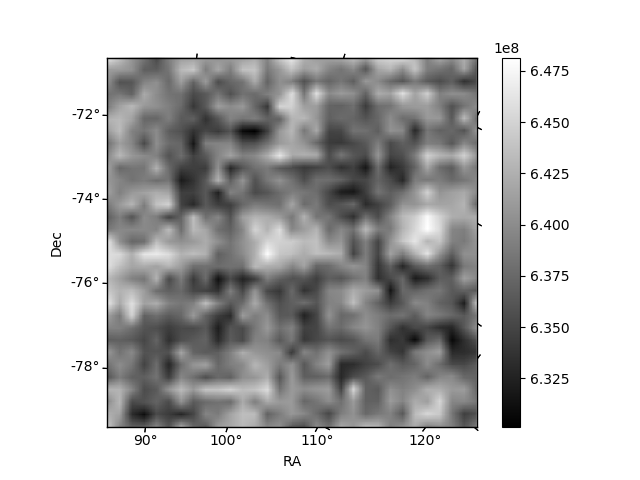
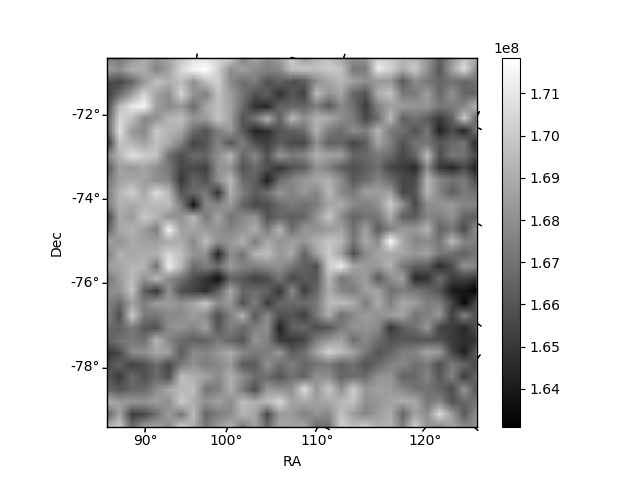
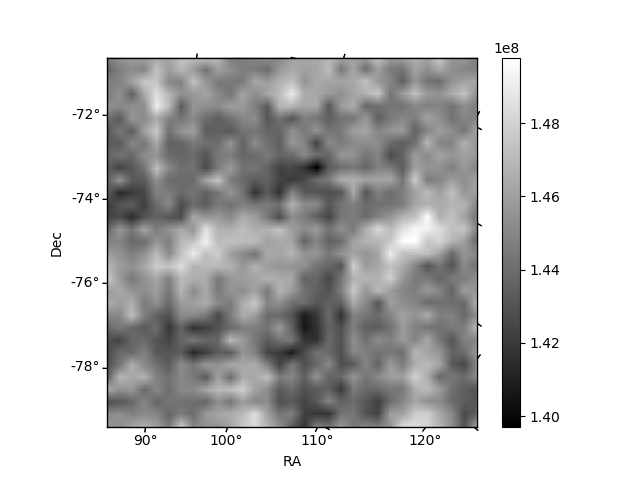
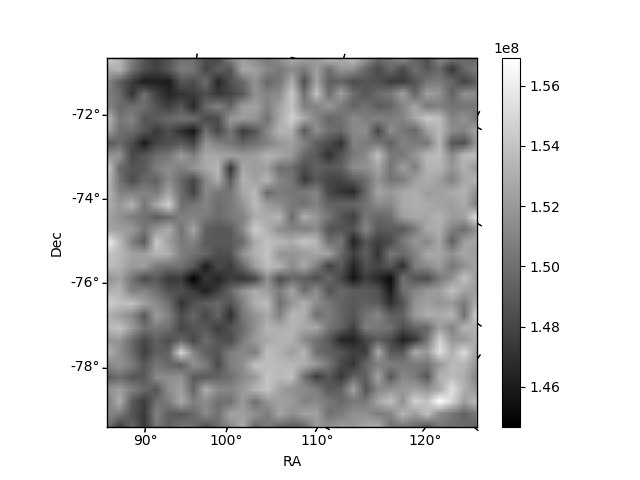
Histogram calculated using DETX and DETY for each event in the final _common_clean file
| Quadrant A | 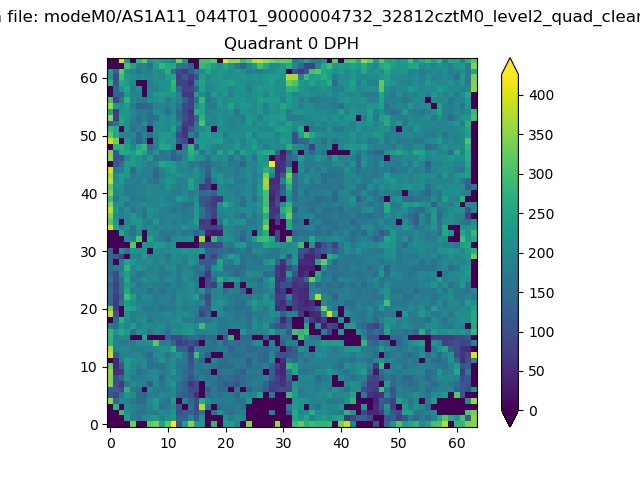 |
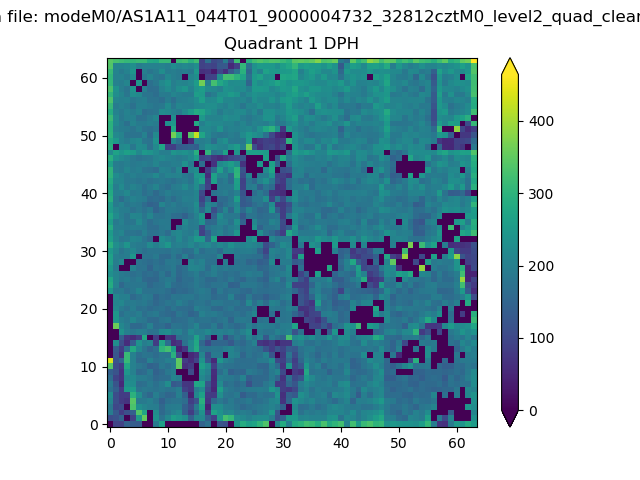 |
Quadrant B |
|---|---|---|---|
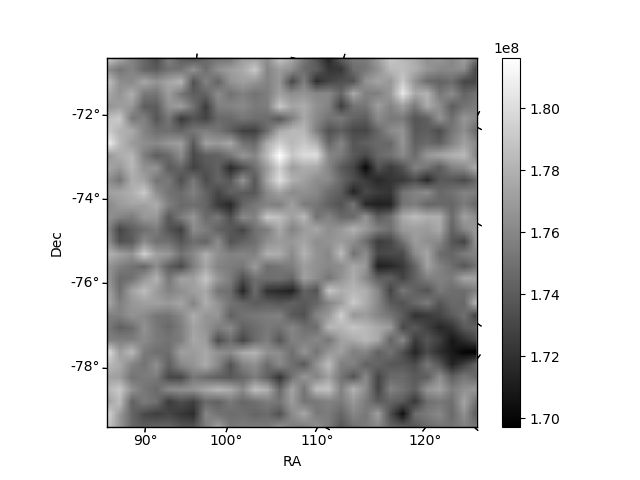
| Quadrant D | 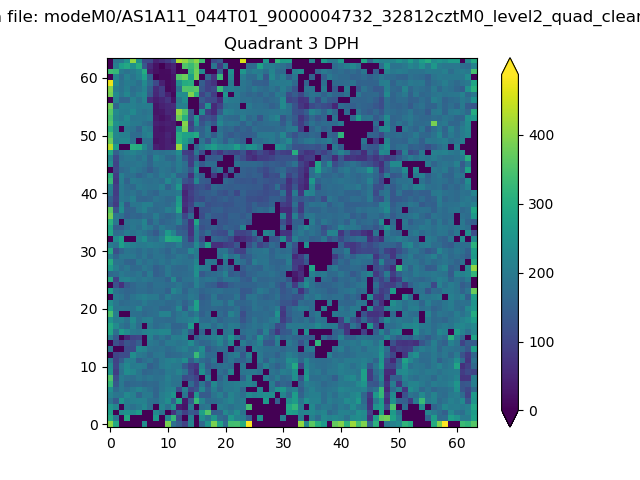 |
 |
Quadrant C |
| Plot type | Count rate plots | Images |
|---|---|---|
| Comparison with Poisson distribution Blue bars denote a histogram of data divided into 1 sec bins. Red curve is a Poisson curve with rate = median count rate of data. |
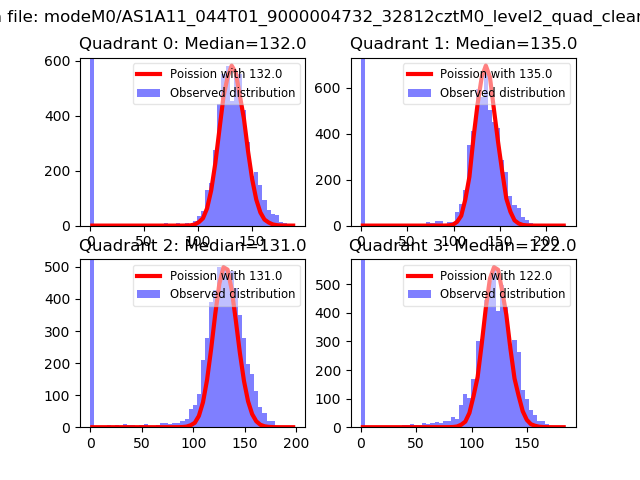 |
 |
| Quadrant-wise count rates Data is divided into 100 sec bins |
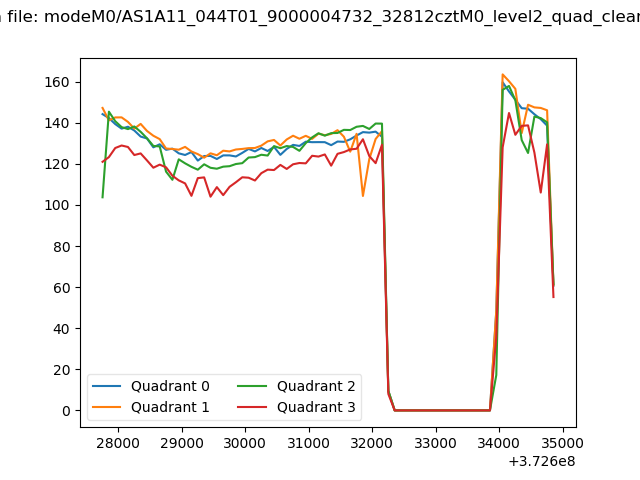 |
|
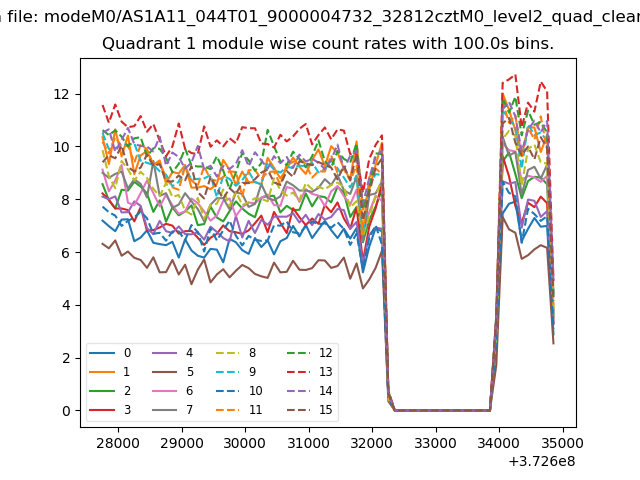
| Module-wise count rates for Quadrant A Data is divided into 100 sec bins |
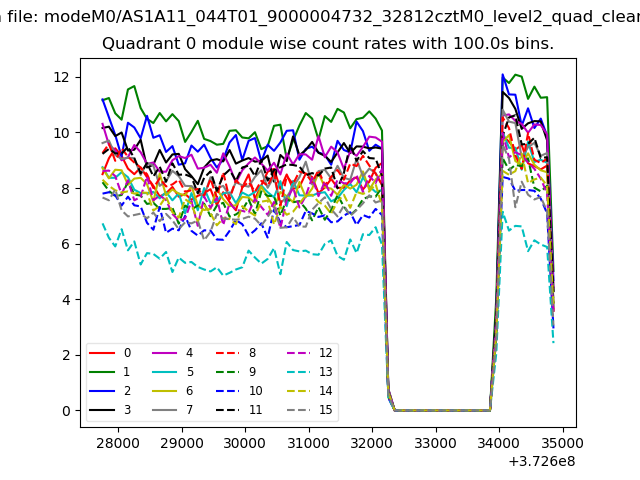 |
 |
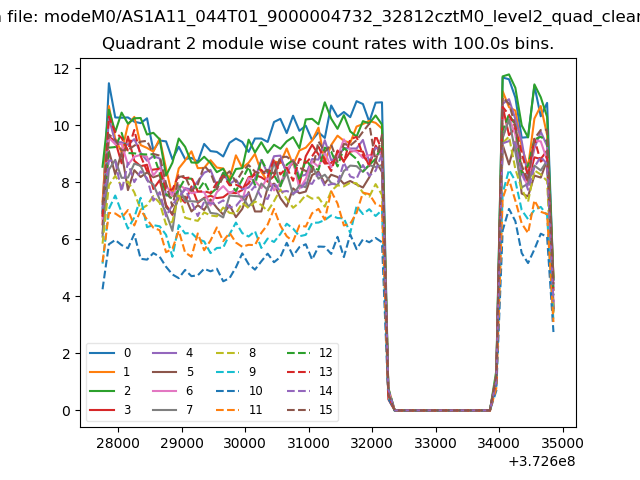
| Module-wise count rates for Quadrant B Data is divided into 100 sec bins |
 |
 |
| Module-wise count rates for Quadrant C Data is divided into 100 sec bins |
 |
 |
| Module-wise count rates for Quadrant D Data is divided into 100 sec bins |
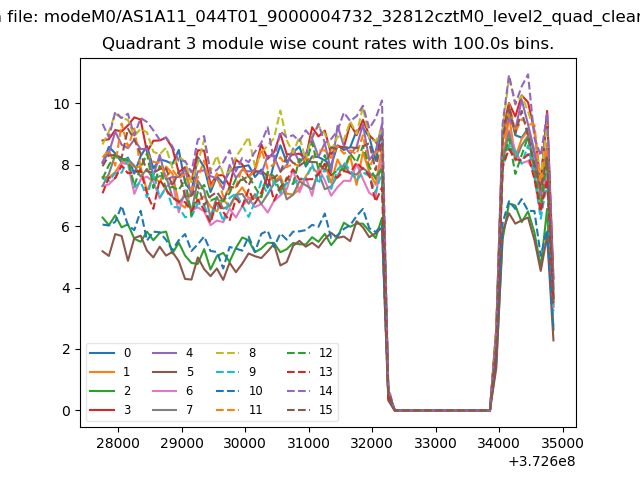 |
 |
| Parameter | Plot |
|---|---|
| CZT HV Monitor | 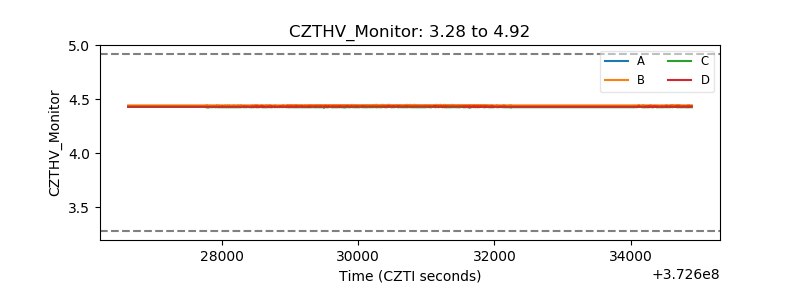 |
| D_VDD | 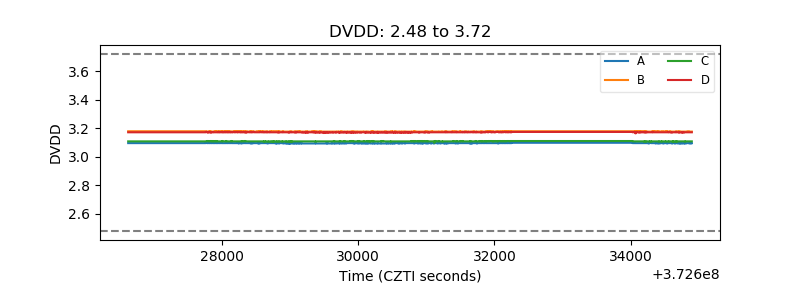 |
| Temperature 1 | 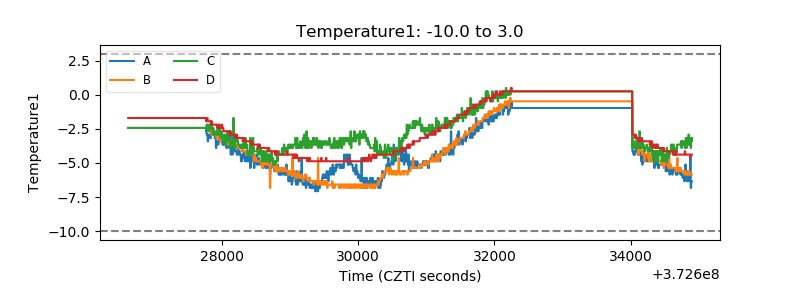 |
| Veto HV Monitor | 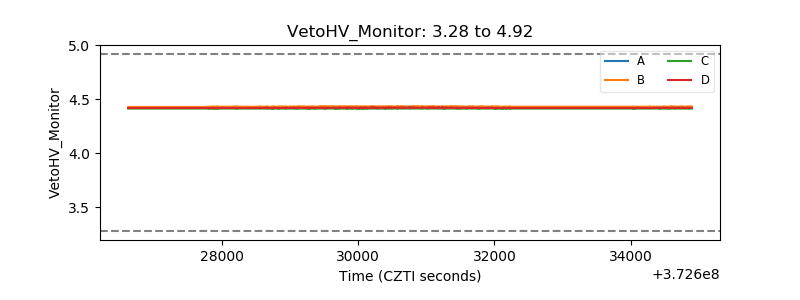 |
| Veto LLD | 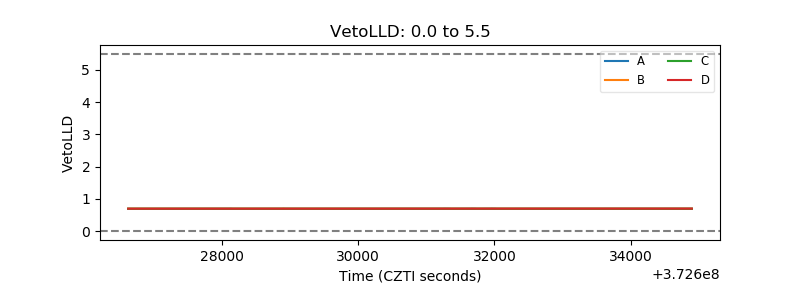 |
| Alpha Counter | 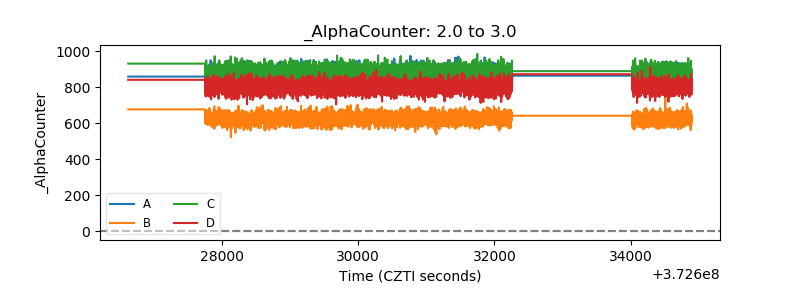 |
| _CPM_Rate | 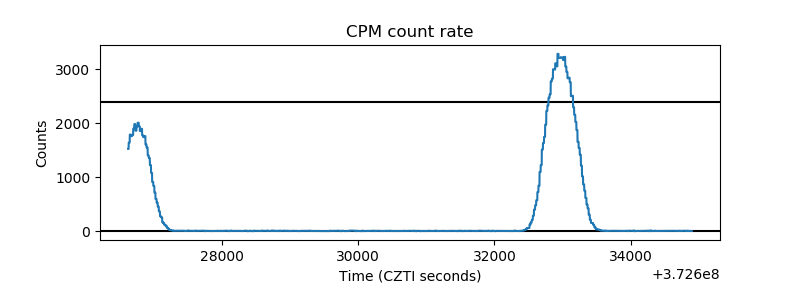 |
| CZT Counter | 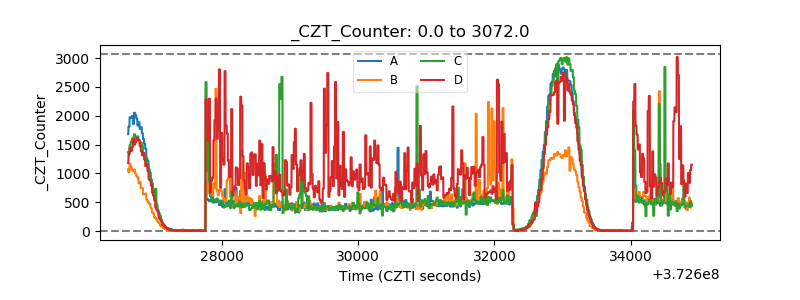 |
| +2.5 Volts monitor |  |
| +5 Volts monitor |  |
| _ROLL_ROT | 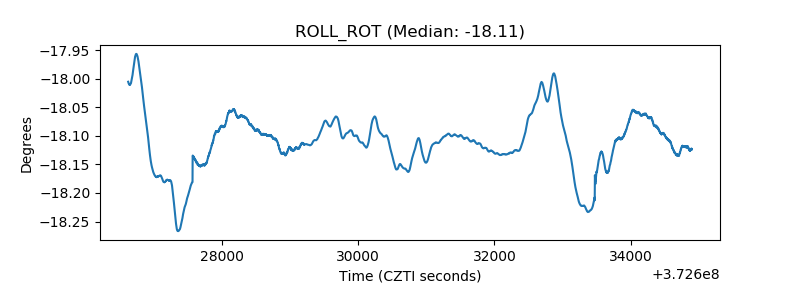 |
| _Roll_DEC | 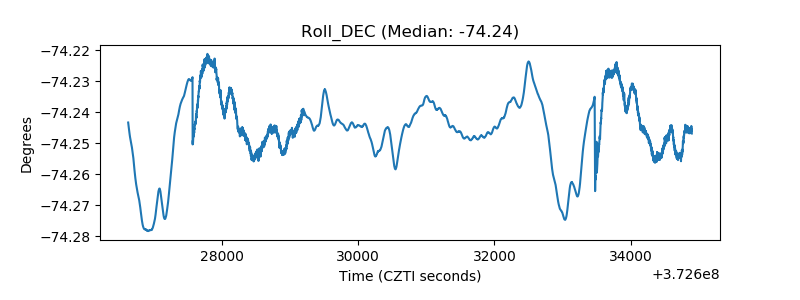 |
| _Roll_RA | 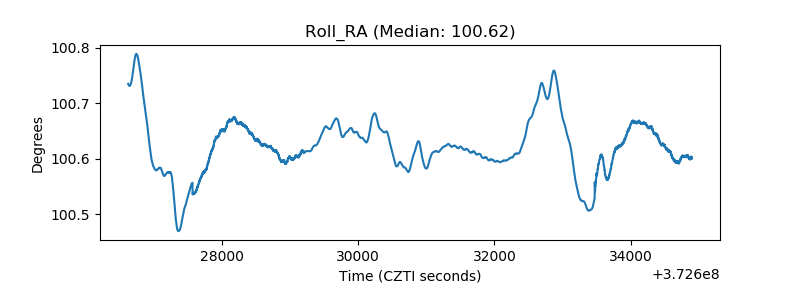 |
| Veto Counter | 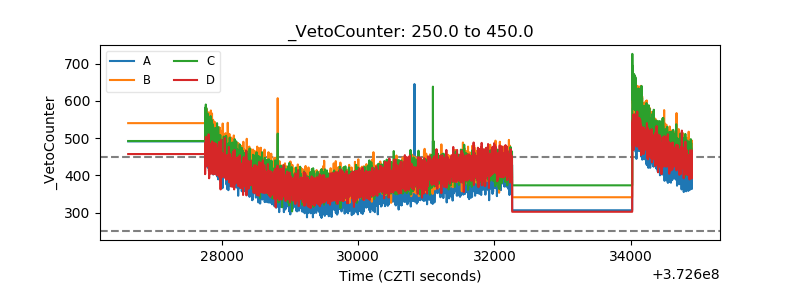 |