| Param | Original file | Final file |
|---|---|---|
| Filename | modeM0/AS1A11_044T01_9000004732_32814cztM0_level2.evt | modeM0/AS1A11_044T01_9000004732_32814cztM0_level2_quad_clean.evt |
| Size (bytes) | 543,905,280 | 115,038,720 |
| Size | 518.7 MB | 109.7 MB |
| Events in quadrant A | 2,623,040 | 790,667 |
| Events in quadrant B | 3,327,194 | 803,517 |
| Events in quadrant C | 3,057,776 | 804,140 |
| Events in quadrant D | 7,100,079 | 708,907 |
| Mode M9 | |||
|---|---|---|---|
| Quadrant | BADHDUFLAG | Total packets | Discarded packets |
| A | 0 | 28 | 0 |
| B | 0 | 28 | 0 |
| C | 0 | 28 | 0 |
| D | 0 | 29 | 0 |
| Mode M0 | |||
|---|---|---|---|
| Quadrant | BADHDUFLAG | Total packets | Discarded packets |
| A | 0 | 11007 | 3 |
| B | 0 | 13175 | 2 |
| C | 0 | 12207 | 2 |
| D | 0 | 24925 | 2 |
| Mode SS | |||
|---|---|---|---|
| Quadrant | BADHDUFLAG | Total packets | Discarded packets |
| A | 0 | 110 | 0 |
| B | 0 | 110 | 0 |
| C | 0 | 110 | 0 |
| D | 0 | 110 | 0 |
| Quadrant | Total seconds | Saturated seconds | Saturation percentage |
|---|---|---|---|
| A | 5381 | 5 | 0.092920% |
| B | 5381 | 225 | 4.181379% |
| C | 5381 | 71 | 1.319457% |
| D | 5381 | 613 | 11.391935% |
Noise dominated data is calculated using 1-second bins in cleaned event files. If a bin has >2000 counts, and if more than 50% of those come from <1% of pixels, then it is considered to be noise-dominated and hence unusable.
| Quadrant | # 1 sec bins | Bins with >0 counts | Bins with >2000 counts | High rate bins dominated by noise | Noise dominated (total time) | Noise dominated (detector-on time) | Marked lightcurve |
|---|---|---|---|---|---|---|---|
| A | 7383 | 5382 | 0 | 0 | 0.00% | 0.00% | 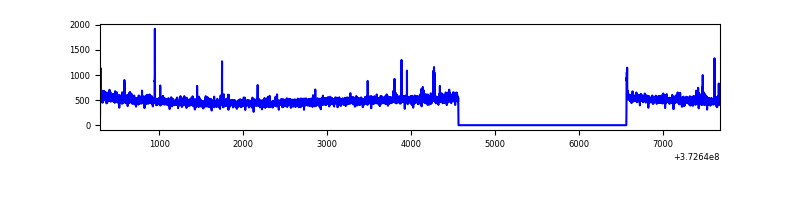 |
| B | 7383 | 5382 | 138 | 138 | 1.87% | 2.56% | 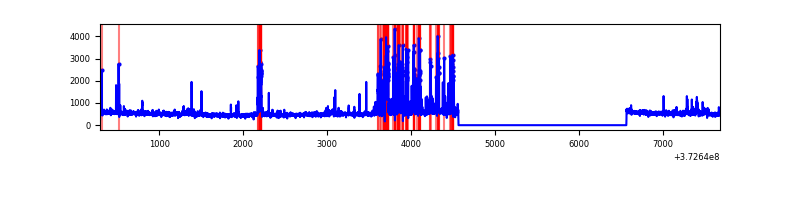 |
| C | 7383 | 5382 | 58 | 58 | 0.79% | 1.08% | 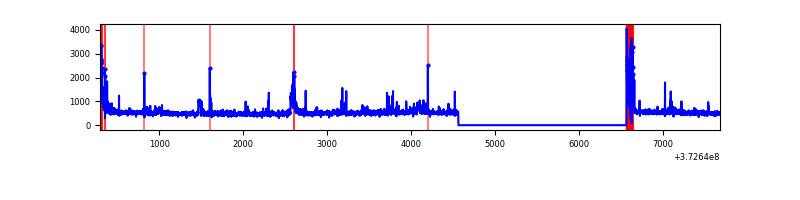 |
| D | 7383 | 5382 | 560 | 560 | 7.58% | 10.41% |  |
Top three noisy pixels from each quadrant. If the there are fewer than three noisy pixels in the level2.evt file, extra rows are filled as -1
| Pixel properties | Quadrant properties | ||||||
|---|---|---|---|---|---|---|---|
| Quadrant | DetID | PixID | Counts | Sigma | Mean | Median | Sigma |
| A | 9 | 143 | 20005 | 146.45 | 666 | 656 | 132.1 |
| A | 7 | 16 | 12148 | 86.98 | 666 | 656 | 132.1 |
| A | 13 | 254 | 10383 | 73.62 | 666 | 656 | 132.1 |
| B | 5 | 172 | 570268 | 4702.12 | 666 | 650 | 121.1 |
| B | 0 | 199 | 45080 | 366.76 | 666 | 650 | 121.1 |
| B | 0 | 230 | 36666 | 297.31 | 666 | 650 | 121.1 |
| C | 0 | 10 | 313272 | 2055.18 | 665 | 672 | 152.1 |
| C | 3 | 233 | 51428 | 333.69 | 665 | 672 | 152.1 |
| C | 14 | 67 | 50340 | 326.54 | 665 | 672 | 152.1 |
| D | 8 | 195 | 2701319 | 17351.88 | 634 | 620 | 155.6 |
| D | 12 | 6 | 901330 | 5787.02 | 634 | 620 | 155.6 |
| D | 2 | 250 | 242608 | 1554.76 | 634 | 620 | 155.6 |
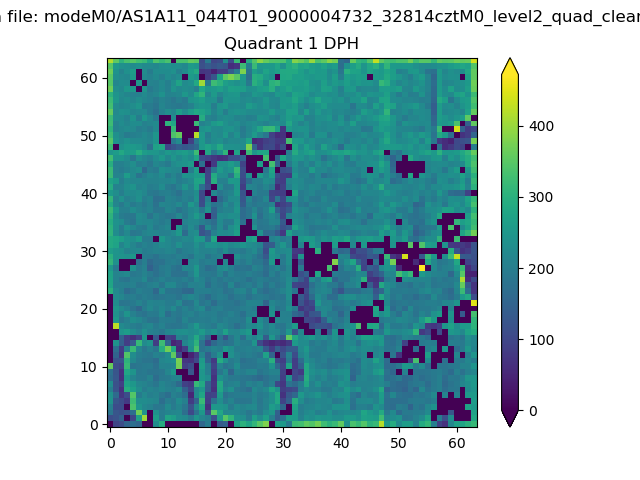
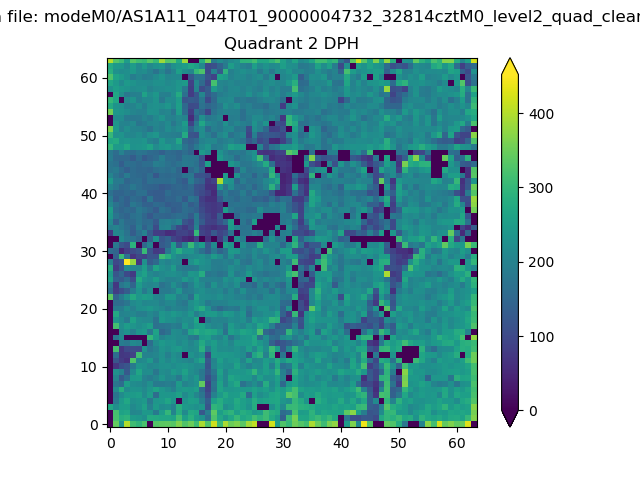
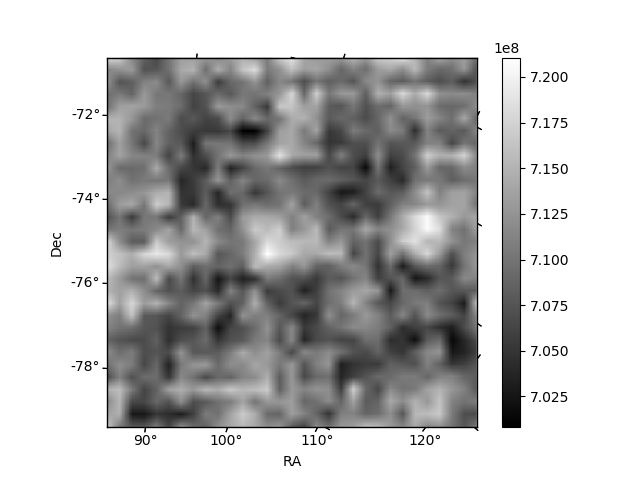
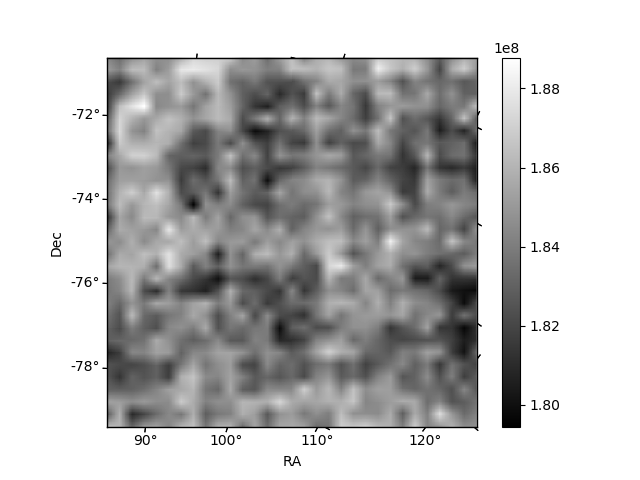
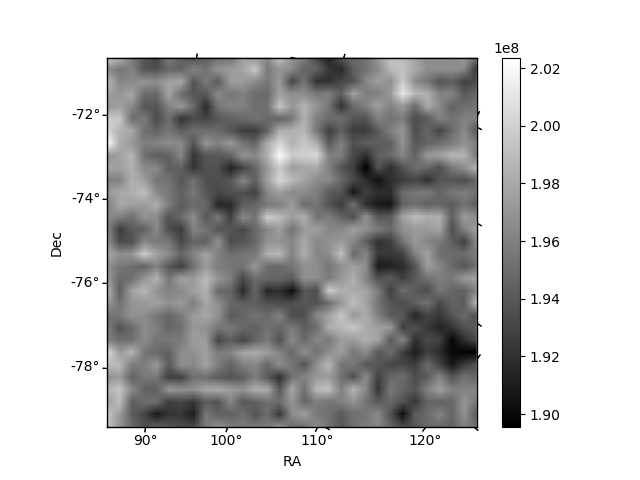
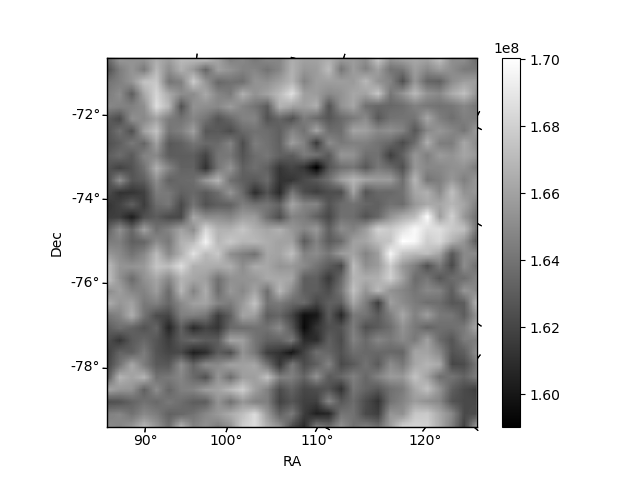
Histogram calculated using DETX and DETY for each event in the final _common_clean file
| Quadrant A | 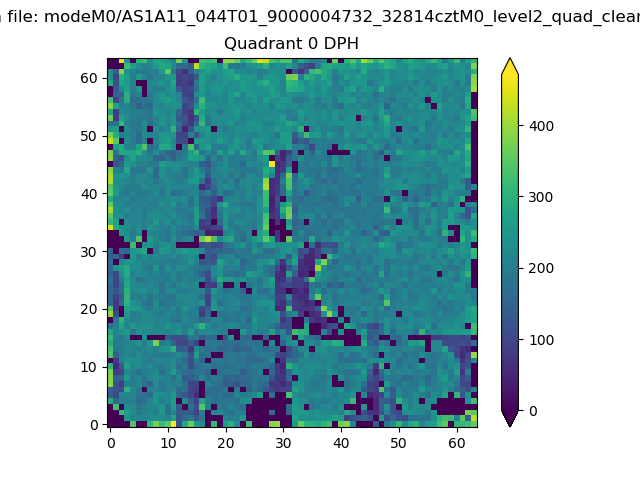 |
 |
Quadrant B |
|---|---|---|---|
| Quadrant D | 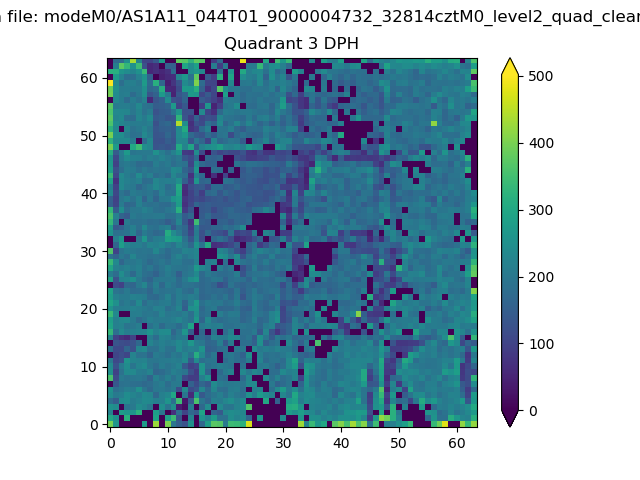 |
 |
Quadrant C |
| Plot type | Count rate plots | Images |
|---|---|---|
| Comparison with Poisson distribution Blue bars denote a histogram of data divided into 1 sec bins. Red curve is a Poisson curve with rate = median count rate of data. |
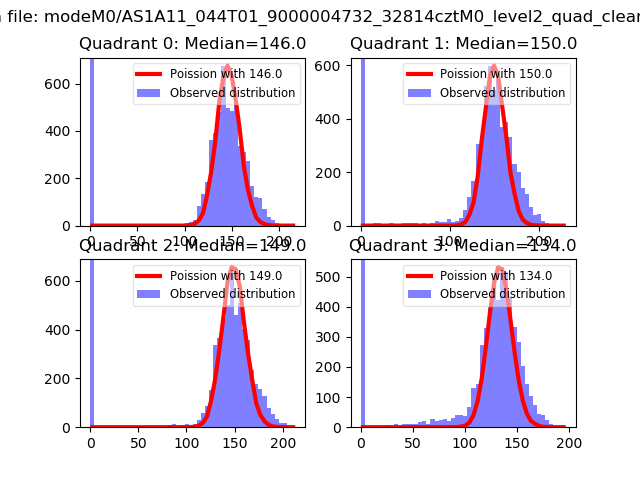 |
 |
| Quadrant-wise count rates Data is divided into 100 sec bins |
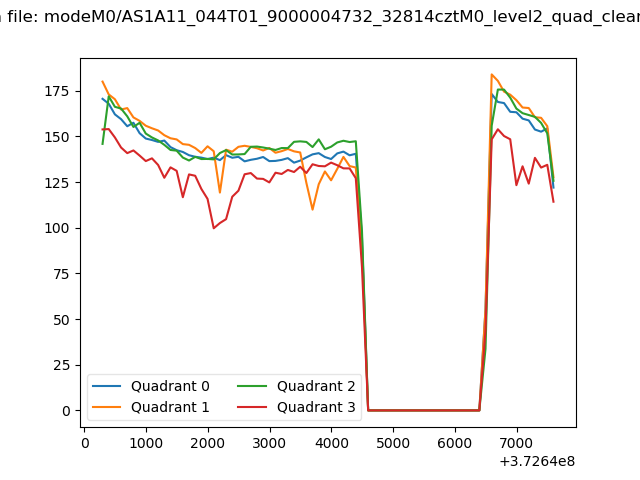 |
|
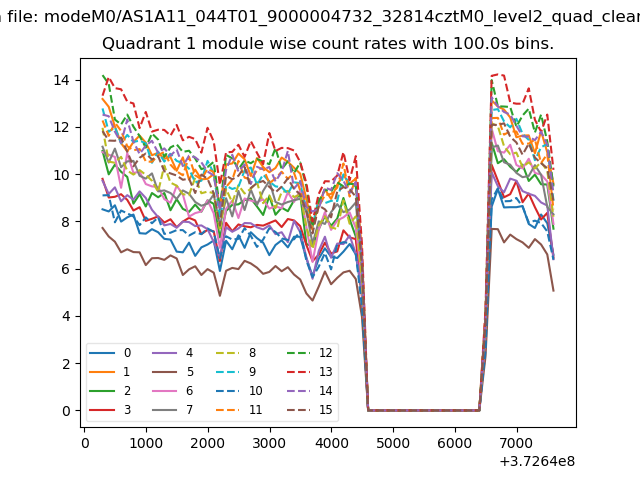
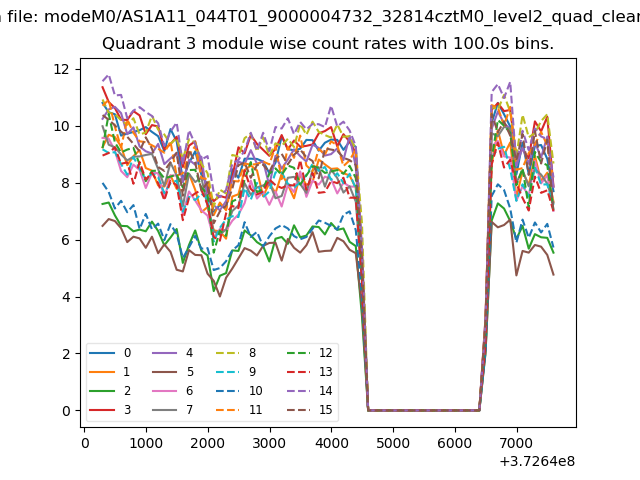
| Module-wise count rates for Quadrant A Data is divided into 100 sec bins |
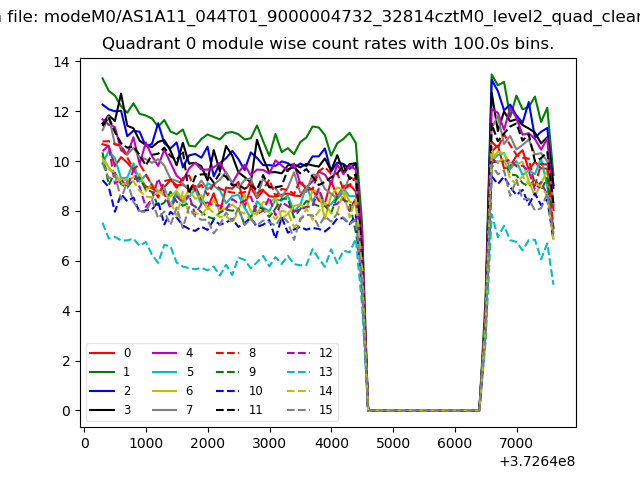 |
 |
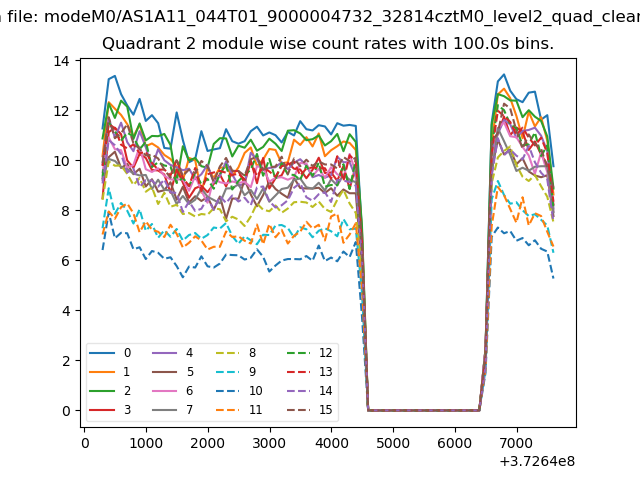
| Module-wise count rates for Quadrant B Data is divided into 100 sec bins |
 |
 |
| Module-wise count rates for Quadrant C Data is divided into 100 sec bins |
 |
 |
| Module-wise count rates for Quadrant D Data is divided into 100 sec bins |
 |
 |
| Parameter | Plot |
|---|---|
| CZT HV Monitor | 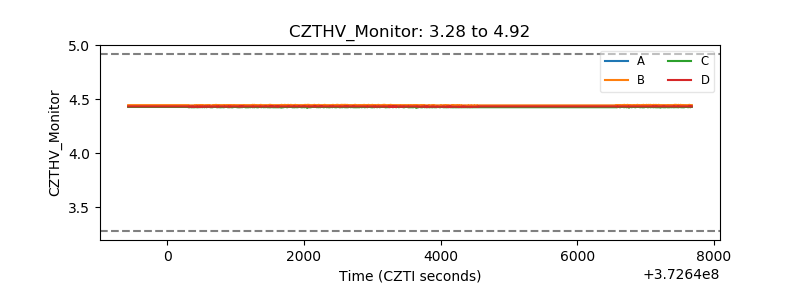 |
| D_VDD | 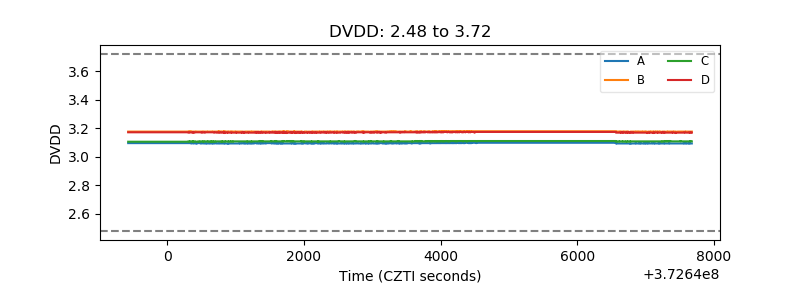 |
| Temperature 1 | 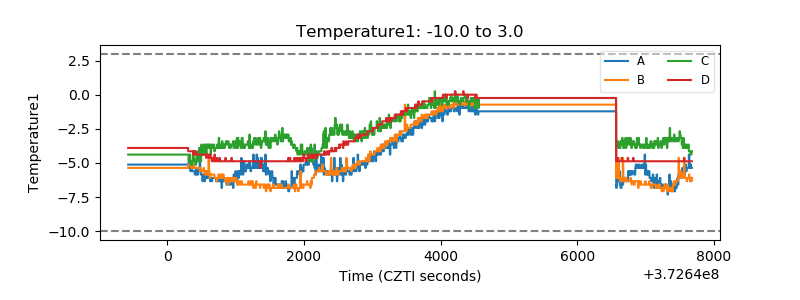 |
| Veto HV Monitor | 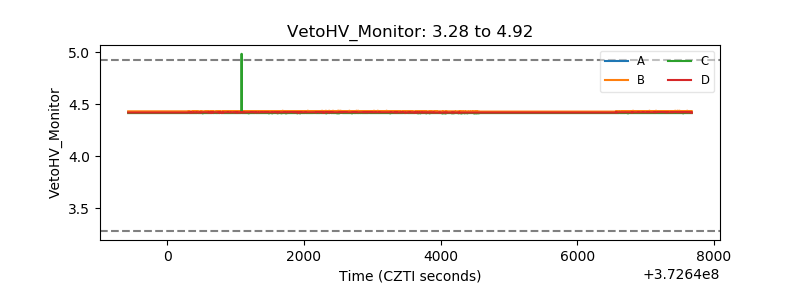 |
| Veto LLD | 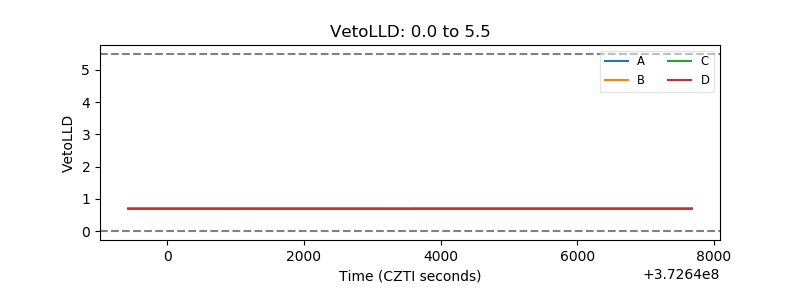 |
| Alpha Counter | 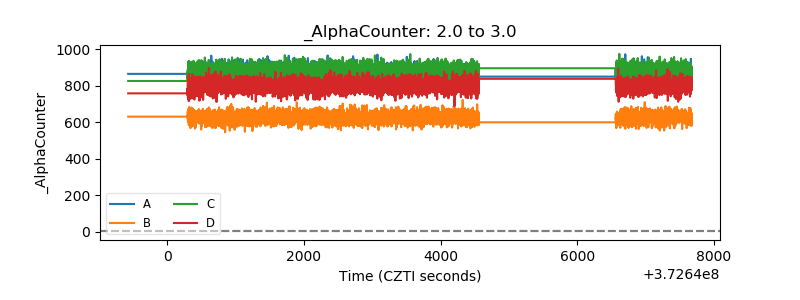 |
| _CPM_Rate | 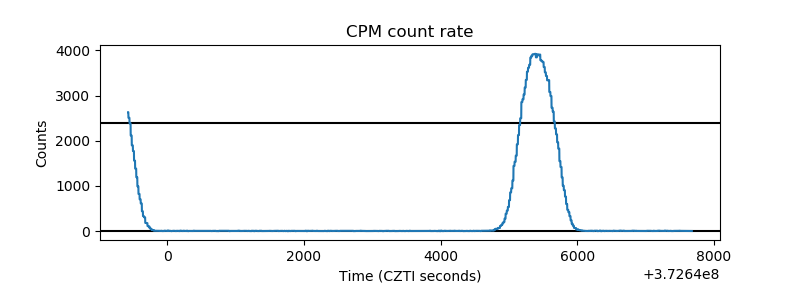 |
| CZT Counter | 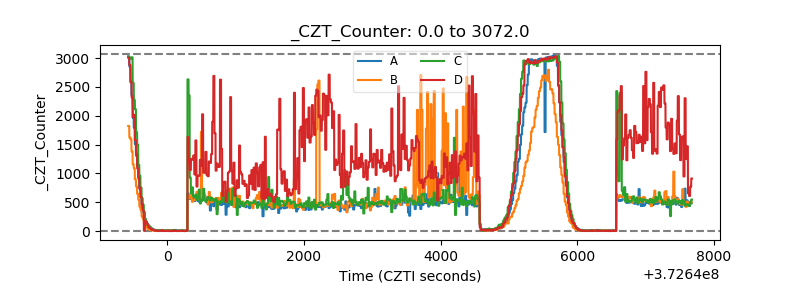 |
| +2.5 Volts monitor |  |
| +5 Volts monitor |  |
| _ROLL_ROT | 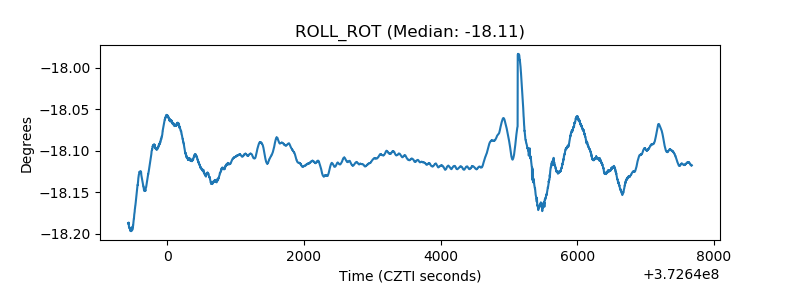 |
| _Roll_DEC | 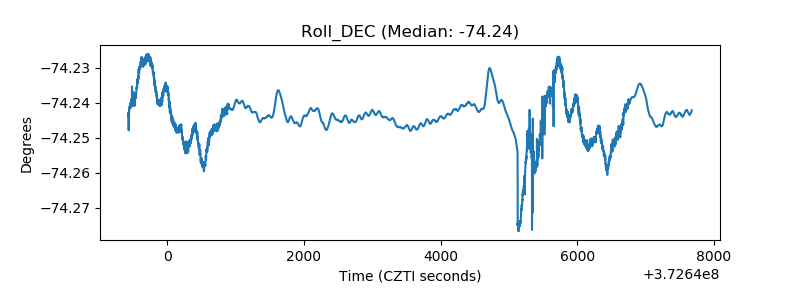 |
| _Roll_RA | 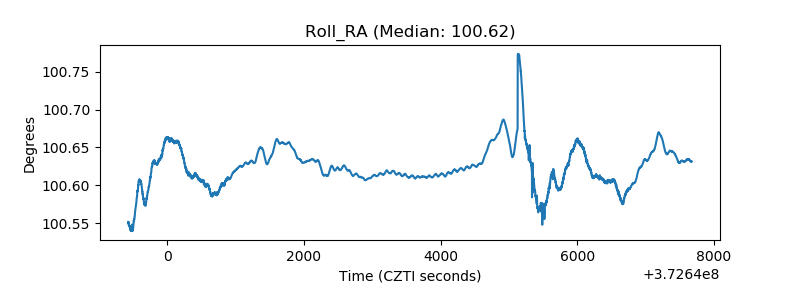 |
| Veto Counter | 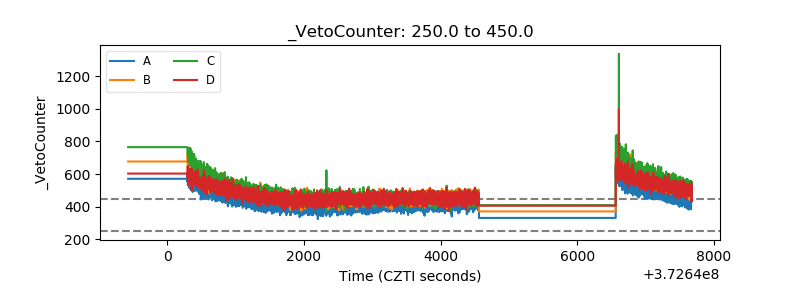 |