| Param | Original file | Final file |
|---|---|---|
| Filename | modeM0/AS1A11_044T01_9000004732_32815cztM0_level2.evt | modeM0/AS1A11_044T01_9000004732_32815cztM0_level2_quad_clean.evt |
| Size (bytes) | 533,782,080 | 112,452,480 |
| Size | 509.1 MB | 107.2 MB |
| Events in quadrant A | 2,624,161 | 768,964 |
| Events in quadrant B | 3,205,877 | 791,507 |
| Events in quadrant C | 2,941,565 | 793,535 |
| Events in quadrant D | 7,044,572 | 689,679 |
| Mode M9 | |||
|---|---|---|---|
| Quadrant | BADHDUFLAG | Total packets | Discarded packets |
| A | 0 | 21 | 0 |
| B | 0 | 21 | 0 |
| C | 0 | 21 | 0 |
| D | 0 | 22 | 0 |
| Mode M0 | |||
|---|---|---|---|
| Quadrant | BADHDUFLAG | Total packets | Discarded packets |
| A | 0 | 10804 | 3 |
| B | 0 | 12653 | 2 |
| C | 0 | 11597 | 2 |
| D | 0 | 24669 | 2 |
| Mode SS | |||
|---|---|---|---|
| Quadrant | BADHDUFLAG | Total packets | Discarded packets |
| A | 0 | 104 | 0 |
| B | 0 | 104 | 0 |
| C | 0 | 104 | 0 |
| D | 0 | 104 | 0 |
| Quadrant | Total seconds | Saturated seconds | Saturation percentage |
|---|---|---|---|
| A | 5168 | 18 | 0.348297% |
| B | 5168 | 127 | 2.457430% |
| C | 5168 | 63 | 1.219040% |
| D | 5168 | 886 | 17.143963% |
Noise dominated data is calculated using 1-second bins in cleaned event files. If a bin has >2000 counts, and if more than 50% of those come from <1% of pixels, then it is considered to be noise-dominated and hence unusable.
| Quadrant | # 1 sec bins | Bins with >0 counts | Bins with >2000 counts | High rate bins dominated by noise | Noise dominated (total time) | Noise dominated (detector-on time) | Marked lightcurve |
|---|---|---|---|---|---|---|---|
| A | 7261 | 5169 | 9 | 9 | 0.12% | 0.17% | 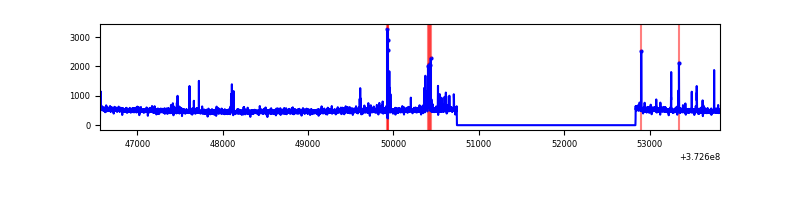 |
| B | 7261 | 5169 | 78 | 78 | 1.07% | 1.51% | 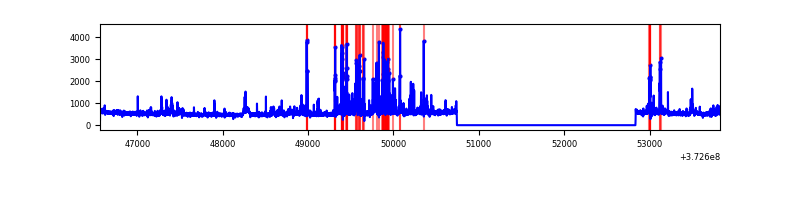 |
| C | 7261 | 5169 | 51 | 51 | 0.70% | 0.99% | 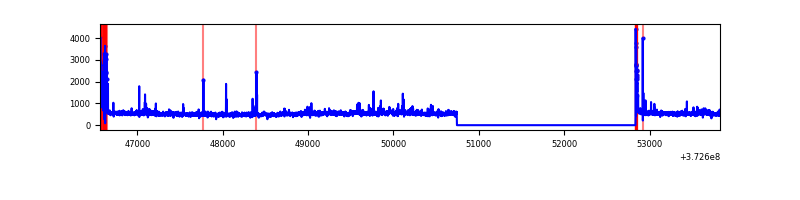 |
| D | 7261 | 5169 | 766 | 766 | 10.55% | 14.82% | 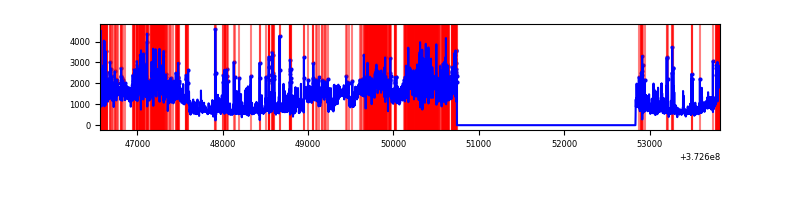 |
Top three noisy pixels from each quadrant. If the there are fewer than three noisy pixels in the level2.evt file, extra rows are filled as -1
| Pixel properties | Quadrant properties | ||||||
|---|---|---|---|---|---|---|---|
| Quadrant | DetID | PixID | Counts | Sigma | Mean | Median | Sigma |
| A | 15 | 17 | 42872 | 330.29 | 647 | 635 | 127.9 |
| A | 9 | 143 | 41209 | 317.29 | 647 | 635 | 127.9 |
| A | 7 | 16 | 30190 | 231.12 | 647 | 635 | 127.9 |
| B | 5 | 172 | 384745 | 3239.74 | 653 | 639 | 118.6 |
| B | 12 | 1 | 64691 | 540.25 | 653 | 639 | 118.6 |
| B | 0 | 229 | 63425 | 529.57 | 653 | 639 | 118.6 |
| C | 0 | 10 | 303670 | 2046.62 | 652 | 660 | 148.1 |
| C | 14 | 67 | 28358 | 187.08 | 652 | 660 | 148.1 |
| C | 3 | 233 | 17548 | 114.07 | 652 | 660 | 148.1 |
| D | 8 | 195 | 2808474 | 18130.68 | 615 | 605 | 154.9 |
| D | 12 | 6 | 454152 | 2928.6 | 615 | 605 | 154.9 |
| D | 2 | 250 | 417787 | 2693.78 | 615 | 605 | 154.9 |
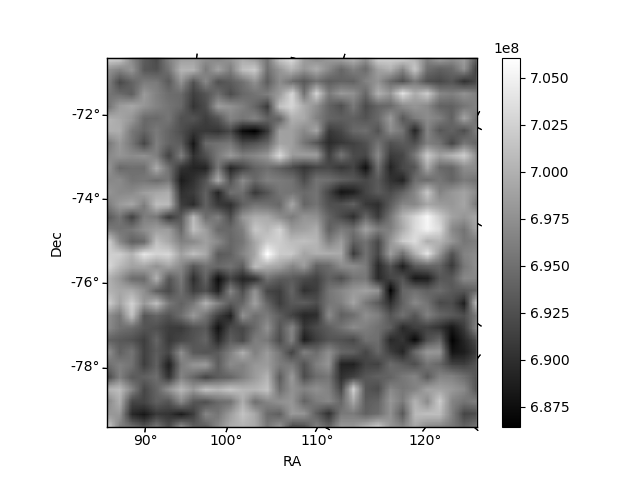
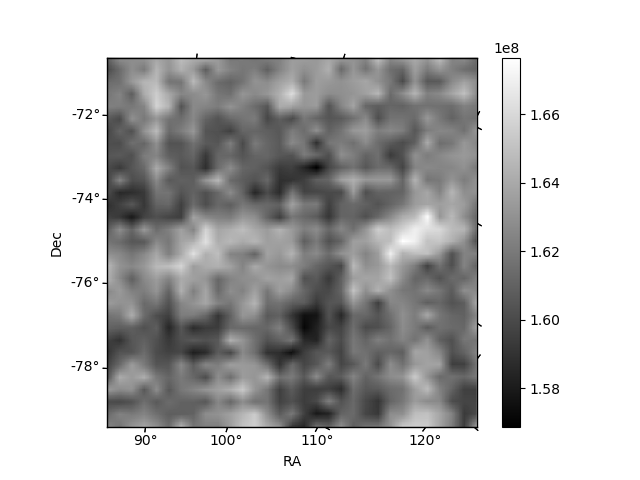
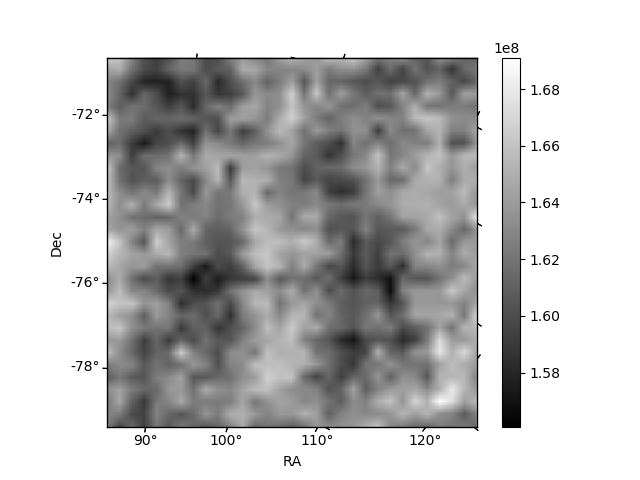
Histogram calculated using DETX and DETY for each event in the final _common_clean file
| Quadrant A | 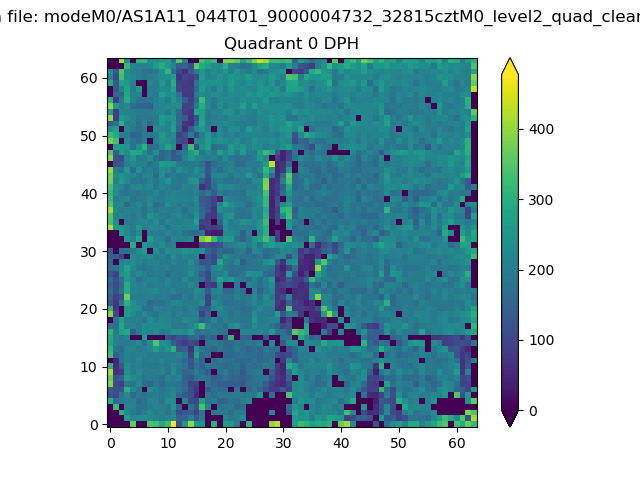 |
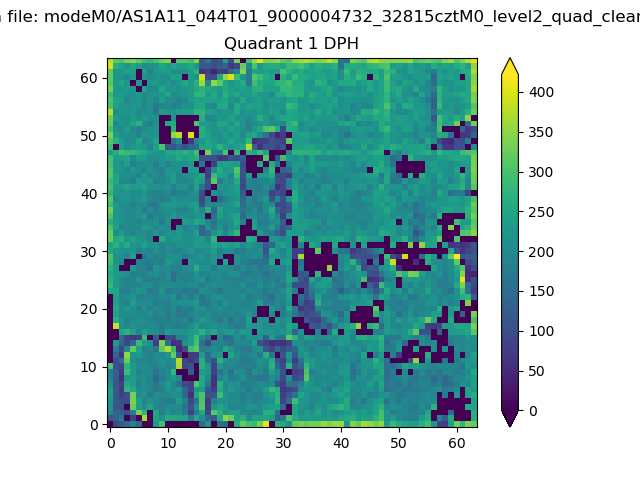 |
Quadrant B |
|---|---|---|---|
| Quadrant D | 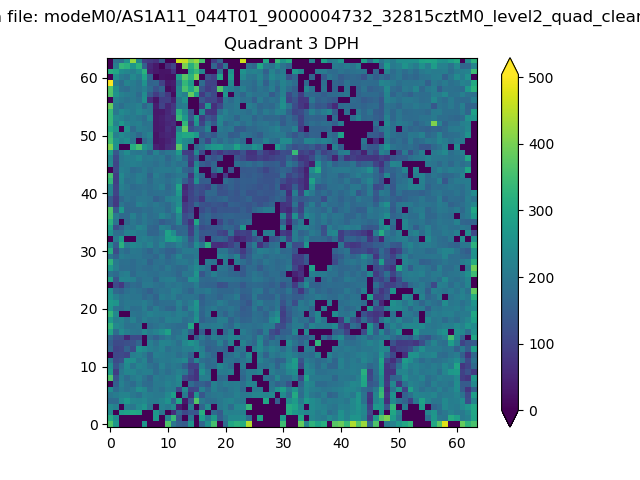 |
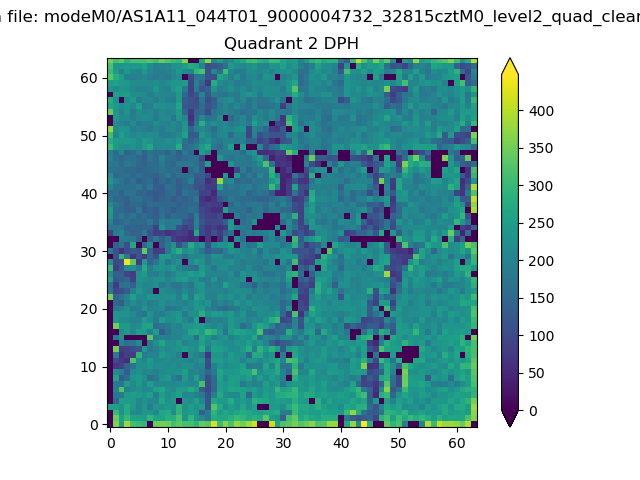 |
Quadrant C |
| Plot type | Count rate plots | Images |
|---|---|---|
| Comparison with Poisson distribution Blue bars denote a histogram of data divided into 1 sec bins. Red curve is a Poisson curve with rate = median count rate of data. |
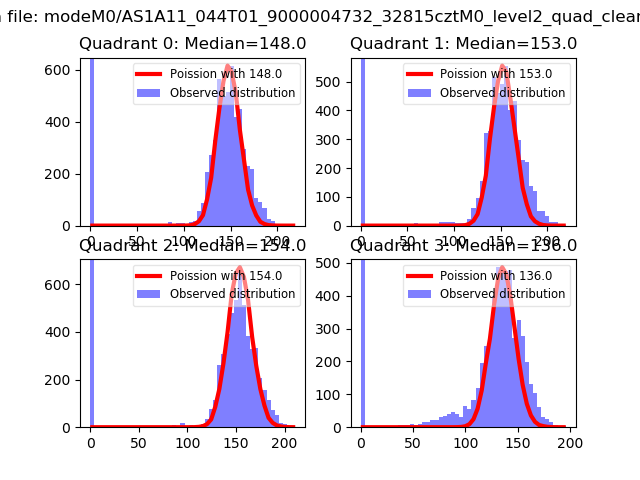 |
 |
| Quadrant-wise count rates Data is divided into 100 sec bins |
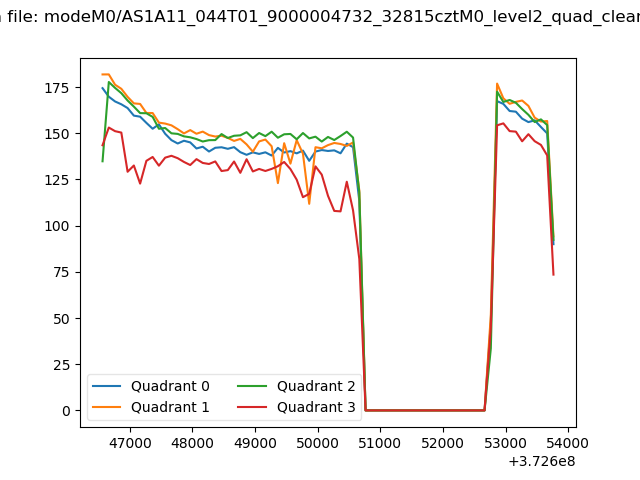 |
|
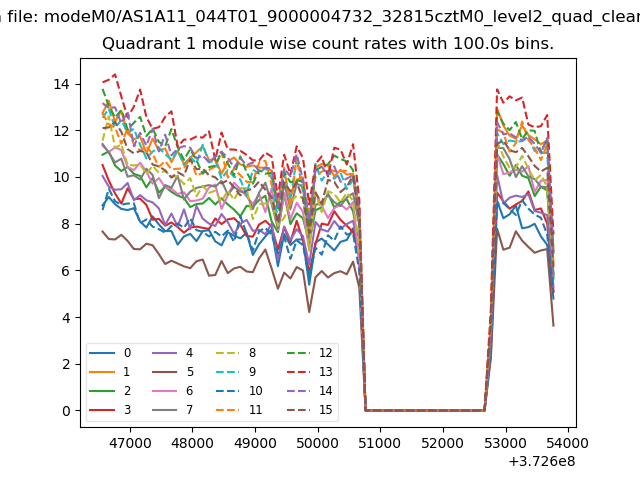
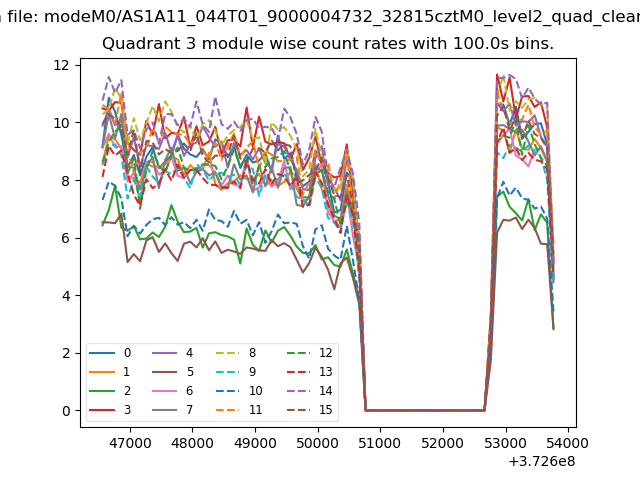
| Module-wise count rates for Quadrant A Data is divided into 100 sec bins |
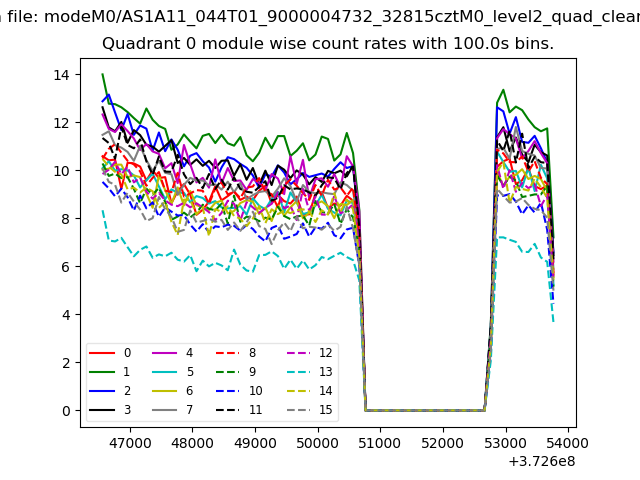 |
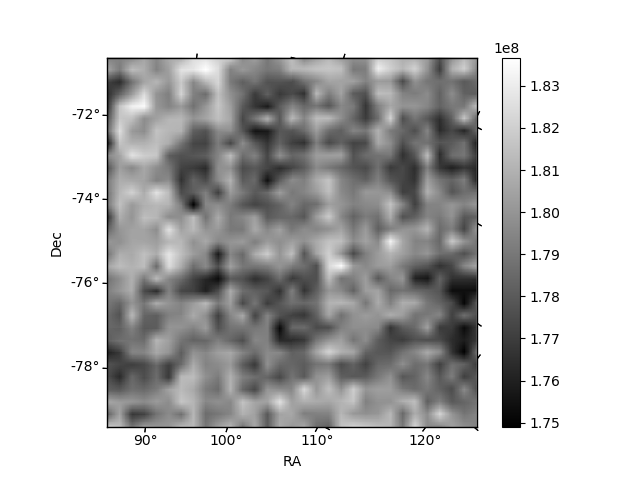 |
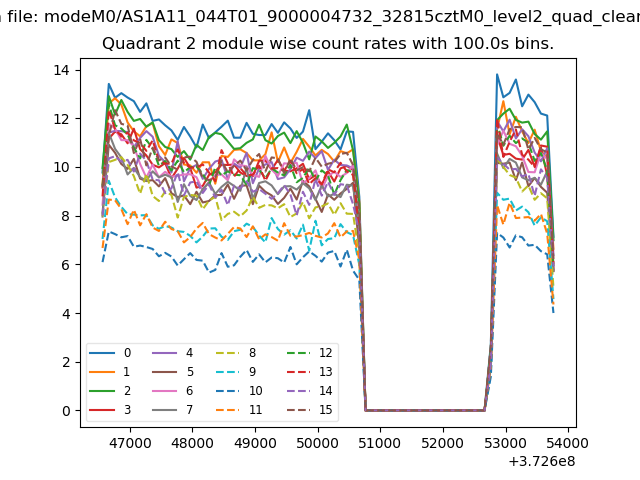
| Module-wise count rates for Quadrant B Data is divided into 100 sec bins |
 |
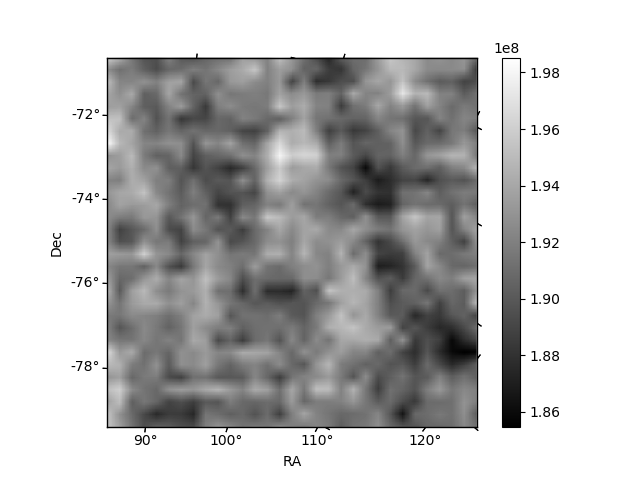 |
| Module-wise count rates for Quadrant C Data is divided into 100 sec bins |
 |
 |
| Module-wise count rates for Quadrant D Data is divided into 100 sec bins |
 |
 |
| Parameter | Plot |
|---|---|
| CZT HV Monitor | 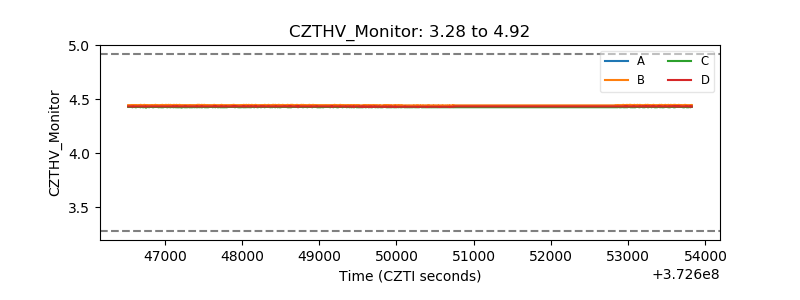 |
| D_VDD | 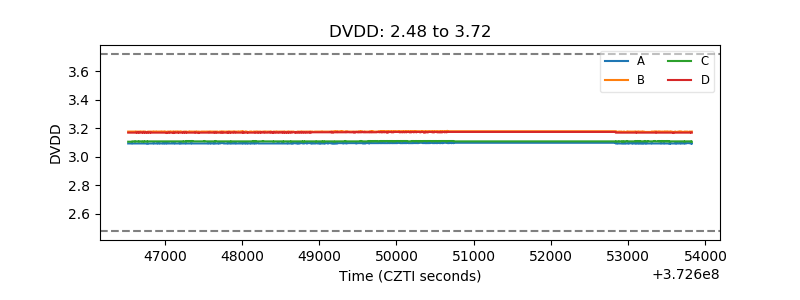 |
| Temperature 1 | 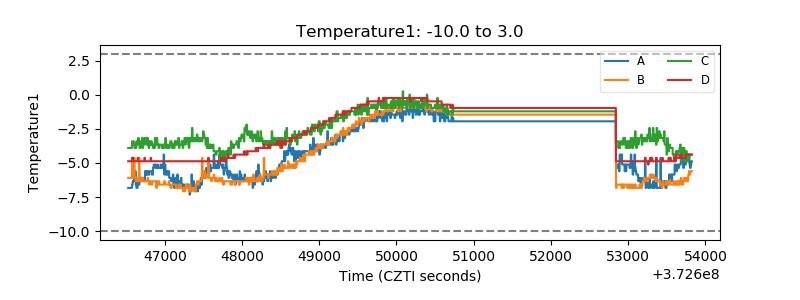 |
| Veto HV Monitor |  |
| Veto LLD | 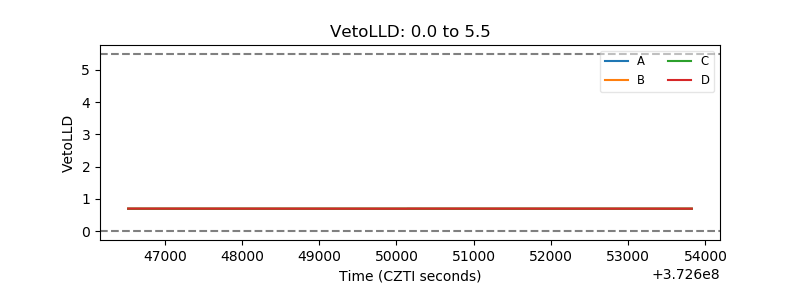 |
| Alpha Counter | 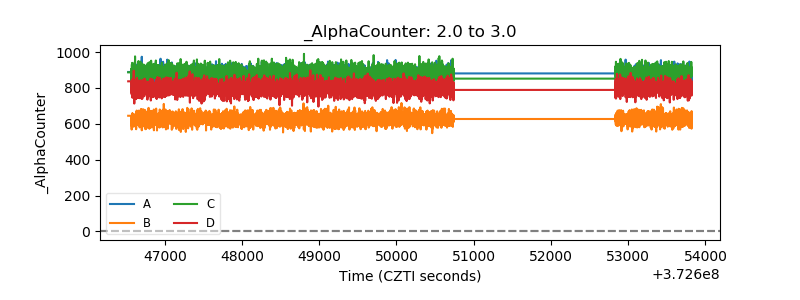 |
| _CPM_Rate | 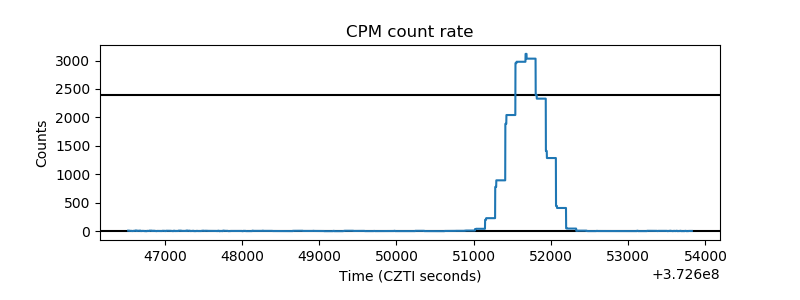 |
| CZT Counter | 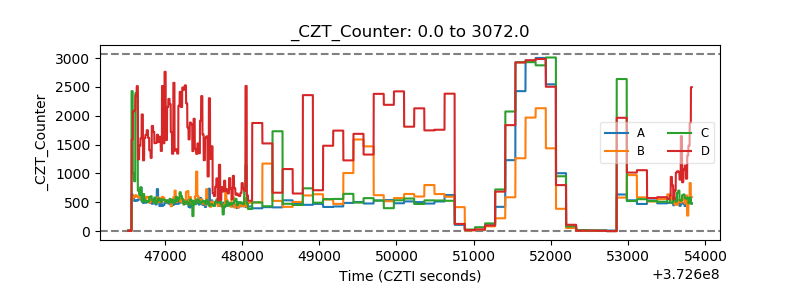 |
| +2.5 Volts monitor |  |
| +5 Volts monitor |  |
| _ROLL_ROT | 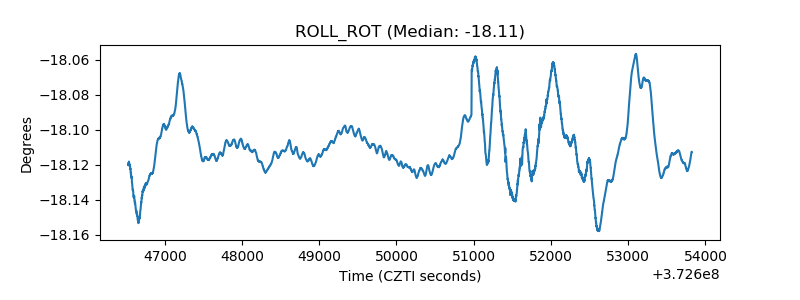 |
| _Roll_DEC | 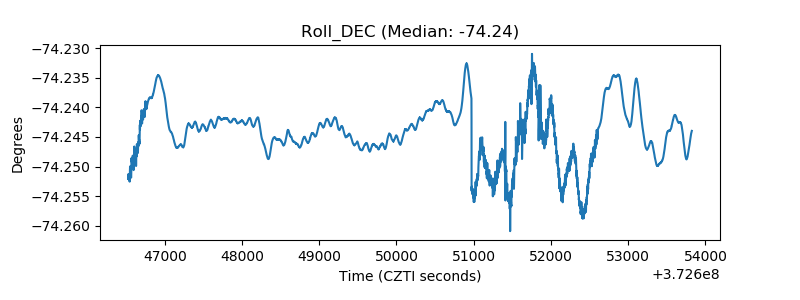 |
| _Roll_RA | 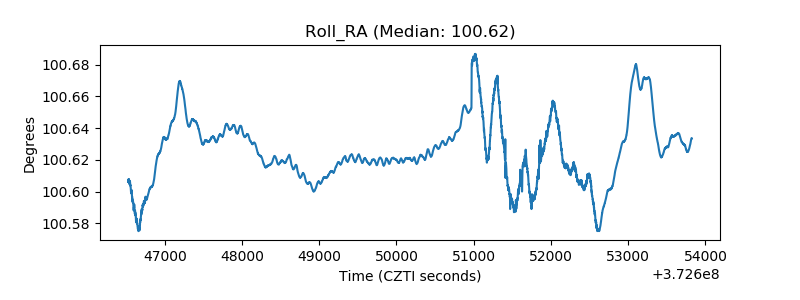 |
| Veto Counter | 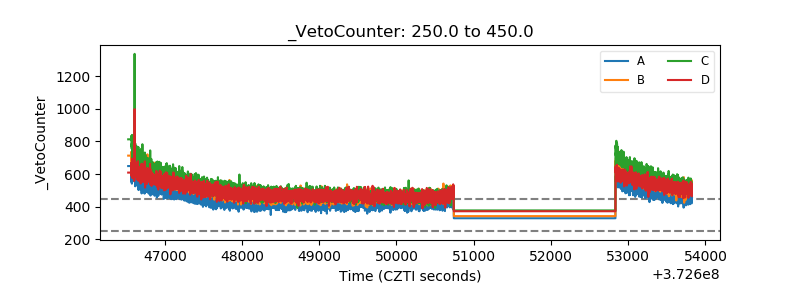 |