| Param | Original file | Final file |
|---|---|---|
| Filename | modeM0/AS1A11_044T01_9000004732_32816cztM0_level2.evt | modeM0/AS1A11_044T01_9000004732_32816cztM0_level2_quad_clean.evt |
| Size (bytes) | 469,647,360 | 100,388,160 |
| Size | 447.9 MB | 95.7 MB |
| Events in quadrant A | 2,407,595 | 686,532 |
| Events in quadrant B | 3,447,601 | 684,809 |
| Events in quadrant C | 2,678,827 | 709,350 |
| Events in quadrant D | 5,367,063 | 625,772 |
| Mode M9 | |||
|---|---|---|---|
| Quadrant | BADHDUFLAG | Total packets | Discarded packets |
| A | 0 | 21 | 0 |
| B | 0 | 21 | 0 |
| C | 0 | 21 | 0 |
| D | 0 | 21 | 0 |
| Mode M0 | |||
|---|---|---|---|
| Quadrant | BADHDUFLAG | Total packets | Discarded packets |
| A | 0 | 10027 | 2 |
| B | 0 | 13229 | 1 |
| C | 0 | 10642 | 1 |
| D | 0 | 19404 | 1 |
| Mode SS | |||
|---|---|---|---|
| Quadrant | BADHDUFLAG | Total packets | Discarded packets |
| A | 0 | 98 | 0 |
| B | 0 | 98 | 0 |
| C | 0 | 98 | 0 |
| D | 0 | 98 | 0 |
| Quadrant | Total seconds | Saturated seconds | Saturation percentage |
|---|---|---|---|
| A | 4748 | 10 | 0.210615% |
| B | 4748 | 329 | 6.929233% |
| C | 4748 | 67 | 1.411120% |
| D | 4748 | 651 | 13.711036% |
Noise dominated data is calculated using 1-second bins in cleaned event files. If a bin has >2000 counts, and if more than 50% of those come from <1% of pixels, then it is considered to be noise-dominated and hence unusable.
| Quadrant | # 1 sec bins | Bins with >0 counts | Bins with >2000 counts | High rate bins dominated by noise | Noise dominated (total time) | Noise dominated (detector-on time) | Marked lightcurve |
|---|---|---|---|---|---|---|---|
| A | 6901 | 4749 | 3 | 3 | 0.04% | 0.06% | 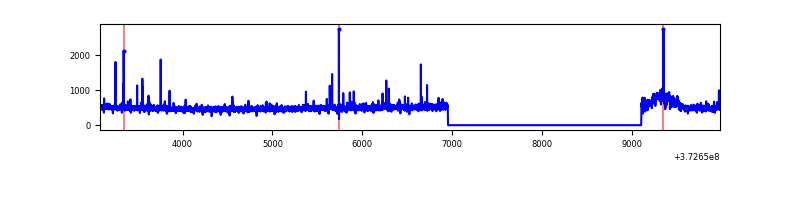 |
| B | 6901 | 4749 | 202 | 202 | 2.93% | 4.25% | 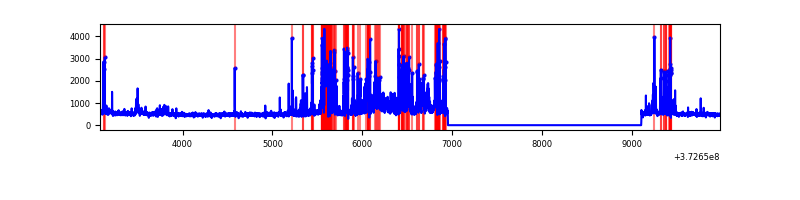 |
| C | 6901 | 4749 | 51 | 51 | 0.74% | 1.07% | 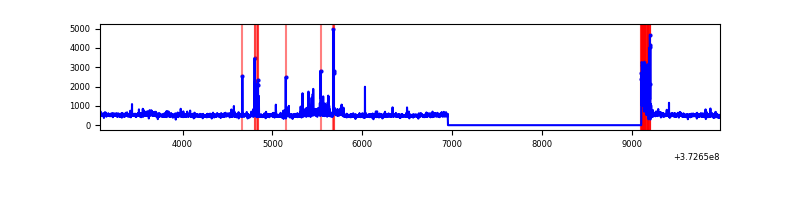 |
| D | 6901 | 4749 | 566 | 566 | 8.20% | 11.92% | 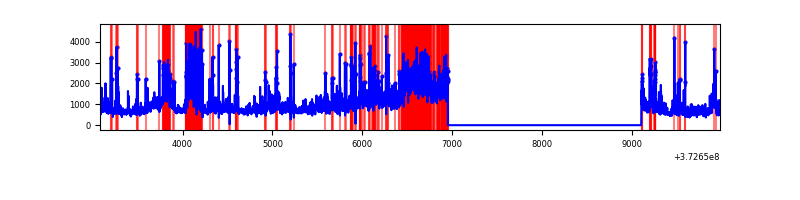 |
Top three noisy pixels from each quadrant. If the there are fewer than three noisy pixels in the level2.evt file, extra rows are filled as -1
| Pixel properties | Quadrant properties | ||||||
|---|---|---|---|---|---|---|---|
| Quadrant | DetID | PixID | Counts | Sigma | Mean | Median | Sigma |
| A | 10 | 228 | 89936 | 769.97 | 585 | 575 | 116.1 |
| A | 9 | 143 | 44473 | 378.24 | 585 | 575 | 116.1 |
| A | 13 | 254 | 9398 | 76.02 | 585 | 575 | 116.1 |
| B | 5 | 172 | 778264 | 7328.08 | 575 | 563 | 106.1 |
| B | 5 | 200 | 212300 | 1995.15 | 575 | 563 | 106.1 |
| B | 12 | 1 | 49978 | 465.63 | 575 | 563 | 106.1 |
| C | 0 | 10 | 204777 | 1523.33 | 587 | 593 | 134.0 |
| C | 15 | 159 | 38395 | 282.03 | 587 | 593 | 134.0 |
| C | 14 | 67 | 31355 | 229.5 | 587 | 593 | 134.0 |
| D | 8 | 195 | 1148632 | 8197.61 | 559 | 546 | 140.1 |
| D | 12 | 6 | 586401 | 4183.15 | 559 | 546 | 140.1 |
| D | 10 | 203 | 386331 | 2754.6 | 559 | 546 | 140.1 |
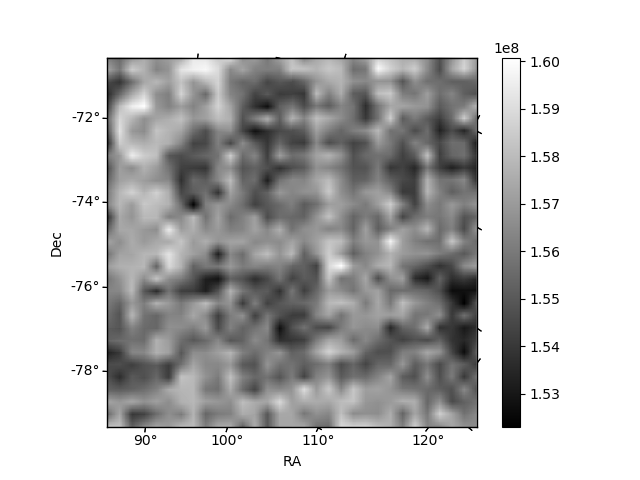
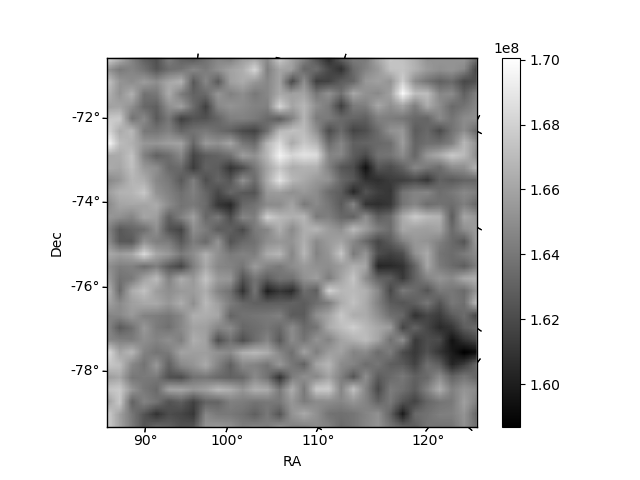
Histogram calculated using DETX and DETY for each event in the final _common_clean file
| Quadrant A | 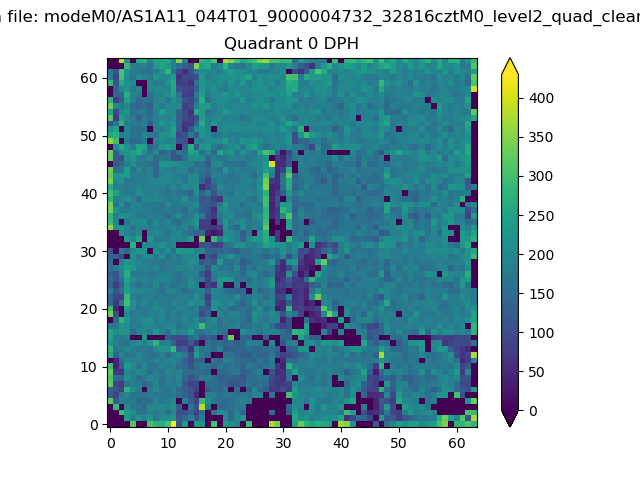 |
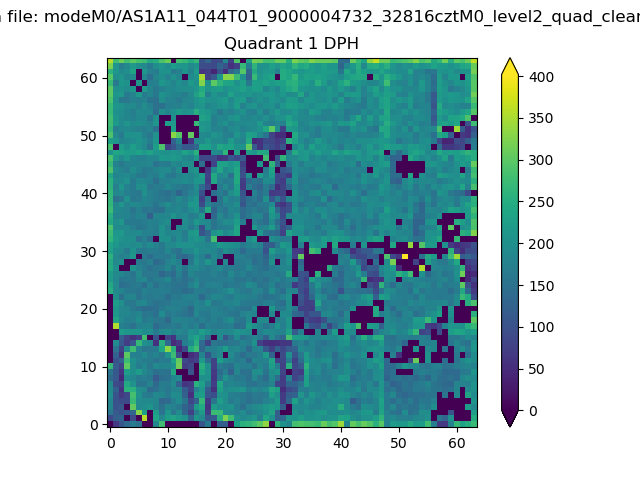 |
Quadrant B |
|---|---|---|---|
| Quadrant D | 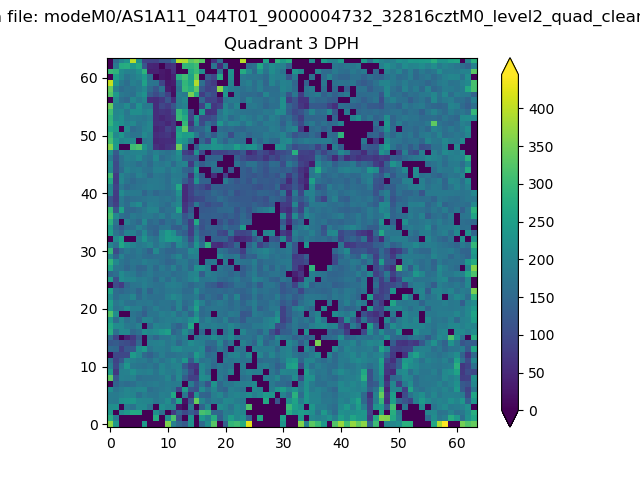 |
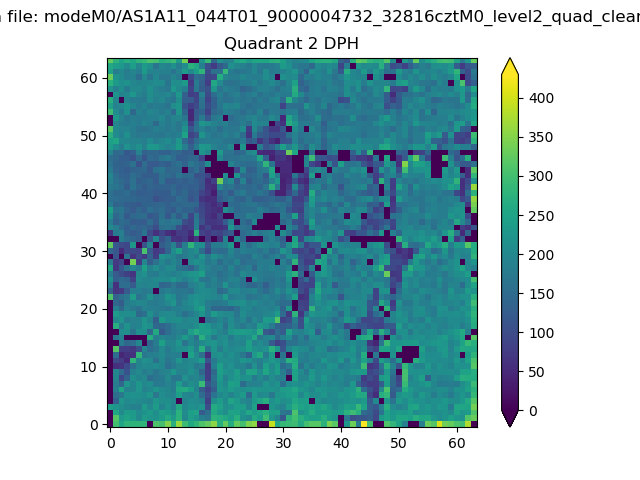 |
Quadrant C |
| Plot type | Count rate plots | Images |
|---|---|---|
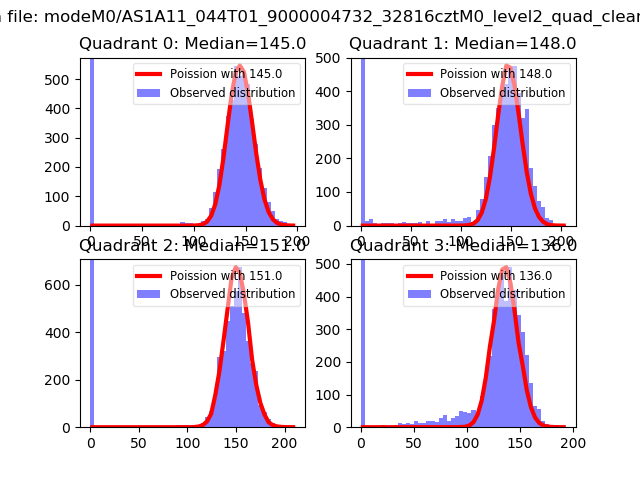
| Comparison with Poisson distribution Blue bars denote a histogram of data divided into 1 sec bins. Red curve is a Poisson curve with rate = median count rate of data. |
 |
 |
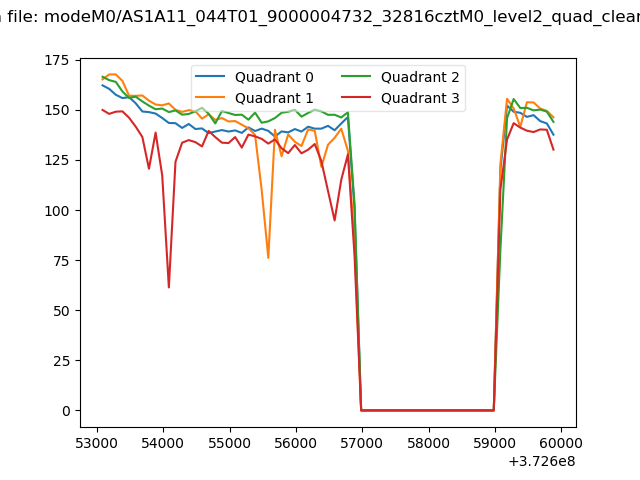
| Quadrant-wise count rates Data is divided into 100 sec bins |
 |
|
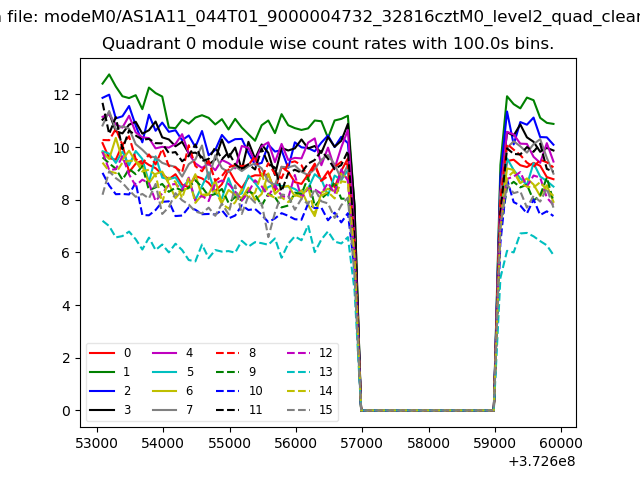
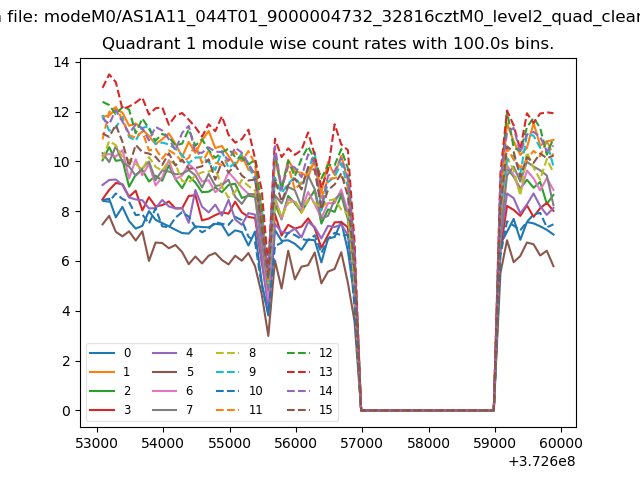
| Module-wise count rates for Quadrant A Data is divided into 100 sec bins |
 |
 |
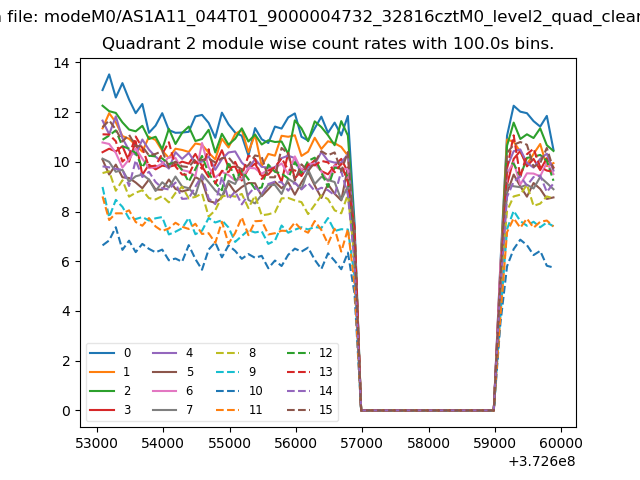
| Module-wise count rates for Quadrant B Data is divided into 100 sec bins |
 |
 |
| Module-wise count rates for Quadrant C Data is divided into 100 sec bins |
 |
 |
| Module-wise count rates for Quadrant D Data is divided into 100 sec bins |
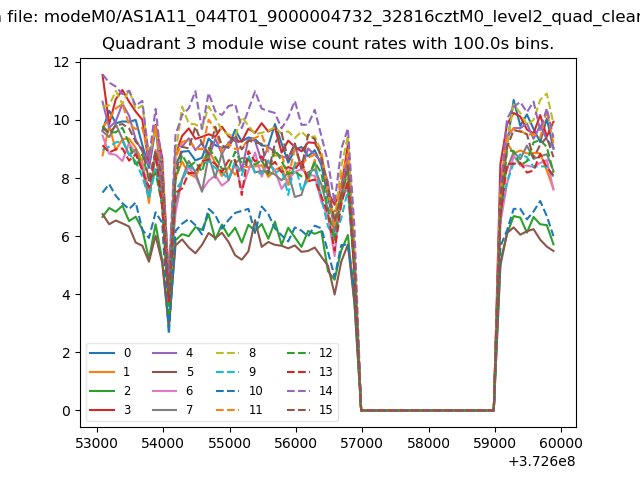 |
 |
| Parameter | Plot |
|---|---|
| CZT HV Monitor | 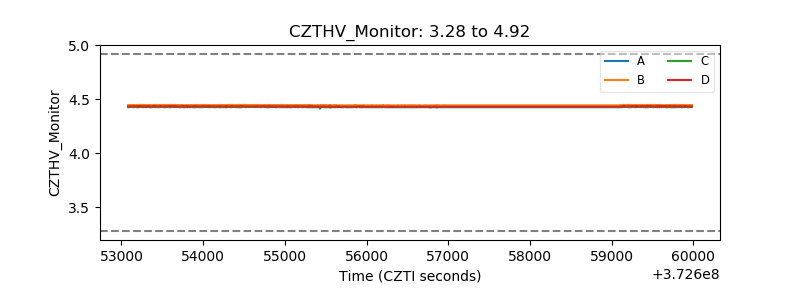 |
| D_VDD | 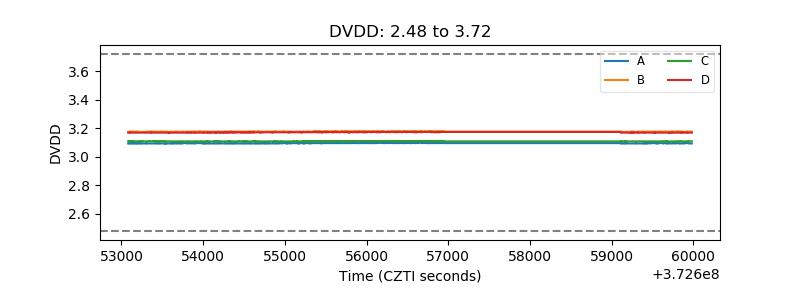 |
| Temperature 1 | 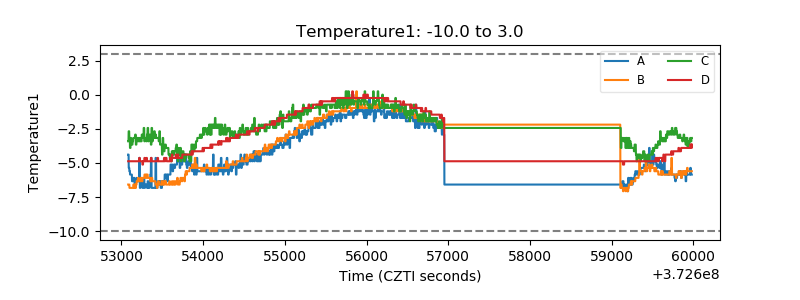 |
| Veto HV Monitor | 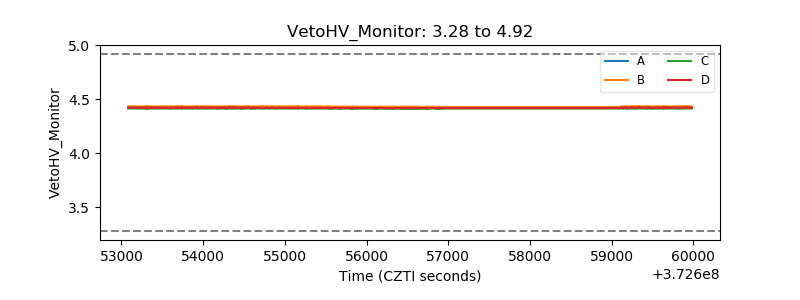 |
| Veto LLD | 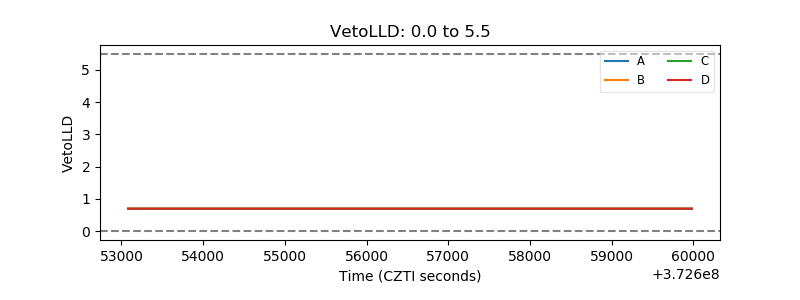 |
| Alpha Counter | 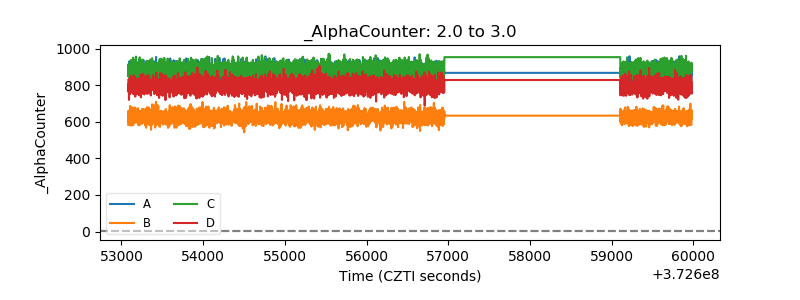 |
| _CPM_Rate | 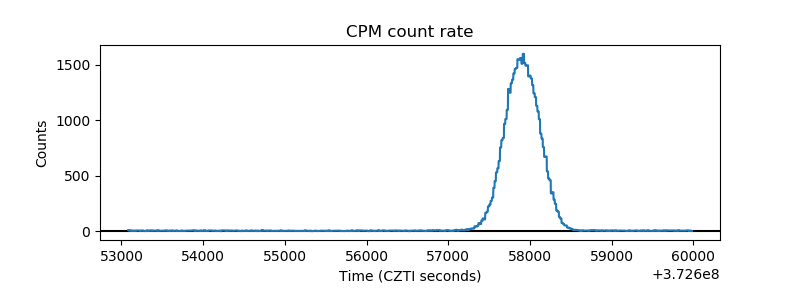 |
| CZT Counter | 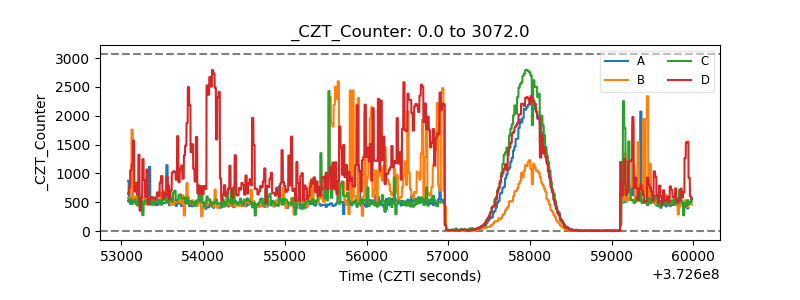 |
| +2.5 Volts monitor |  |
| +5 Volts monitor |  |
| _ROLL_ROT | 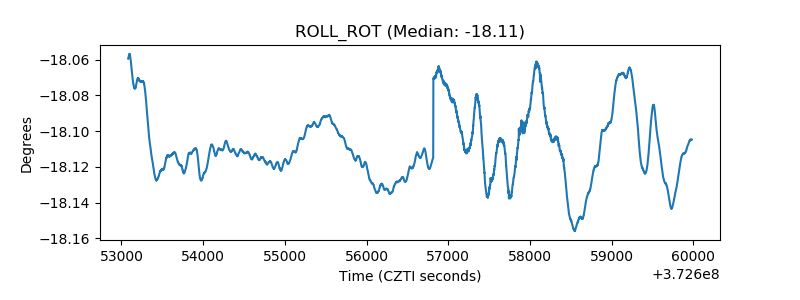 |
| _Roll_DEC | 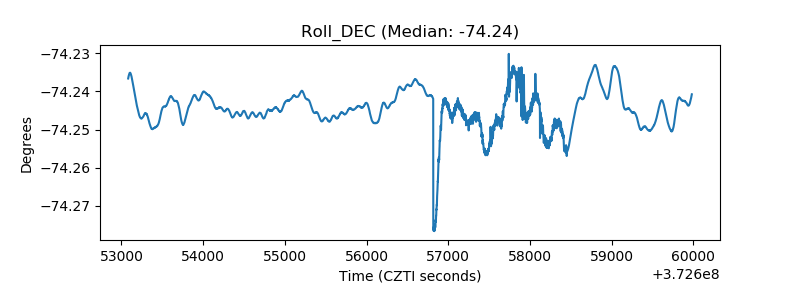 |
| _Roll_RA | 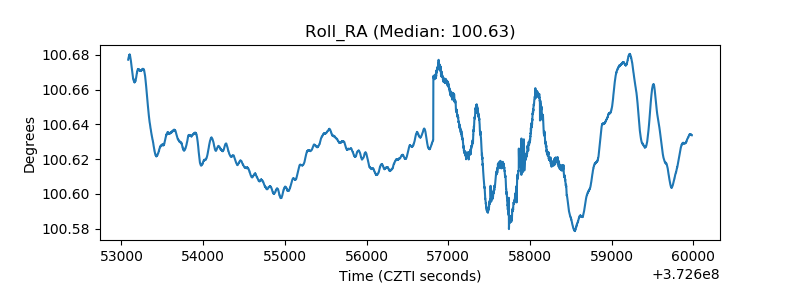 |
| Veto Counter | 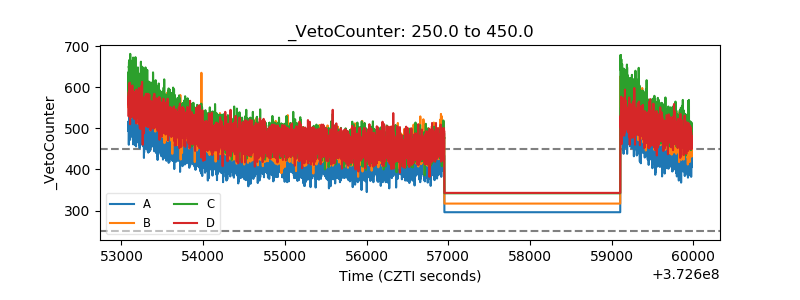 |